LC572: Quantitative Research on the Impact of Alcohol on Individuals

Verified

Added on  2023/06/10

|31
|3718
|374
Report
AI Summary
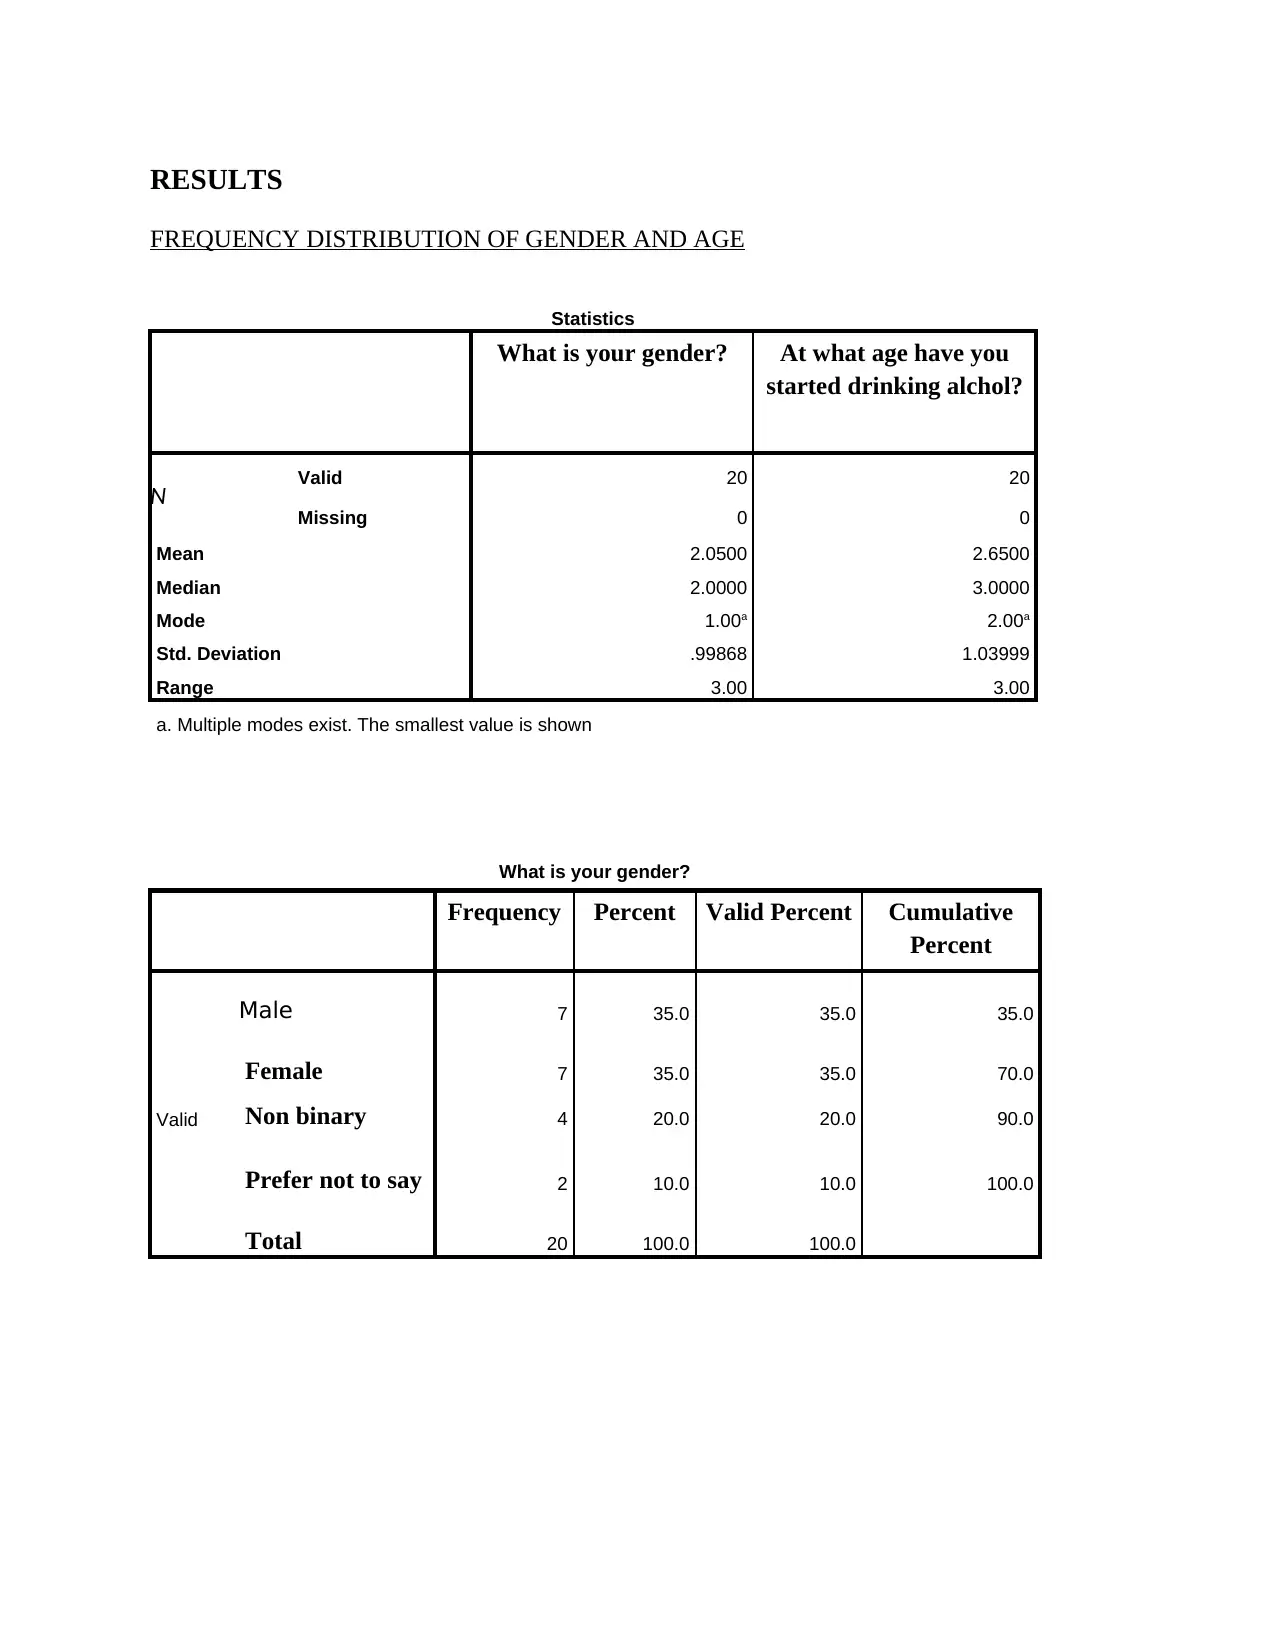
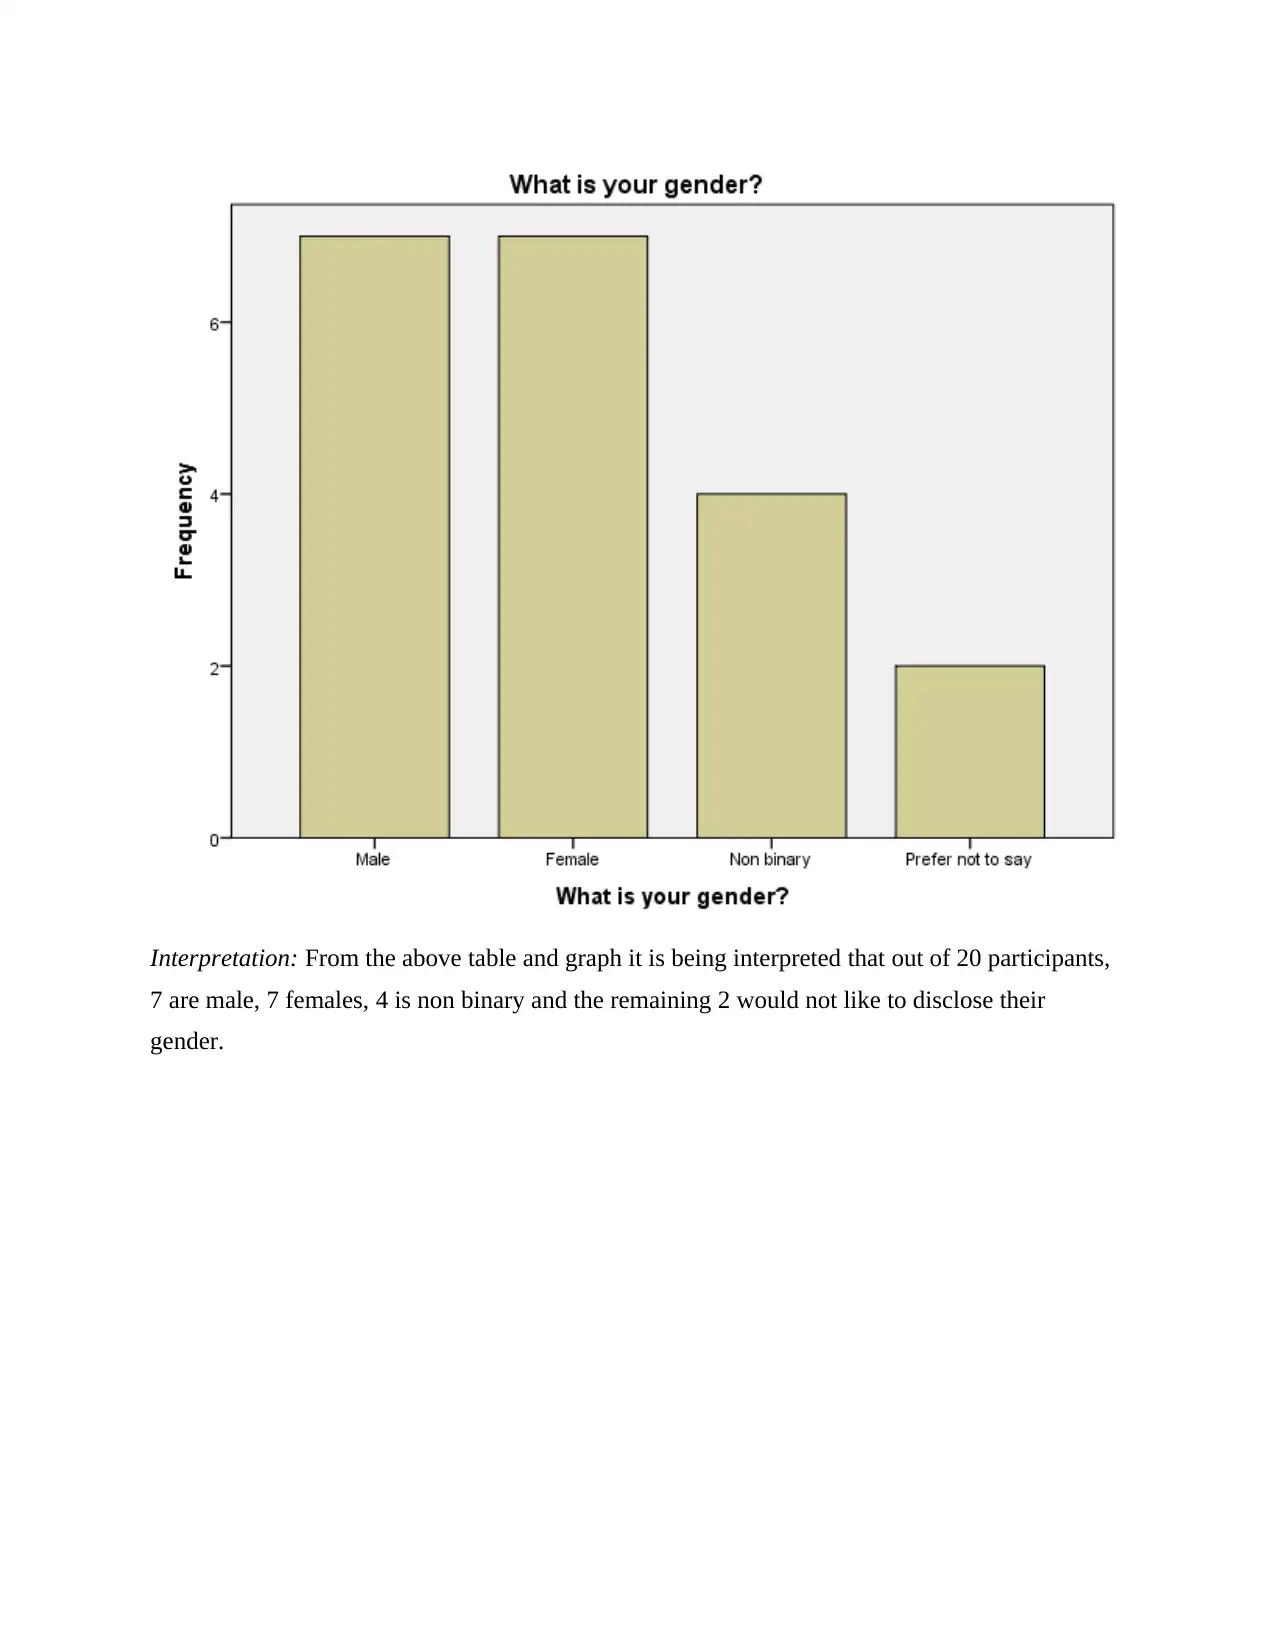
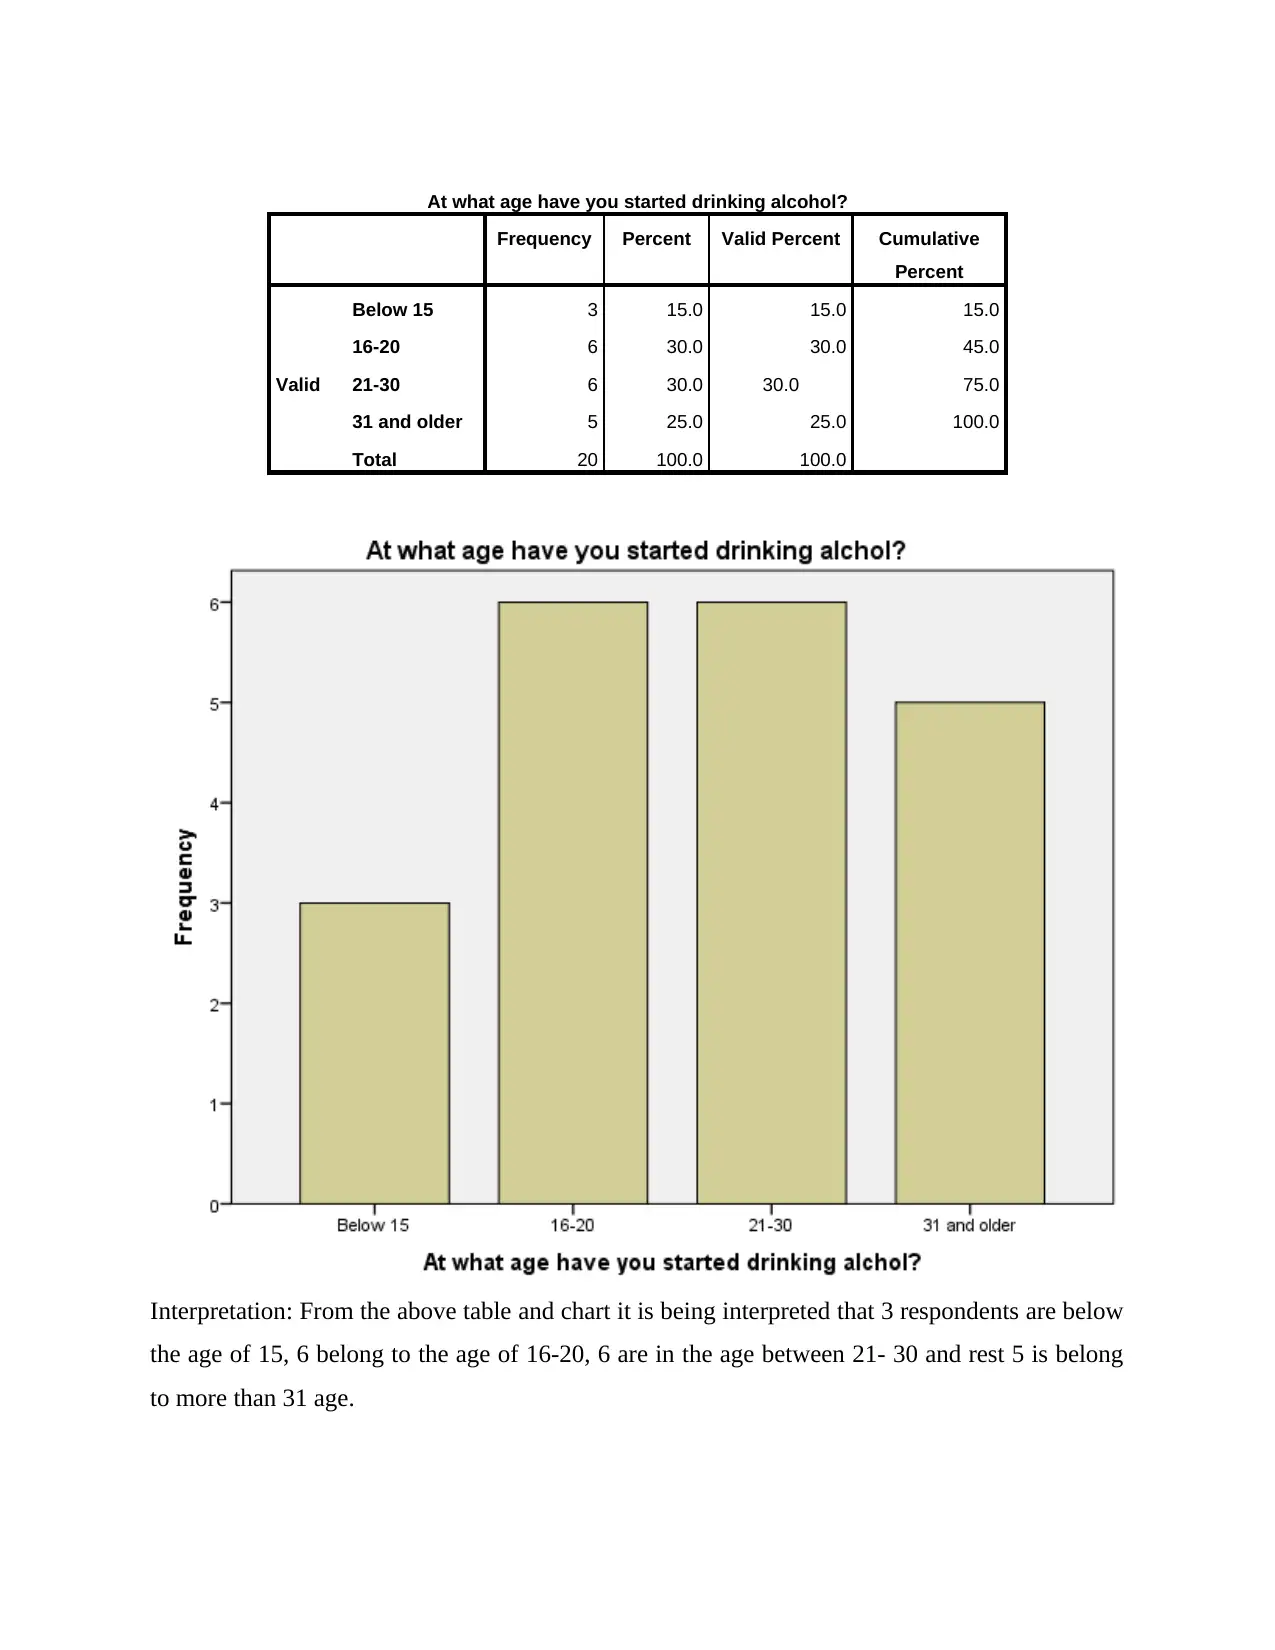
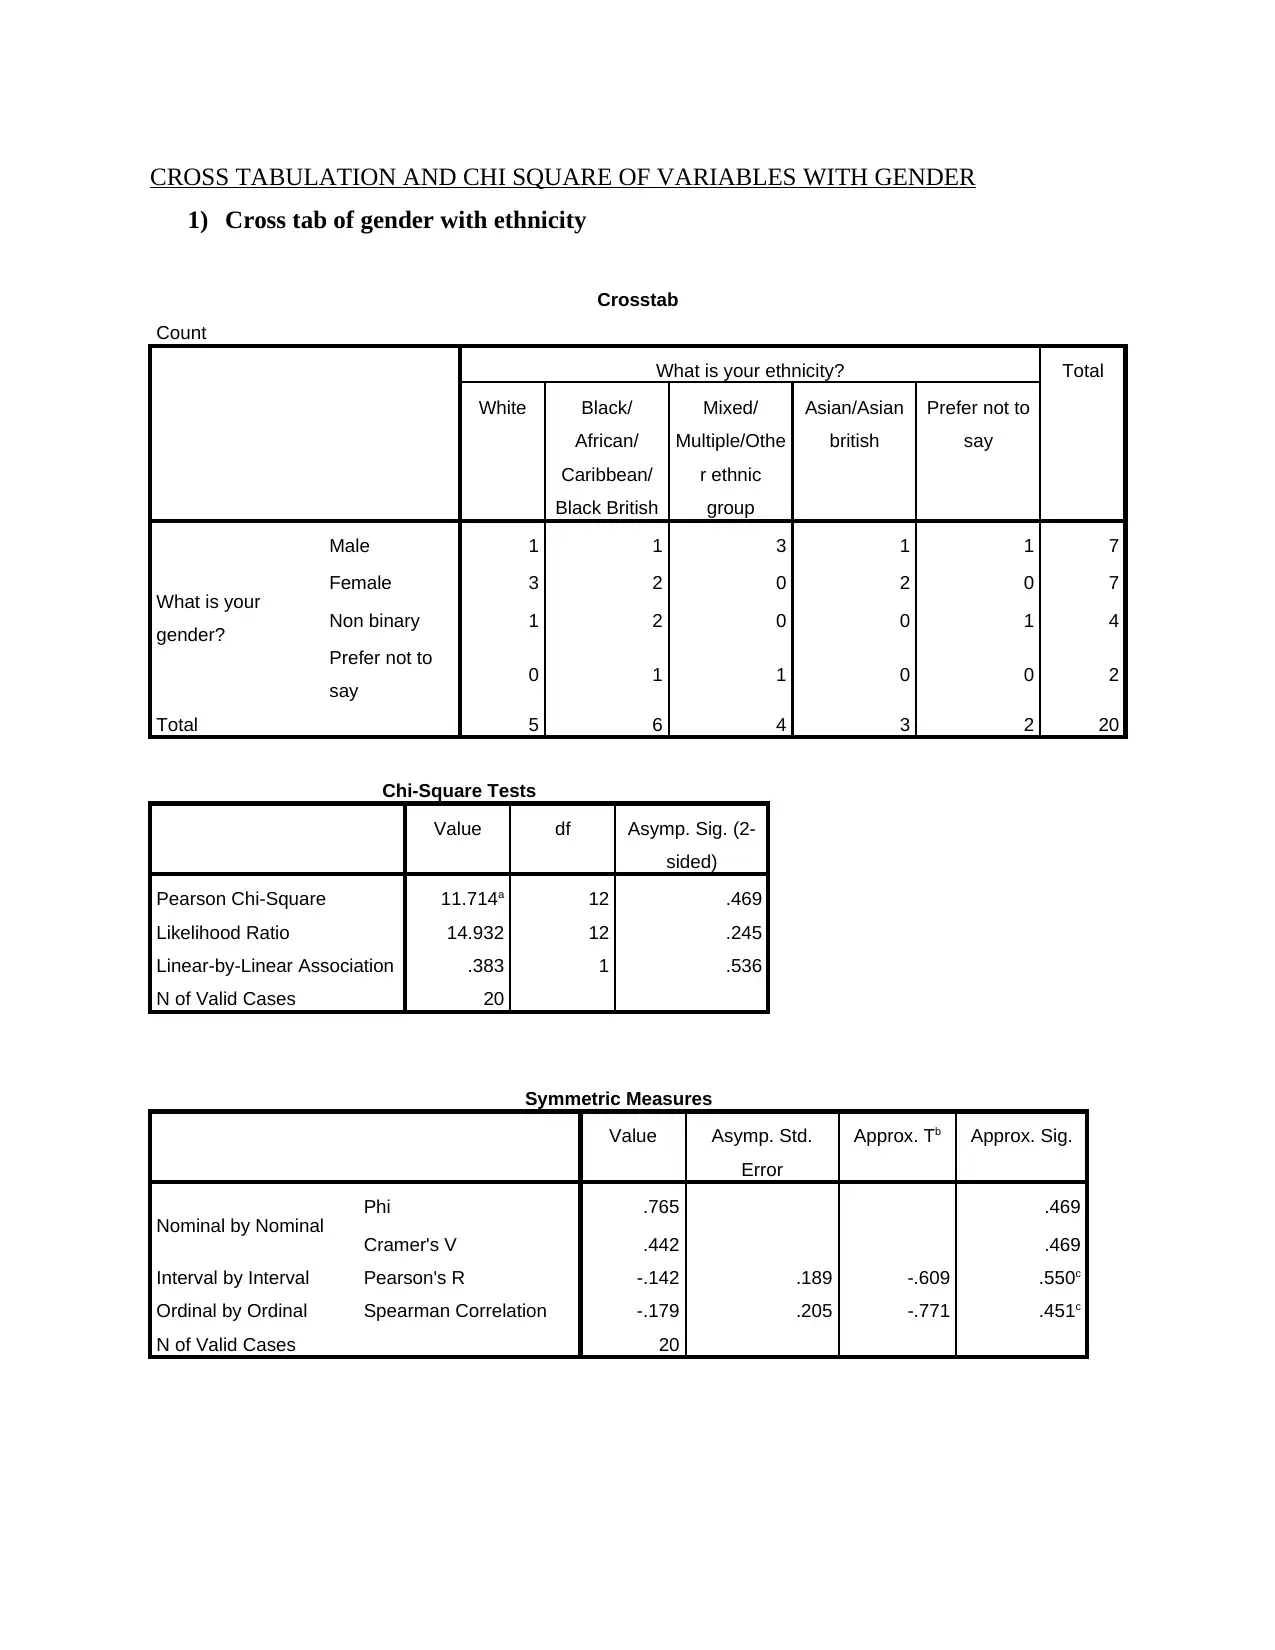
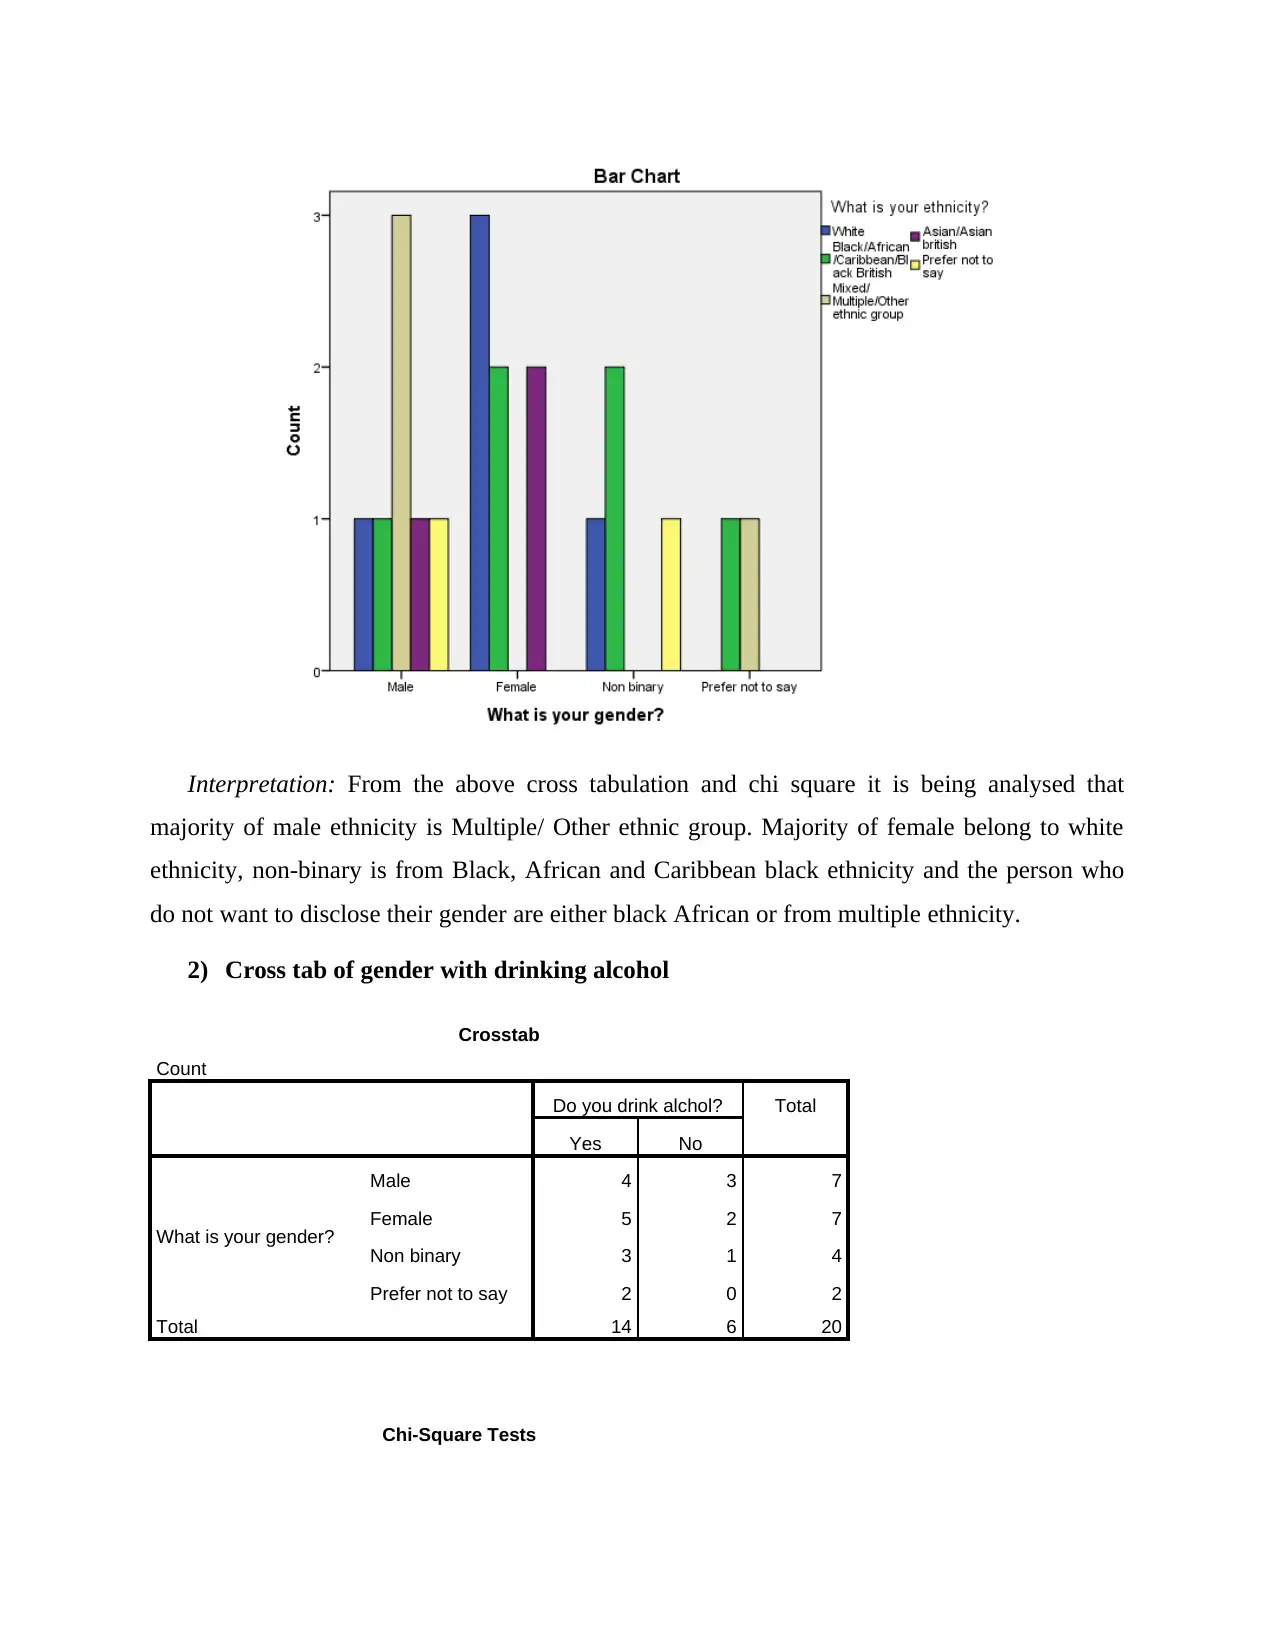
This report presents a quantitative analysis of the impact of alcohol on individuals, focusing on the consequences of alcoholism and its effects on mental health. The research employs a survey method with 20 respondents, utilizing both qualitative and quantitative processes for data evaluation. Ethical considerations were maintained by ensuring voluntary participation and honest reviews from respondents. The results include frequency distributions of gender and age, cross-tabulations, and chi-square tests to analyze the relationships between variables such as ethnicity, drinking habits, and perceptions of alcohol's impact on physical and mental health. The study also explores the perceived helpfulness of alcohol addiction clinics in treating alcoholism. The findings suggest varying opinions on the effects of alcohol on mental health and the effectiveness of addiction treatment, highlighting the complexities of alcohol-related issues.
Document Page
Research
tabler-icon-diamond-filled.svg

Paraphrase This Document

Need a fresh take? Get an instant paraphrase of this document with our AI Paraphraser
Document Page
Table of Contents
Title Alcohol....................................................................................................................................3
Abstract........................................................................................................................................3
Introduction..................................................................................................................................3
Rationale for doing the research..................................................................................................3
Research questions and aims.......................................................................................................3
Literature review..........................................................................................................................4
Methodology................................................................................................................................4
RESULTS........................................................................................................................................6
FREQUENCY DISTRIBUTION OF GENDER AND AGE......................................................6
CROSS TABULATION AND CHI SQUARE OF VARIABLES WITH GENDER.................9
CROSS TABULATION AND CHI SQUARE OF AGE WITH DIFFERENT VARIABLE...20
Discussion......................................................................................................................................30
Conclusion.....................................................................................................................................30
REFERENCES..............................................................................................................................31
Document Page
Title Alcohol
Abstract
Introduction
Alcoholism is defined as alcohol abuse and alcohol dependence. This is basically referred
as a disorder which occurs when a person drinks so much that his body eventually becomes
addicted towards alcohol. For such people, alcohol become the most important thing in their life.
Individuals were suffering from alcohol disorder are involved in drinking and it causes negative
consequences in their personal as well as professional life. The main reason of alcohol use
disorder is not known by scientists. This disorder develops when a person drinks so much that
chemical changes occur in brain. Due to these changes, there is increment of pleasurable feelings
required by the body. This makes the person to drink more and cause harm to himself. There are
different symptoms of alcohol which depends upon physical outcome and behaviour which
occurs as the obsession of alcohol. People who start suffering from alcohol disorder drink alone,
drink more towards feeling the effect of alcohol, do not eat properly, miss work or school
because of drinking, make excuses for drinking and continue to drink when social, legal or
economic problems are present.
Rationale for doing the research
This research is conducted in order to understand the consequences of alcoholism on
mental health of individuals. This study provides help in understanding different ways that can
be used by people to stop drinking and focus towards leading a healthy life.
Research questions and aims
Research aim - To analyse the impact of alcohol on individuals
Research objectives
Document Page
To assess consequences of alcoholism
To evaluate impact of alcoholism on mental health
Literature review
Alcoholism or heavy drinking interferes with chemicals in brain which are essential for
good mental health. That is why if a person is feeling relaxed after a drink but for long run and
call is having impact upon mental health and it also contributes to depression and anxiety among
them. Brain depends upon delicate balance between different processes and chemicals. There are
different conditions like long term mental health including putting down neurotransmitters which
includes chemicals in which transmission of signal takes place from one nerve to the other.
When a person drinks more, it impacts upon the functioning of brain. Regardless of the mood the
person is there is increase in alcohol consumption. There are several factors associated with
development of negative emotions when a person drinks. Alcohol is also associated with
increased aggression and anxiousness among people.
Methodology
Methods used and rationale for these – Survey method
Sampling and rationale for this – it is used to collect information from people who prone to
alcoholism
Research process – (e.g. what you did in practice) – qualitative and quantitative process is used
to evaluate research outcomes perfectly.
Ethical considerations – (e.g. what you did to ensure your research was ethical) – All
respondents are provided a questionnaire and they have to provide their honest reviews. No
person is under threat or pressure while filling questionnaires.
Reflexivity – (e.g. the part you played in the process and an evaluation of what you did)
tabler-icon-diamond-filled.svg

Paraphrase This Document

Need a fresh take? Get an instant paraphrase of this document with our AI Paraphraser
Document Page
I did the research part and collected data from different articles and respondents. This data is
used by me to make interpretations used for completing the research and making desired
outputs.
Document Page
RESULTS
FREQUENCY DISTRIBUTION OF GENDER AND AGE
Statistics
What is your gender? At what age have you
started drinking alchol?
N Valid 20 20
Missing 0 0
Mean 2.0500 2.6500
Median 2.0000 3.0000
Mode 1.00a 2.00a
Std. Deviation .99868 1.03999
Range 3.00 3.00
a. Multiple modes exist. The smallest value is shown
What is your gender?
Frequency Percent Valid Percent Cumulative
Percent
Valid
Male 7 35.0 35.0 35.0
Female 7 35.0 35.0 70.0
Non binary 4 20.0 20.0 90.0
Prefer not to say 2 10.0 10.0 100.0
Total 20 100.0 100.0
Document Page
Interpretation: From the above table and graph it is being interpreted that out of 20 participants,
7 are male, 7 females, 4 is non binary and the remaining 2 would not like to disclose their
gender.
tabler-icon-diamond-filled.svg

Paraphrase This Document

Need a fresh take? Get an instant paraphrase of this document with our AI Paraphraser
Document Page
At what age have you started drinking alcohol?
Frequency Percent Valid Percent Cumulative
Percent
Valid
Below 15 3 15.0 15.0 15.0
16-20 6 30.0 30.0 45.0
21-30 6 30.0 30.0 75.0
31 and older 5 25.0 25.0 100.0
Total 20 100.0 100.0
Interpretation: From the above table and chart it is being interpreted that 3 respondents are below
the age of 15, 6 belong to the age of 16-20, 6 are in the age between 21- 30 and rest 5 is belong
to more than 31 age.
Document Page
CROSS TABULATION AND CHI SQUARE OF VARIABLES WITH GENDER
1) Cross tab of gender with ethnicity
Crosstab
Count
What is your ethnicity? Total
White Black/
African/
Caribbean/
Black British
Mixed/
Multiple/Othe
r ethnic
group
Asian/Asian
british
Prefer not to
say
What is your
gender?
Male 1 1 3 1 1 7
Female 3 2 0 2 0 7
Non binary 1 2 0 0 1 4
Prefer not to
say 0 1 1 0 0 2
Total 5 6 4 3 2 20
Chi-Square Tests
Value df Asymp. Sig. (2-
sided)
Pearson Chi-Square 11.714a 12 .469
Likelihood Ratio 14.932 12 .245
Linear-by-Linear Association .383 1 .536
N of Valid Cases 20
Symmetric Measures
Value Asymp. Std.
Error
Approx. Tb Approx. Sig.
Nominal by Nominal Phi .765 .469
Cramer's V .442 .469
Interval by Interval Pearson's R -.142 .189 -.609 .550c
Ordinal by Ordinal Spearman Correlation -.179 .205 -.771 .451c
N of Valid Cases 20
Document Page
Interpretation: From the above cross tabulation and chi square it is being analysed that
majority of male ethnicity is Multiple/ Other ethnic group. Majority of female belong to white
ethnicity, non-binary is from Black, African and Caribbean black ethnicity and the person who
do not want to disclose their gender are either black African or from multiple ethnicity.
2) Cross tab of gender with drinking alcohol
Crosstab
Count
Do you drink alchol? Total
Yes No
What is your gender?
Male 4 3 7
Female 5 2 7
Non binary 3 1 4
Prefer not to say 2 0 2
Total 14 6 20
Chi-Square Tests
tabler-icon-diamond-filled.svg

Paraphrase This Document

Need a fresh take? Get an instant paraphrase of this document with our AI Paraphraser
Document Page
Value df Asymp. Sig. (2-
sided)
Pearson Chi-Square 1.463a 3 .691
Likelihood Ratio 1.999 3 .573
Linear-by-Linear Association 1.263 1 .261
N of Valid Cases 20
Symmetric Measures
Value Asymp. Std.
Errora
Approx. Tb Approx. Sig.
Nominal by Nominal Phi .270 .691
Cramer's V .270 .691
Interval by Interval Pearson's R -.258 .181 -1.132 .272c
Ordinal by Ordinal Spearman Correlation -.248 .201 -1.087 .291c
N of Valid Cases 20
Document Page
Interpretation: From the above table it is being analysed that majority of female participant’s
drinks alcohol. Out of 20 respondents 14 participant’s drinks alcohol and the rest 6 does not
drink alcohol.
3) Cross tab of gender with often drinking alcohol
Crosstab
How often do you drink alchol? Total
One time a
month
One time a
week
Two/ three
time a week
Every
day
What is your
gender?
Male 3 1 2 1 7
Female 2 2 1 2 7
Non binary 1 2 1 0 4
Prefer not to
say 0 0 1 1 2
Total 6 5 5 4 20
Chi-Square Tests
Value df Asymp. Sig. (2-
sided)
Pearson Chi-Square 5.810a 9 .759
Likelihood Ratio 7.155 9 .621
Linear-by-Linear Association .883 1 .347
N of Valid Cases 20
Symmetric Measures
Value Asymp. Std.
Errora
Approx. Tb Approx. Sig.
Nominal by Nominal Phi .539 .759
Cramer's V .311 .759
Interval by Interval Pearson's R .216 .207 .937 .361c
Ordinal by Ordinal Spearman Correlation .187 .216 .807 .430c
N of Valid Cases 20
chevron_up_icon
1 out of 31
circle_padding
hide_on_mobile
zoom_out_icon
[object Object]