LCBB5000: SPSS and Excel in Data Analysis for Business Intelligence
VerifiedAdded on 2023/01/03
|19
|2897
|437
Report
AI Summary
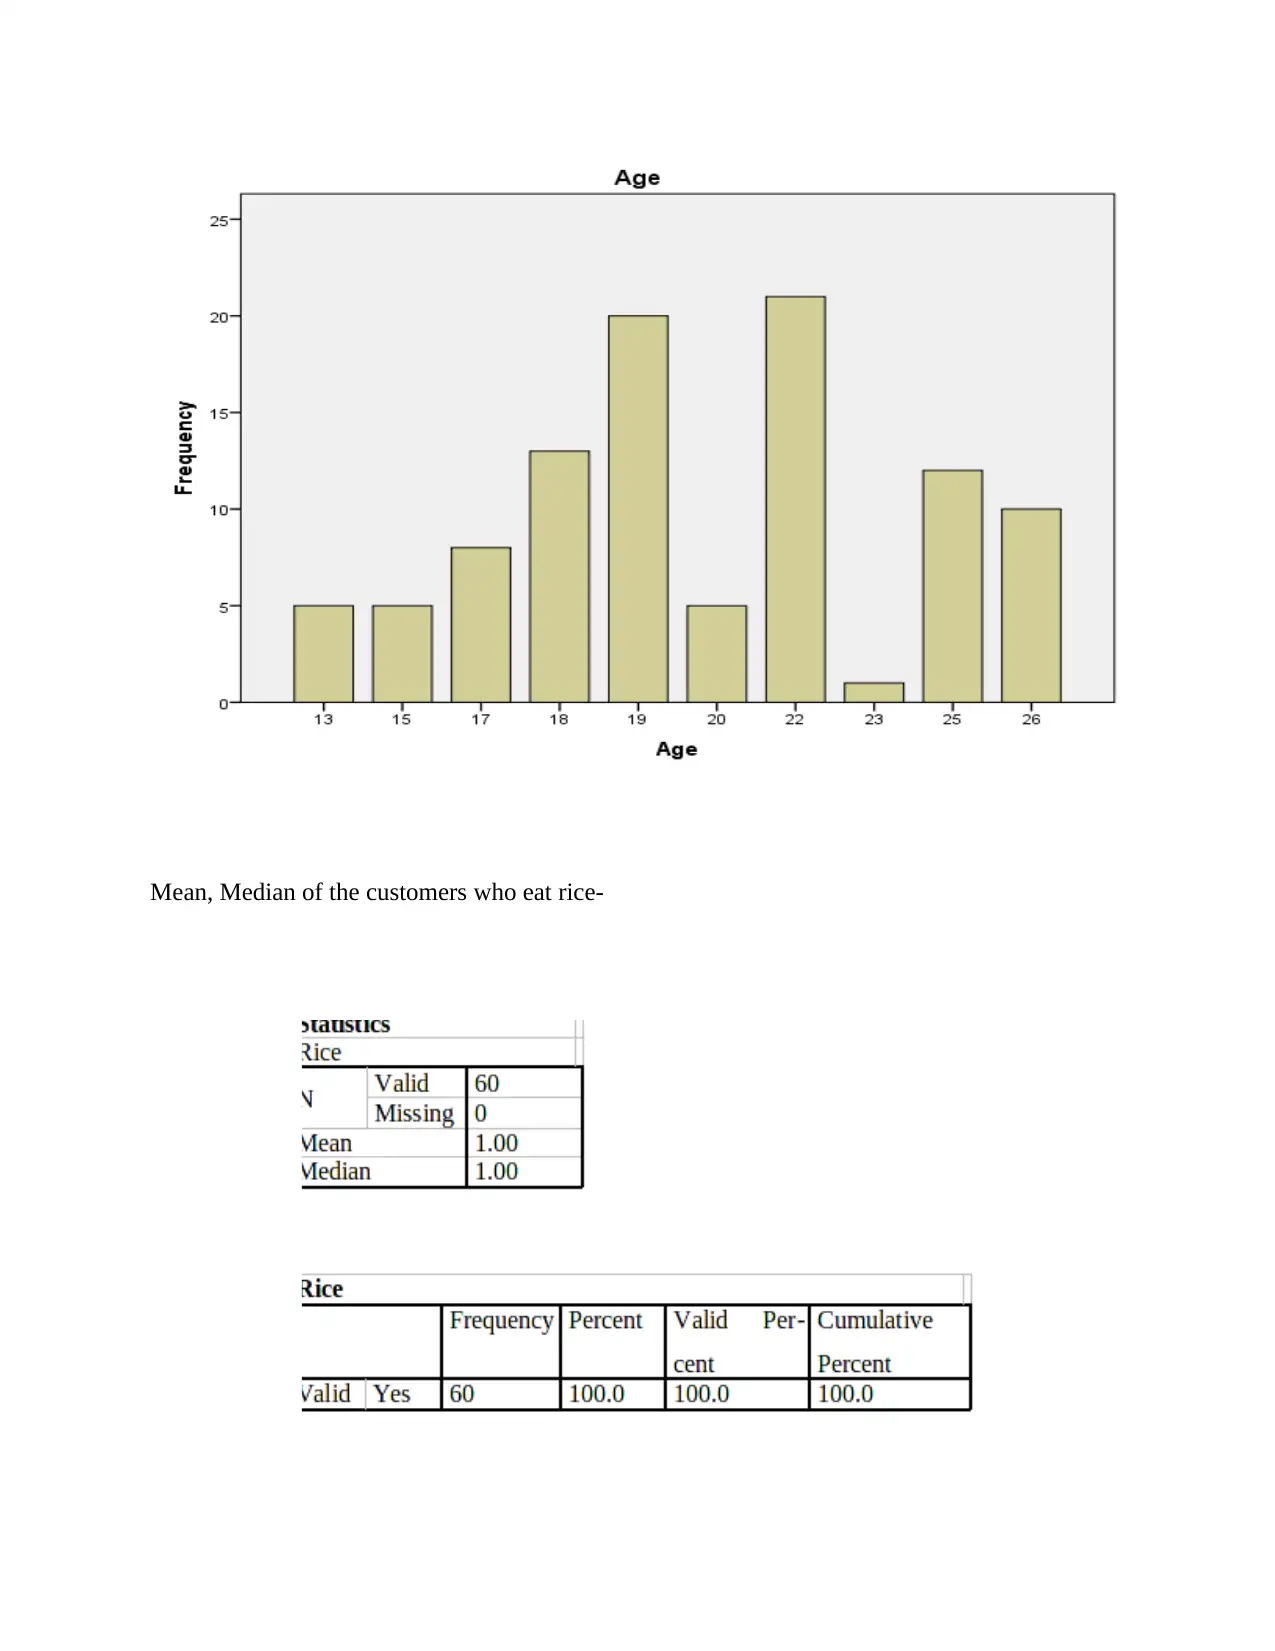
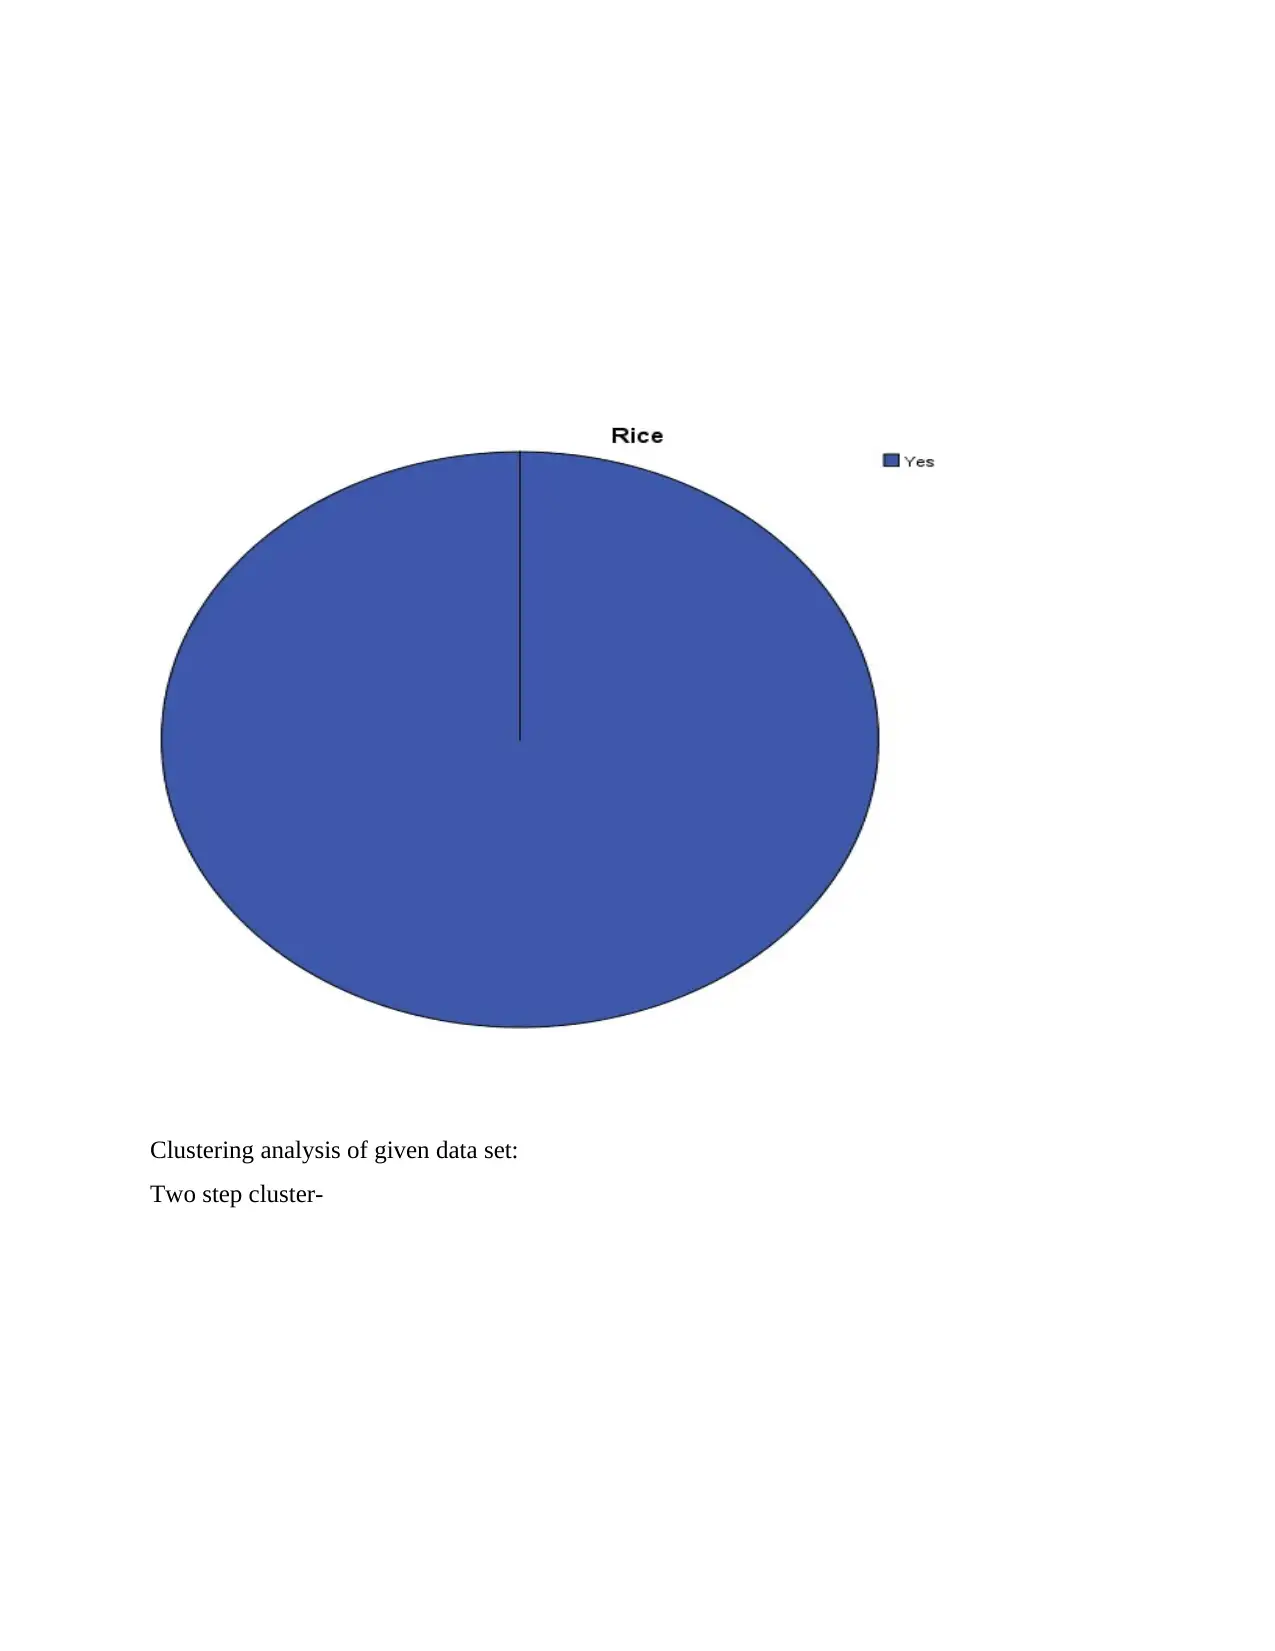
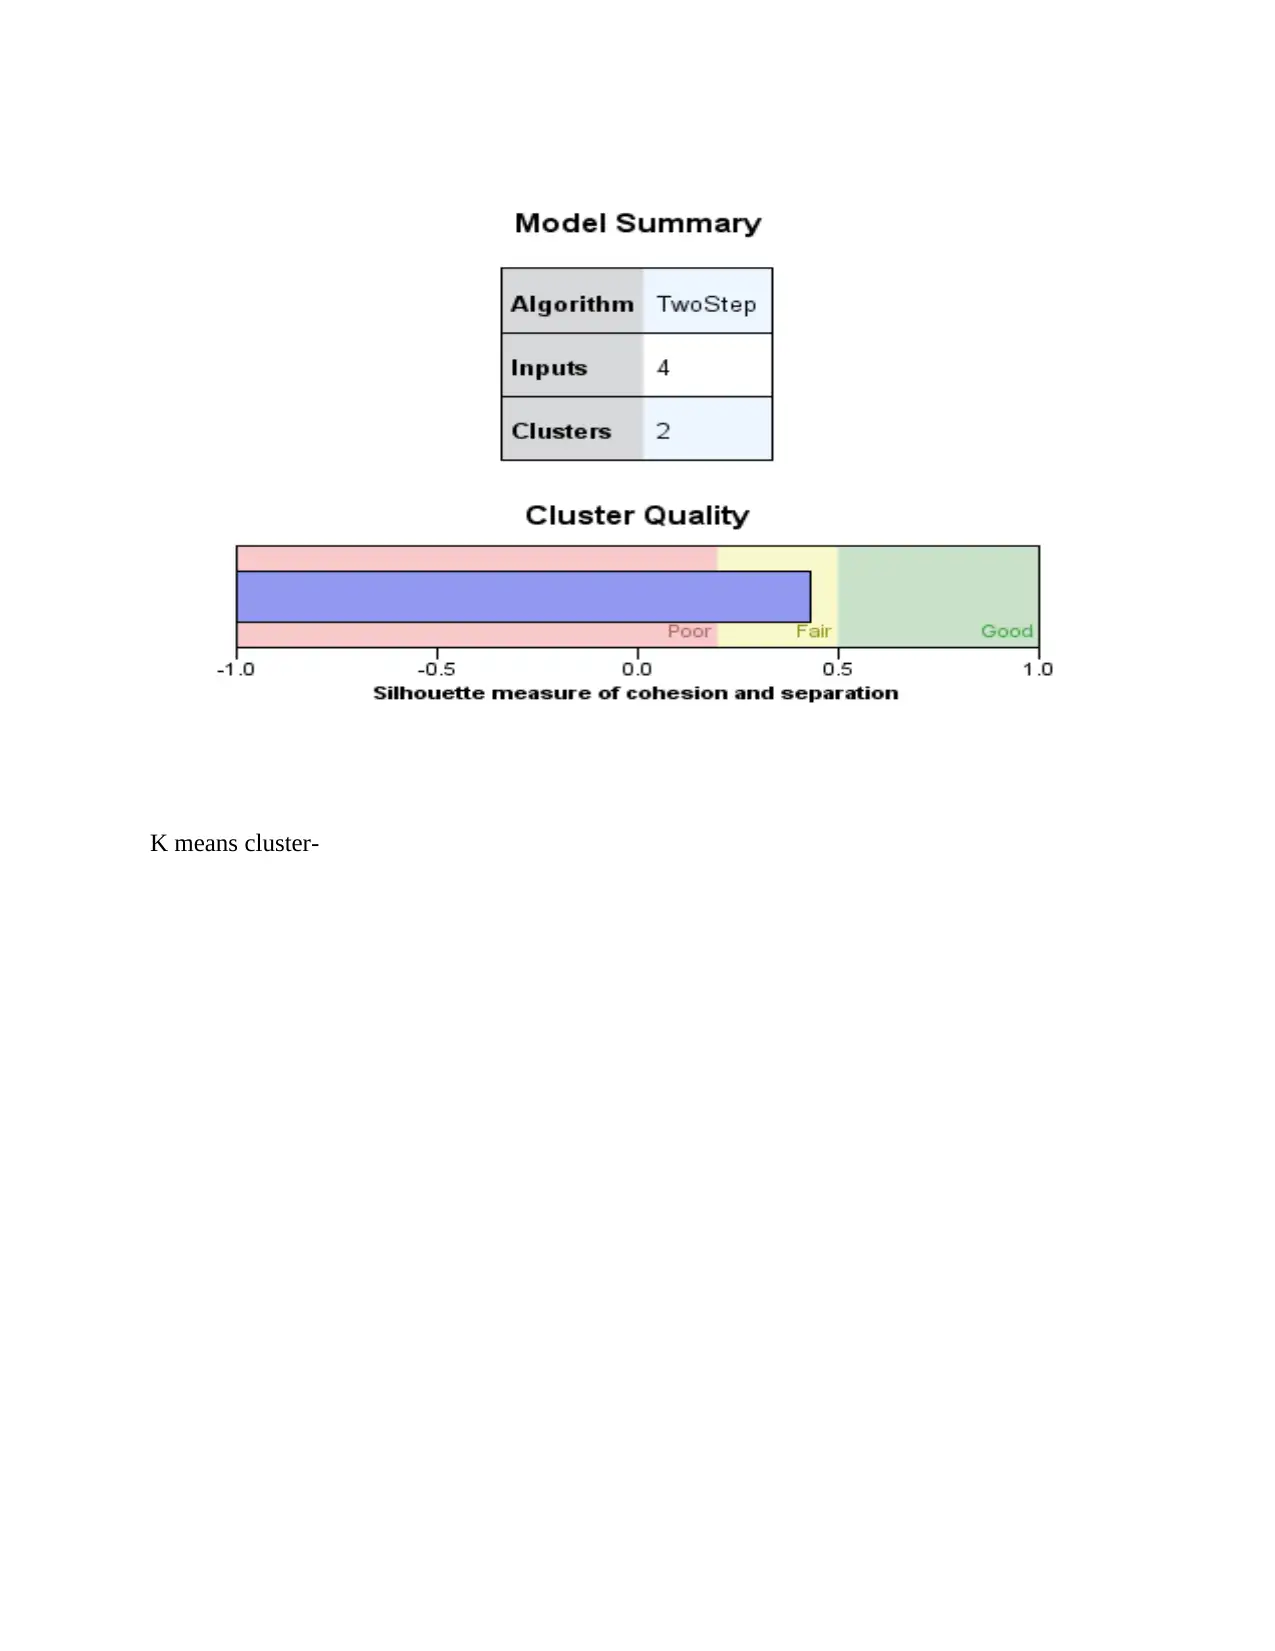
This report provides a comparative analysis of SPSS and Excel for data analysis in a business intelligence context. The first part focuses on the importance of Excel, detailing its functions like IF, Pivot Tables, LOOKUP, and Conditional Formatting for data preprocessing, analysis, and visualization, along with an analysis of sales decline in a given dataset. The second part uses SPSS to perform clustering analysis on customer data, examining rice consumption and gender distribution, and calculating mean and median ages. It also discusses popular data mining methods such as classification, clustering, prediction, and pattern tracking. The report concludes with a critical evaluation of the merits and demerits of using SPSS over Excel, highlighting SPSS's advanced statistical testing capabilities and limitations in handling large datasets, while acknowledging Excel's user-friendliness and cost-effectiveness.

Report SPSS
Secure Best Marks with AI Grader
Need help grading? Try our AI Grader for instant feedback on your assignments.

Contents
INTRODUCTION...........................................................................................................................3
MAIN BODY..................................................................................................................................3
Part 1............................................................................................................................................3
Part 2............................................................................................................................................6
CONCLUSION..............................................................................................................................17
REFERENCES................................................................................................................................1

INTRODUCTION
Data analysis is a useful term for each type of business entity for better decision-making. In
order to take corrective decision, it is essential to apply suitable technique of data analysis by
help of excel or any other tool (Alpar and Schulz, 2016). The report is based on two parts in
which first part contains detailed information about data of a superstore and this data set is
analysed through different kinds of functions of excel like IF, PIVOT TABLES etc. On the other
hands, in second part of report data of a clinic is included which is analysed through SPSS
functions. In the further section, different kinds of data mining methods are analysed and critical
evaluation of importance of SPSS over excel is done.
MAIN BODY
Part 1
Importance of excel: In modern time period, there is a wide range of excel functions which are
used by business entities and individuals to present and analyse the data in a manner which can
be used for better decision-making. Below some key importance of excel is explained with
rationale of processing of data, analysis of data and presentation of data:
Pre-processing the data-The term pre-processing of data can be understood as presenting the data
in a form which can be understandable of everyone (Wazurkar, Bhadoria and Bajpai, 2017). In
other words, pre-processing of data is a way of transforming raw data in an easy way. In this
aspect, excel plays a key role because by help of excel complexity of data set is removed and
data is presented in a manner by which users can read and can find out a suitable outcome. For
instance, in the excel filter function can be used for preprocessing of data set and such function
helps in sorting the data in set in a small form.
Analysing the data- This is also another important function of excel which is used to analyse the
data set. The term data analysis can be defined as a process of assessing the data set by help of
different kinds of techniques like mean, mode, median etc. This process can be completed
successfully by help of excel functions and tools. There are various kinds of formulas like if user
need to compute mean of a huge data set than it can be accomplished by applying =MEAN
formula in excel sheet. This way of data analysis reduce the effort and time of analyst as well as

there is a surety that produced outcomes are correct and can be used for decision making in an
effective manner.
Visualising the data- It is essential to present the data in a way which is attractive and
understandable. In order to do so graphs and tables play a key role which are offered under excel
sheet. As we can see that in the excel, users have variety of options of charts like bar chart, pie
chart, column chart and many more (Martínez-Rojas, Marín and Vila, 2016). In order to produce
such chart there is no complex process, users just need to select the data for which they want
chart and have to select type of chart. This process becomes too easier and helpful for many
companies and businesses to prepare an attractive way to present the data set. Apart from these
charts, there is another option by which data can be presented effectively like tables under which
users can fill the colour to make presentation more attractive.
So these are some key importance of excel for data set. Apart from this, in practical manner there
are different kinds of functions which can be used for above mentioned roles. Below description
of each function is done:
IF function- The IF feature is one of the most basic tasks in Excel and it helps you to make
rational distinctions between such a quality and what you anticipate (Nagar, Atriwal and Tayal,
2016). So an IF claim can have two outcomes. If your correlation is valid, the first outcome is the
double if your correlation is incorrect.
In Excel, a four - part period clause is included in the IF feature or IF argument. It is easy to see
in this case what revenue and benefit sums are decreased or even what period the buyer's charge
is, as well as how the IF feature is implemented point by point.
Cut/paste the taxable date, revenue and benefit again on separate pages for the first time.
Reorganize old data into quality assurance claim's main framework.
Use the type 'IF Element.' Shape a code of sort = if (virus type: B2>C3),
If the recipient satisfies the specifications, continue adding a cell key to be checked as
well.
Semi-colon Productive: Pick "Rise"
Delete the multipack; and press Continue if the requirement is not met.
If a feature stresses the value of B3, the function of B1 would mean that the criteria may be much
more critical than B3 if the output of B3 is better than those of segment B3. As this alternative
Secure Best Marks with AI Grader
Need help grading? Try our AI Grader for instant feedback on your assignments.

can be seen, consumers will get the layout of cell B4 as the press the Enter key. Seeing the effect,
move the deal from D4 to remote D8400.
If people should know which H Lookup and V backup are going to be in a process, they won't be
upset. A significant competence is that the customers like it or not. They will explore this in
detail as they interact to small numbers.
PIVOT table- A pivot table is a stats table that summarises a more detailed table's results. This
description could contain sums, estimates, or other figures that are grouped together in a
significant manner by the pivot table (Shollo and Galliers, 2016). In data analysis, pivot tables
are a procedure. In order to summarise, arrange, restructure, group, count, complete or average
data contained in a table, a Pivot Table is used. This makes it easy for us to turn rows through
rows upon rows into lines. It enables any area (column) to be clustered and detailed calculations
to be used.
LOOKUP function- The LOOKUP feature is graded under the Lookup and Comparison
functions in Excel. Whether in a one-row and one array, the method contains a rough fit search
and compares the result value from some other yet another or one-column scope. HLOOKUP
and VLOOKUP it is the more sophisticated variants of the LOOKUP feature. The big distinction
between the VLOOKUP and LOOKUP functions is that the VLOOKUP is restricted to
horizontal lookups only and bridge of the LOOKUP section ensures that both horizontal lookups
and vertical updates can be carried out.
Conditional formatting- Under the contingent type, it is necessary to classify all related entities.
There may also be other examples of a contingent prototype. This also refers to understanding of
meanings and acknowledgement of replication. Eventually Decide (CF) is a process that involves
coding an item or a row series and modifying the context of the measuring performance or
equation to the obligation tax. For example, whether the cell's vision is greater than 100. If the
performance of the cell matches the format specifications, the model they select is applied to the
cell (Khedr, Kholeif and Saad, 2017). The experienced people of the device can be used when
network security does not meet the format specifications. MS Excel ensures rigorous device
protection for sheets, making it easier for workers to track their performance. The three MS

Excel files were put inside an outstanding database using essential visual applications. In MS
Spread, they file the general details as well as keep the ordered data because that space is saved.
Everybody needs to be careful with their records, and MS Excel is very better at fixing this
dilemma. Yet none is aware of repairing it or destroying it.
Decline in sales of given data set:
The related figures state that the company had the average pay and the lowest investment in
January, too. In 2012, but at the other side, double the highest income was reported. The
statistics indicate that profits and profits differ significantly; the group experienced substantial
losses from 2009 to 2010, with the exception of 2012. True revenues improved over 2009, while
in 2009 there was no decline in following years.
Part 2
2.1 Specific example of clustering technique.
How many customers eat rice?

The above table and graph shows that out of 100 customers, 60% customers eat rice and 40% do
not eat rice.
How many customers are Male and Female?
not eat rice.
How many customers are Male and Female?
Paraphrase This Document
Need a fresh take? Get an instant paraphrase of this document with our AI Paraphraser

The above table and chart shows that out of 100 customers, 50% customers are male and 50%
are female.
Mean, Median of the ages in the data-
are female.
Mean, Median of the ages in the data-


Mean, Median of the customers who eat rice-
Secure Best Marks with AI Grader
Need help grading? Try our AI Grader for instant feedback on your assignments.

Clustering analysis of given data set:
Two step cluster-
Two step cluster-

K means cluster-

Initial Cluster Centers
Cluster
1 2
Interview
ID 4 100
Age 13 13
Gender 1 2
Rice 1 1
Number of Cases in each
Cluster
Cluster 1 51.000
2 49.000
Valid 100.000
Missing .000
Cluster
1 2
Interview
ID 4 100
Age 13 13
Gender 1 2
Rice 1 1
Number of Cases in each
Cluster
Cluster 1 51.000
2 49.000
Valid 100.000
Missing .000
Paraphrase This Document
Need a fresh take? Get an instant paraphrase of this document with our AI Paraphraser

2.2 Popular data mining methods.
Data mining- It is a mechanism by which a large volume of data derives valuable information or
expertise from (or big data). By using different data mining techniques, the distance between
data and analysis has been minimised (ohannessen and Fuglseth, 2016). It may also be referred
to as data exploration of information, or KDD.
Below some common techniques of data mining are demonstrated in such manner:
Classification- This can be understood as a form of data mining technique under which different
kinds of attributes of a particular data set are analysed in an effective manner. On the basis of
such method, it becomes easier for companies to prepare a septate portfolio of data set in
accordance of classified values of attributes. For instance, in manufacturing companies, this
method can be used in order to assess trend in sales or customer demand by classification of data
set as per their attributes.

Clustering analysis- This approach is almost similar to above mentioned approach of
classification (Balachandran and Prasad, 2017). Under this technique, data set are classified on
the basis of their similarities. By help of such method, it becomes easier for companies to know
trend of those aspects which are almost similar during a particular time period. This technique
contains some clustering methods which are as:
Hierarchical Agglomerative methods
Grid-Based Methods
Partitioning Methods
Model-Based Methods
Density-Based Methods

Prediction- This can be defined as a form of data mining method that is used to forecast future
data trends on the basis of availability of current and past data set. The concept of such technique
is based on collaboration of other data mining methods like classification, clustering etc. For
example, if a sales manager of a company wants to predict sales revenue of each product than
this can be done in accordance of past sales revenue trends and current condition of company.
For better understanding below a graph is presented that is as follows:
Pattern tracking- This can be defined as a type of data mining method under which pattern or
trend of data set is analysed to find out a significant value for better decision-making. For
example, sales manager of air conditioner can see that sales seem to raise before starting of
summer season. Below a chart is presented for better understanding of pattern tracking method-
Secure Best Marks with AI Grader
Need help grading? Try our AI Grader for instant feedback on your assignments.

2.3 Merits and demerits of using SPSS over excel.
SPSS software has variety of tools and techniques which can be used for better data analysis.
Though excel also has some methods for data analysis but not in a detailed manner (Laursen and
Thorlund, 2016). Below some advantages and disadvantages of SPSS over excel are mentioned:
Merits-
Statistical tests are easier in SPSS- In the SPSS software, there are different kinds of
statistical tests which can be applied only by clicking on few tabs. These tests are too
complex to measure by an individual without using SPSS. On the other side, in excel it is
not easier for users to apply and find a suitable outcome for any statistical test. It is so
because of complexity of functions in excel.
Detailed charts and graphs- Another benefit of SPSS over excel is that under this
different kind of chart and graphs are included that can be used to present the data in
most attractive and effective manner. Though, in the excel there are some charts which
can be used to present the data but in SPSS users can construct the chart at own need of
presenting data on different axis.

Demerits-
Outdated interface- This is the main issue in SPSS that under it interface is too old which
does not seem attractive compared to outcome produced in excel sheet (Kumar and
Belwal, 2017).
It is not free- The SPSS software need to be purchased by users at a higher cost which is
not possible for all users. On the other hands, excel is free for users and can be shared by
users to others without any cost.
CONCLUSION
On the basis of above project report this can be concluded that this is mandatory for companies
to take suitable decisions by applying techniques of data analysis through excel functions or
SPSS. From first part of report this can be articulated that excel functions are useful to reduce
complexity of data set and to reach at a final outcome. While from second part of report this can
be concluded that SPSS performs better analysis rather than excel. This is so because of variety
of functions and tools available in SPSS.

REFERENCES
Books and Journals
Alpar, P. and Schulz, M., 2016. Self-service business intelligence. Business & Information
Systems Engineering, 58(2), pp.151-155.
Wazurkar, P., Bhadoria, R.S. and Bajpai, D., 2017, November. Predictive analytics in data
science for business intelligence solutions. In 2017 7th International Conference on
Communication Systems and Network Technologies (CSNT) (pp. 367-370). IEEE.
Martínez-Rojas, M., Marín, N. and Vila, M.A., 2016. The role of information technologies to
address data handling in construction project management. Journal of Computing in
Civil Engineering, 30(4), p.04015064.
Johannessen, T.V. and Fuglseth, A.M., 2016, November. Challenges of self-service business
intelligence. In Norsk konferanse for organisasjoners bruk at IT (Vol. 24, No. 1).
Balachandran, B.M. and Prasad, S., 2017. Challenges and benefits of deploying big data
analytics in the cloud for business intelligence. Procedia Computer Science, 112,
pp.1112-1122.
Laursen, G.H. and Thorlund, J., 2016. Business analytics for managers: Taking business
intelligence beyond reporting. John Wiley & Sons.
Kumar, S.M. and Belwal, M., 2017, August. Performance dashboard: Cutting-edge business
intelligence and data visualization. In 2017 International Conference On Smart
Technologies For Smart Nation (SmartTechCon) (pp. 1201-1207). IEEE.
Shollo, A. and Galliers, R.D., 2016. Towards an understanding of the role of business
intelligence systems in organisational knowing. Information Systems Journal, 26(4),
pp.339-367.
Khedr, A., Kholeif, S. and Saad, F., 2017. An integrated business intelligence framework for
healthcare analytics. International Journal, 7(5).
Nagar, P., Atriwal, L., Mehra, H. and Tayal, S., 2016, March. Comparison of generalized and big
data business intelligence tools. In 2016 3rd International Conference on Computing for
Sustainable Global Development (INDIACom) (pp. 3585-3588). IEEE.
1
1 out of 19
Related Documents

Your All-in-One AI-Powered Toolkit for Academic Success.
+13062052269
info@desklib.com
Available 24*7 on WhatsApp / Email
Unlock your academic potential
© 2024 | Zucol Services PVT LTD | All rights reserved.