Report: Leadership Styles and Employee Performance in Nigerian Banks
VerifiedAdded on  2021/04/19
|24
|3827
|27
Report
AI Summary
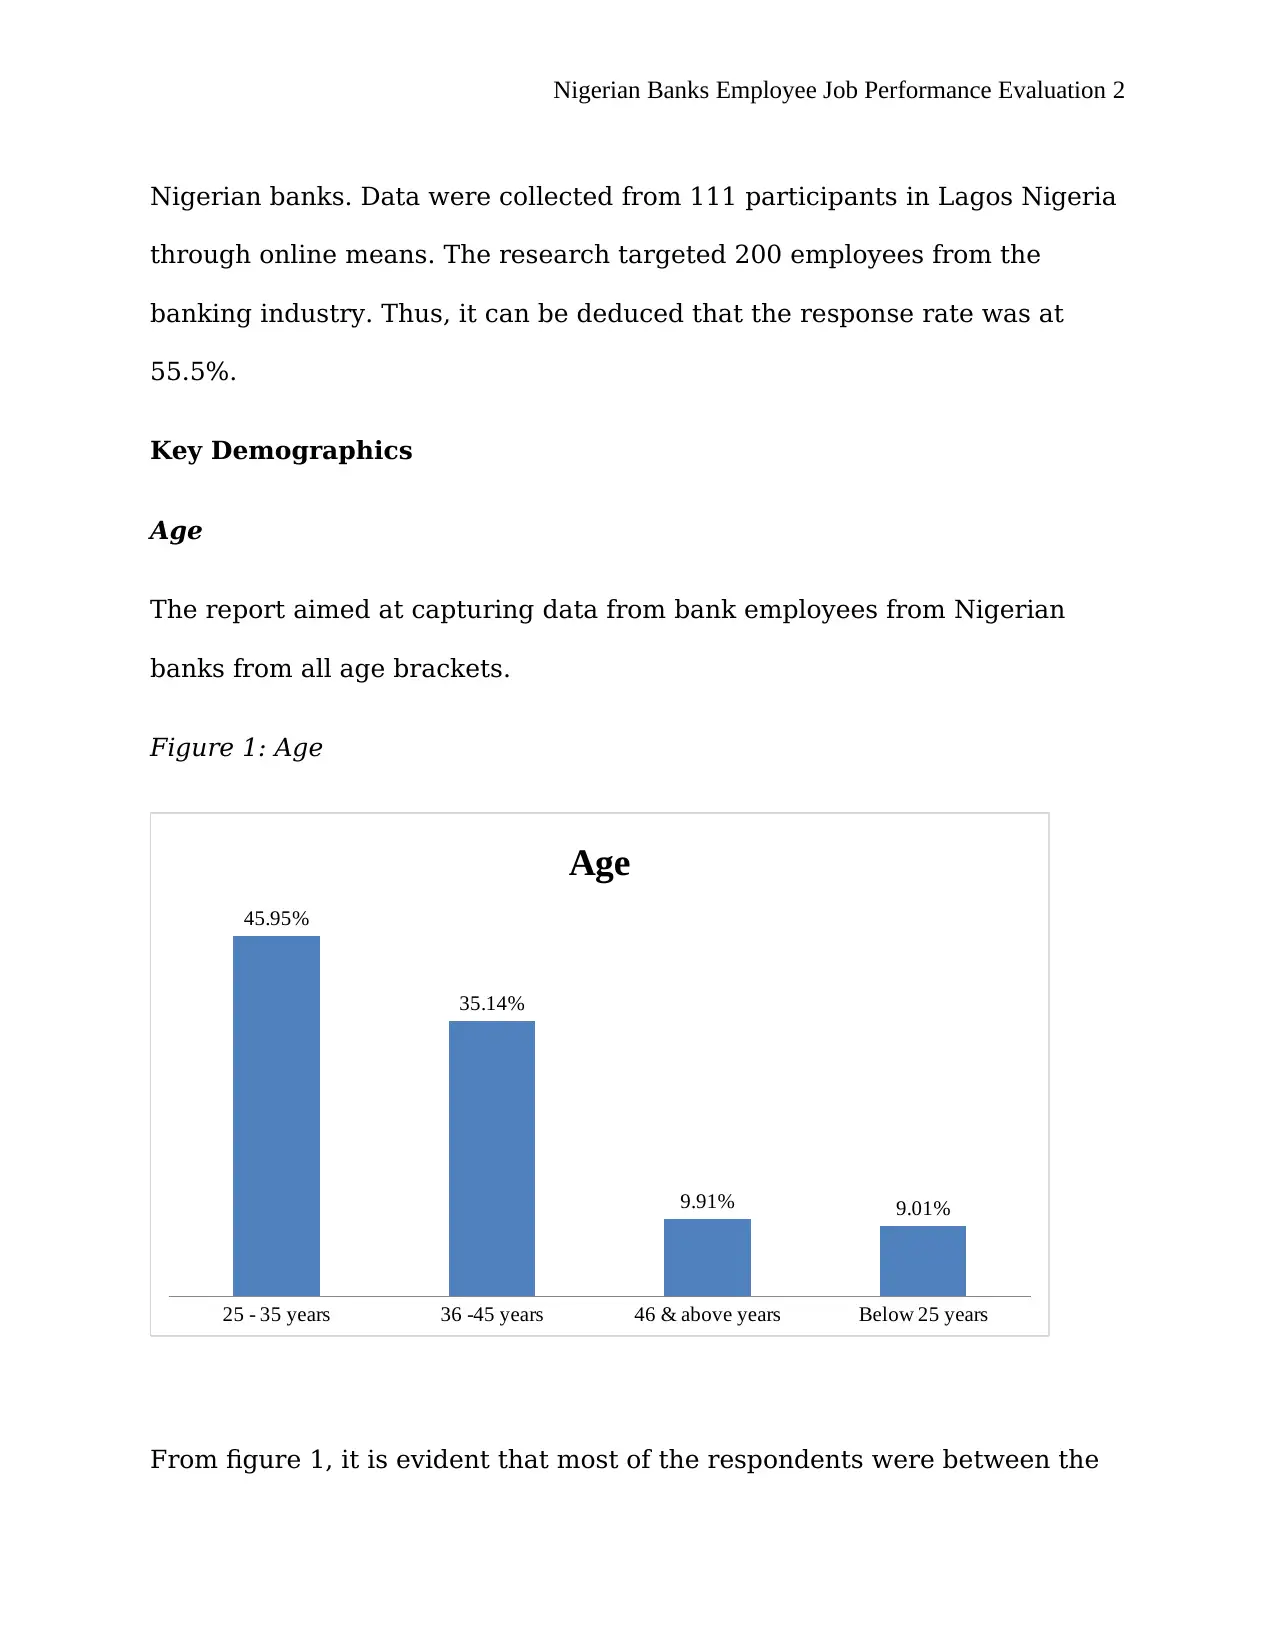
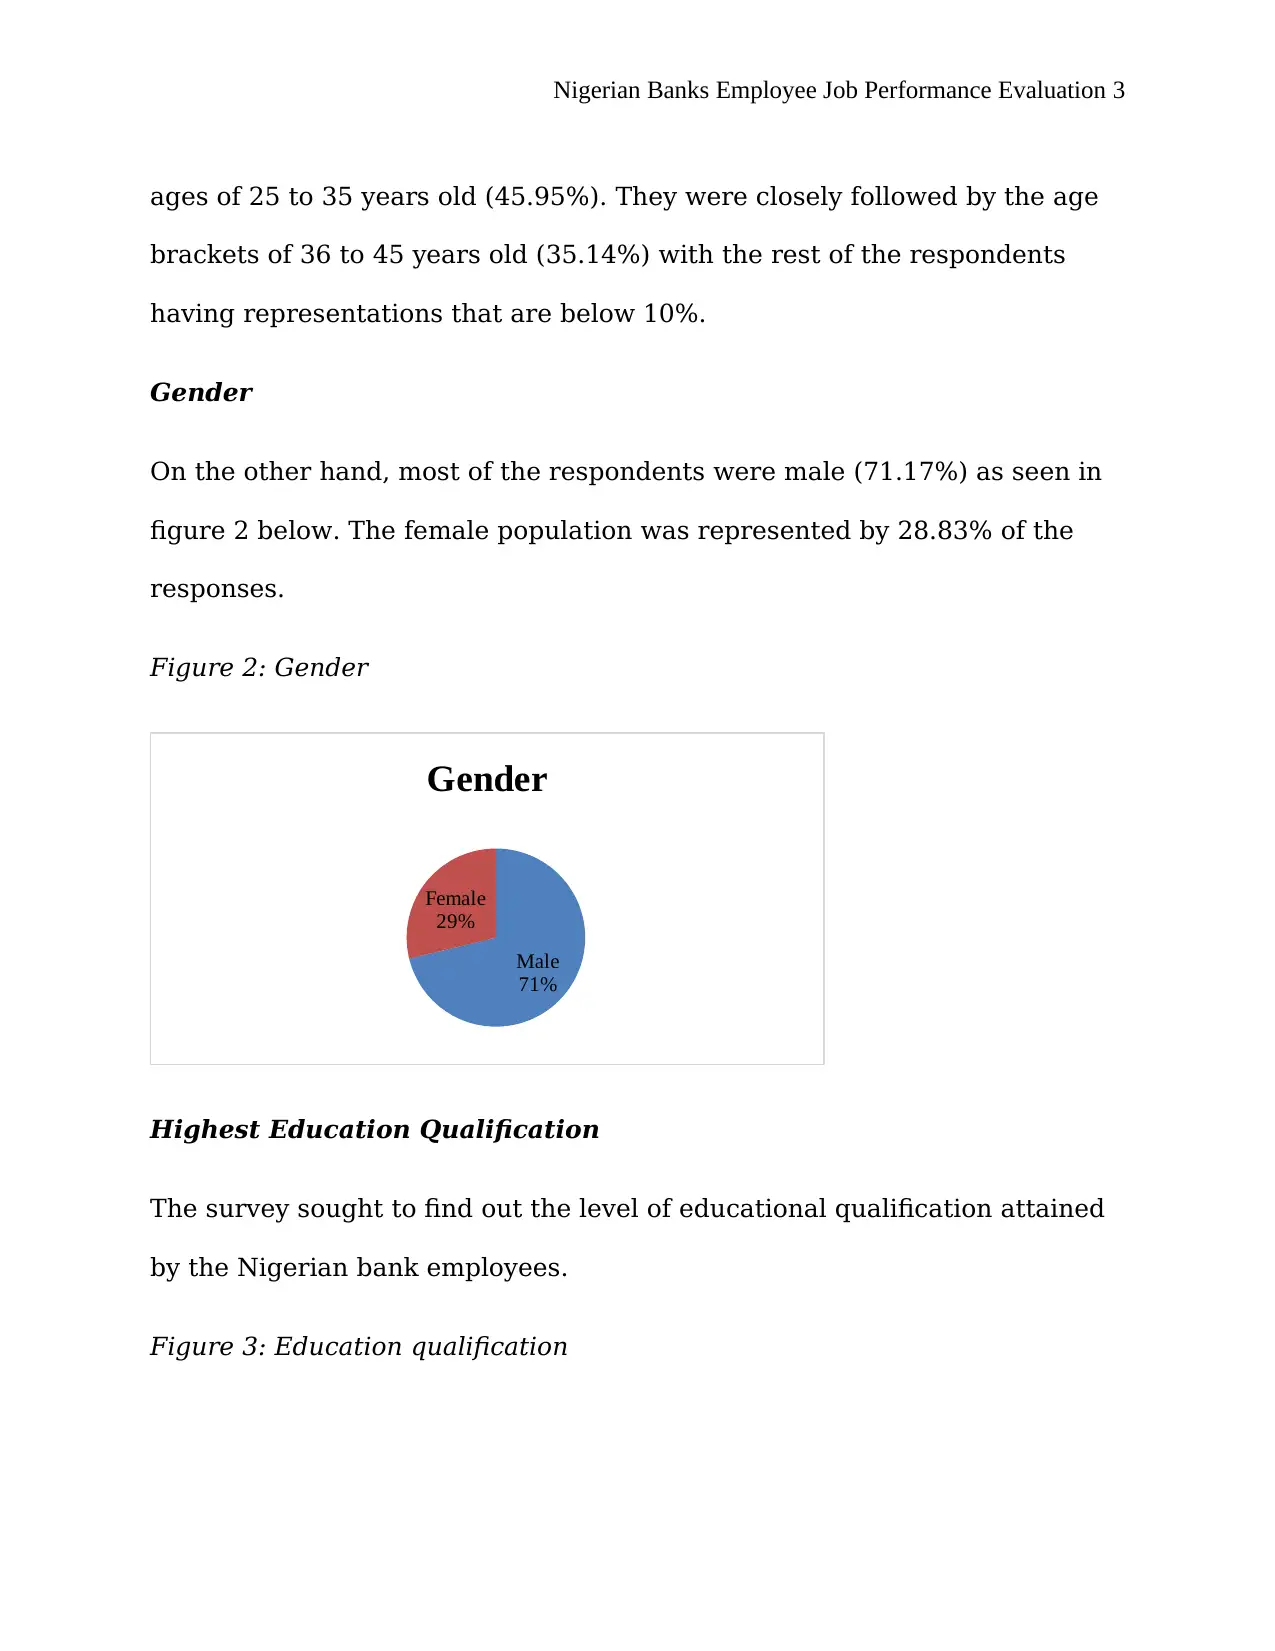
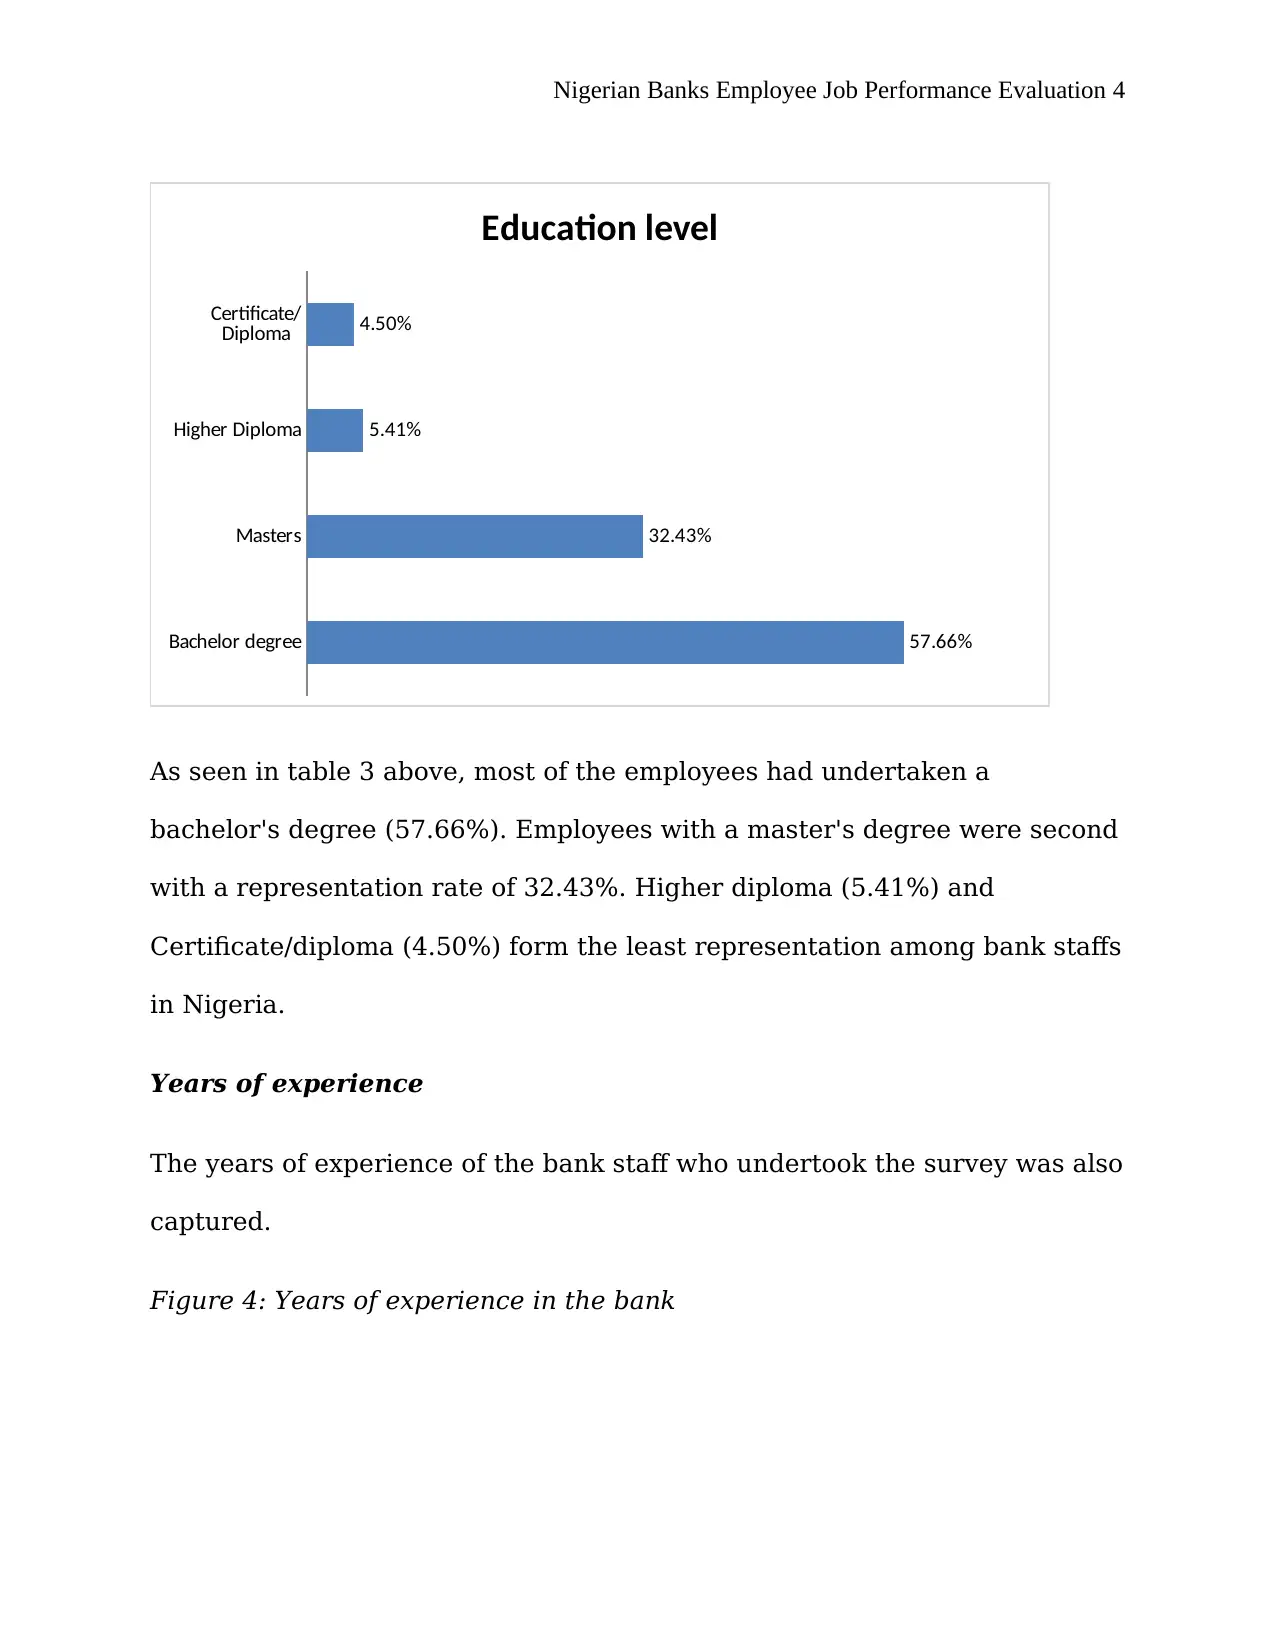
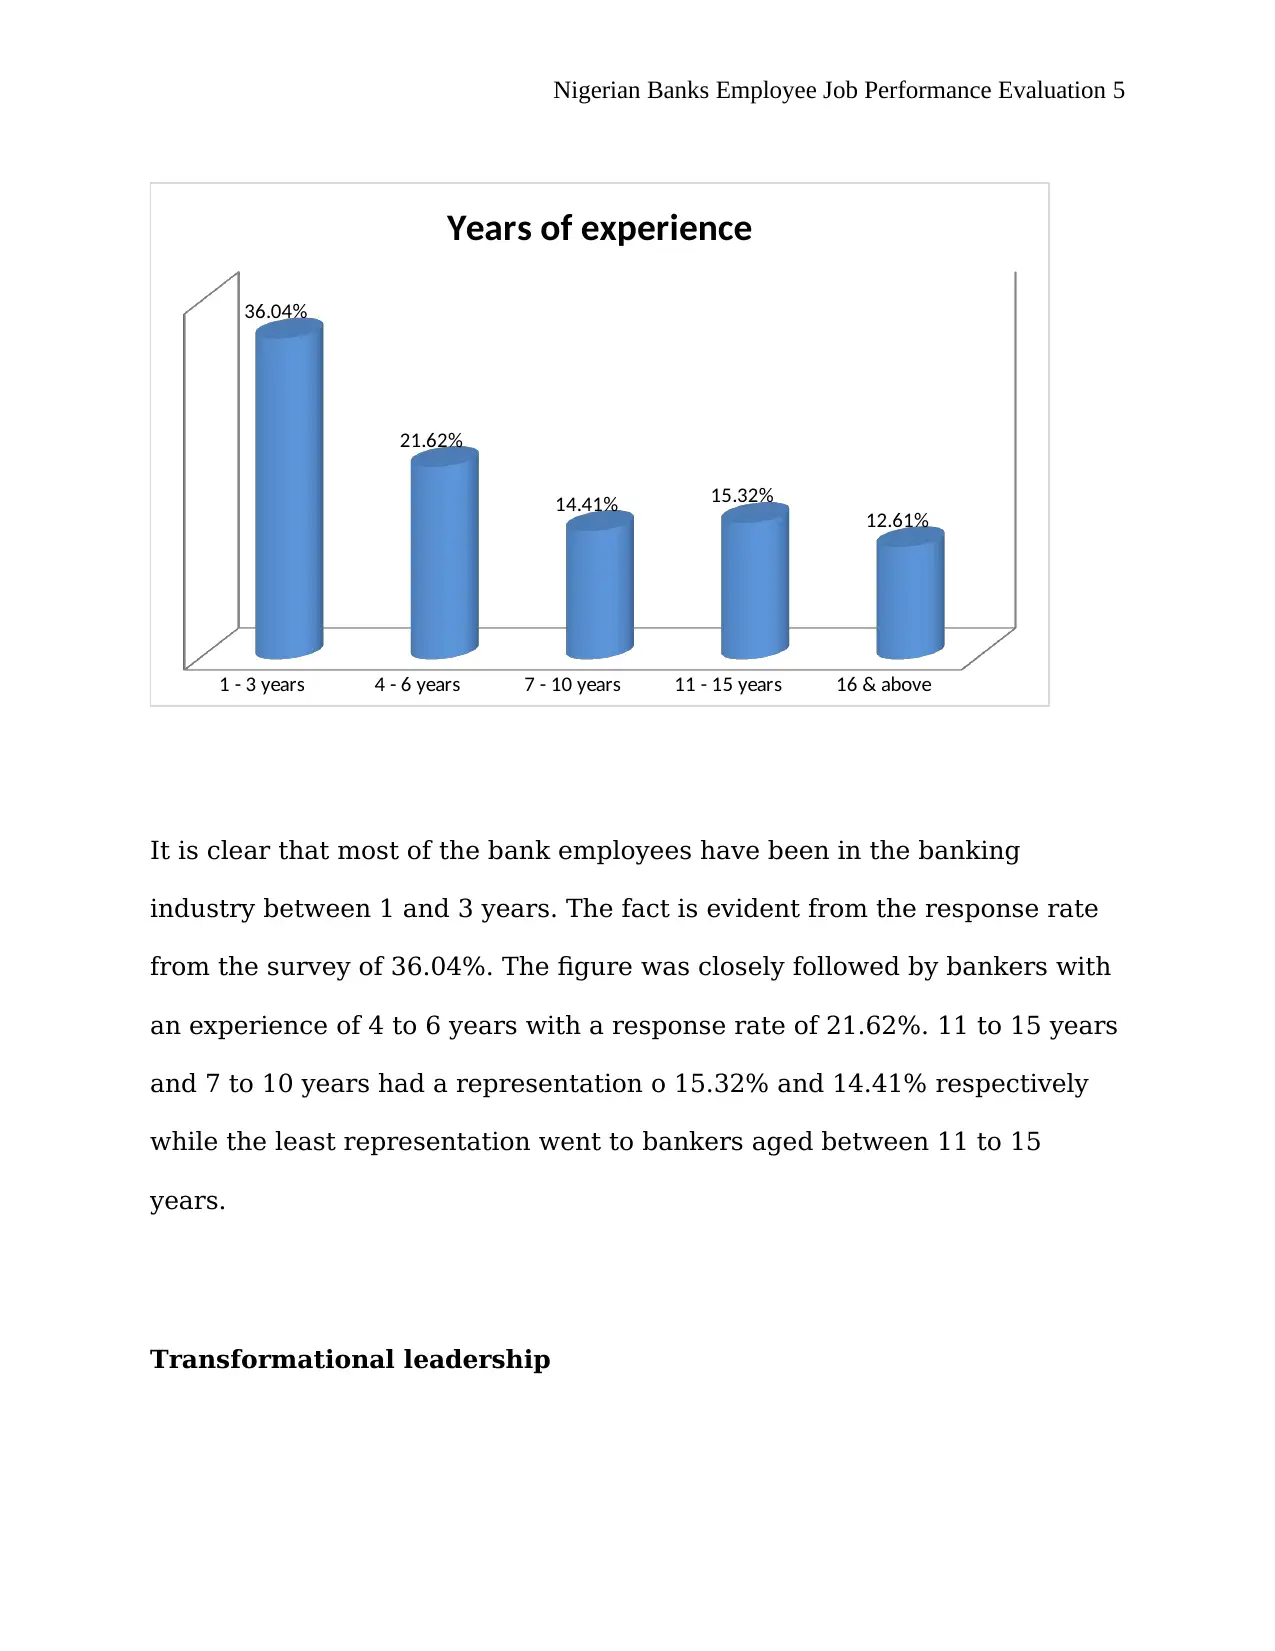
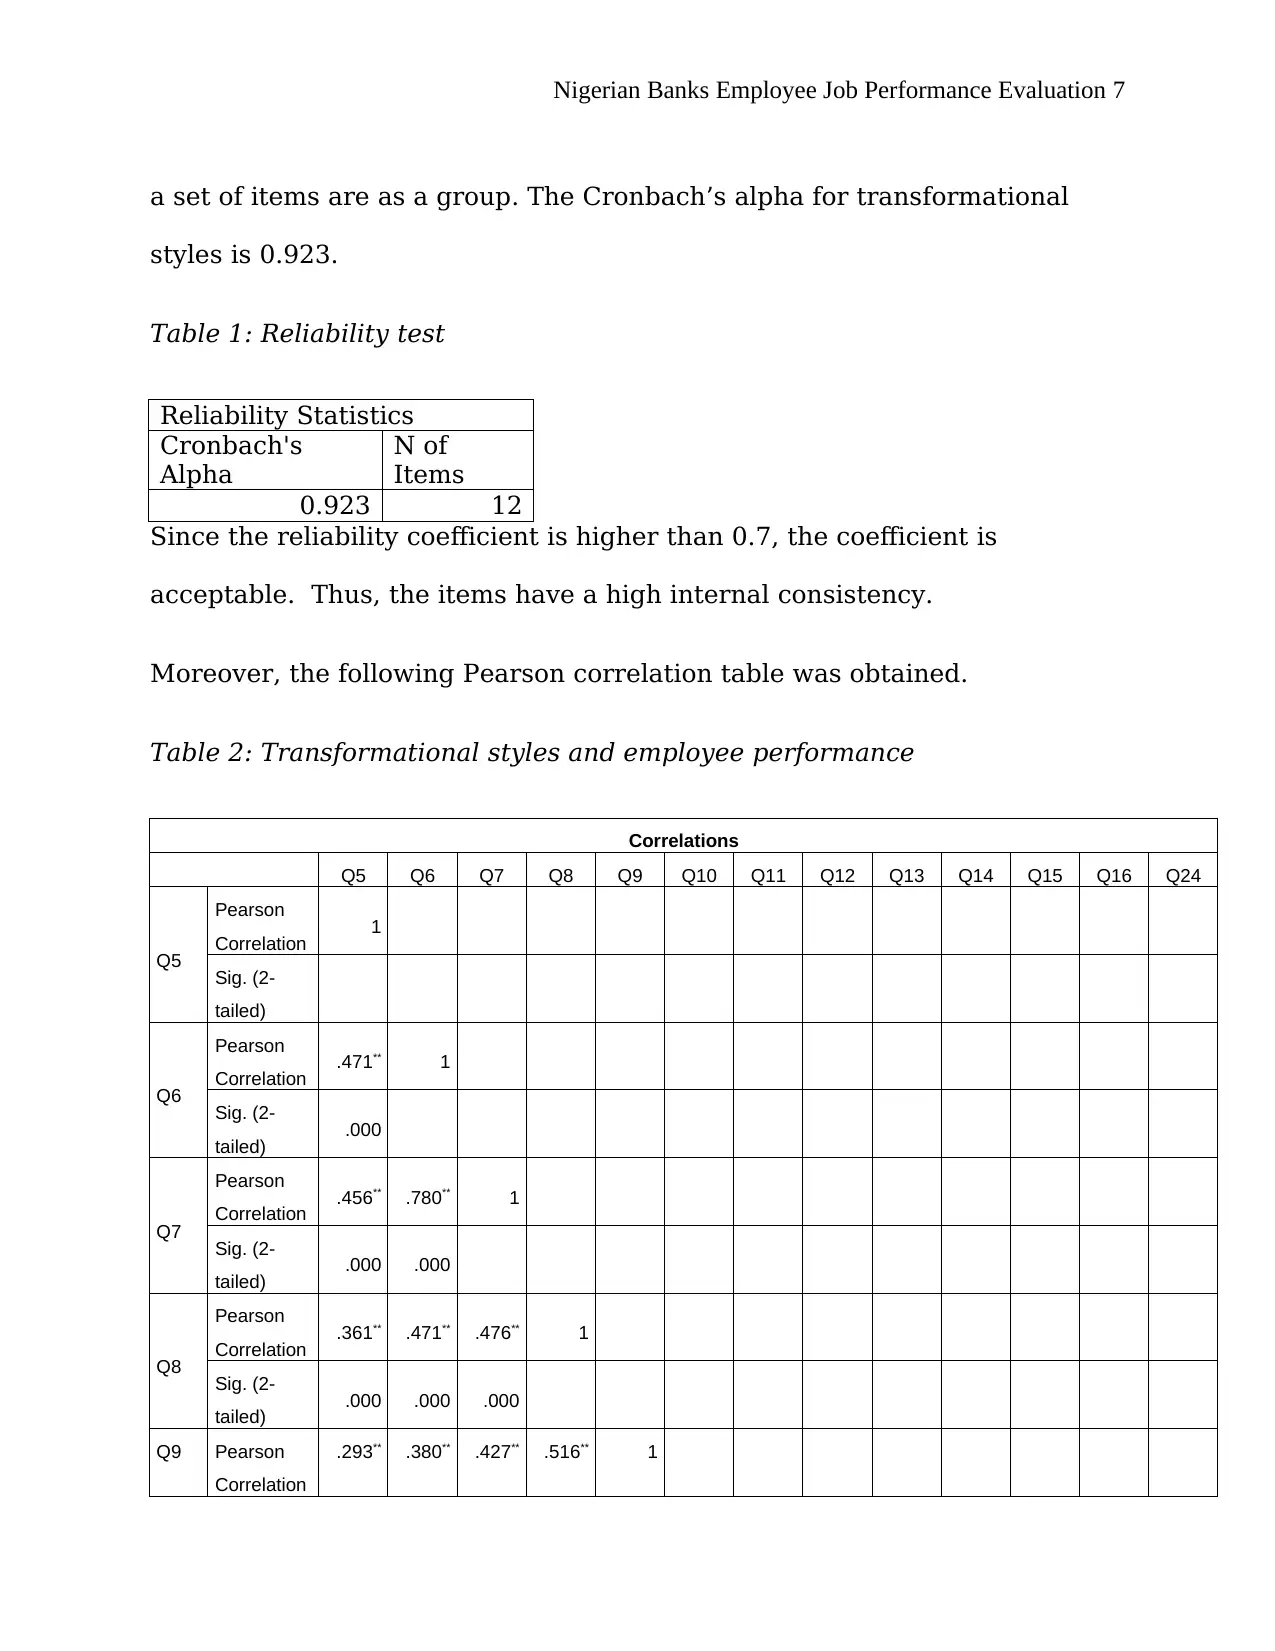
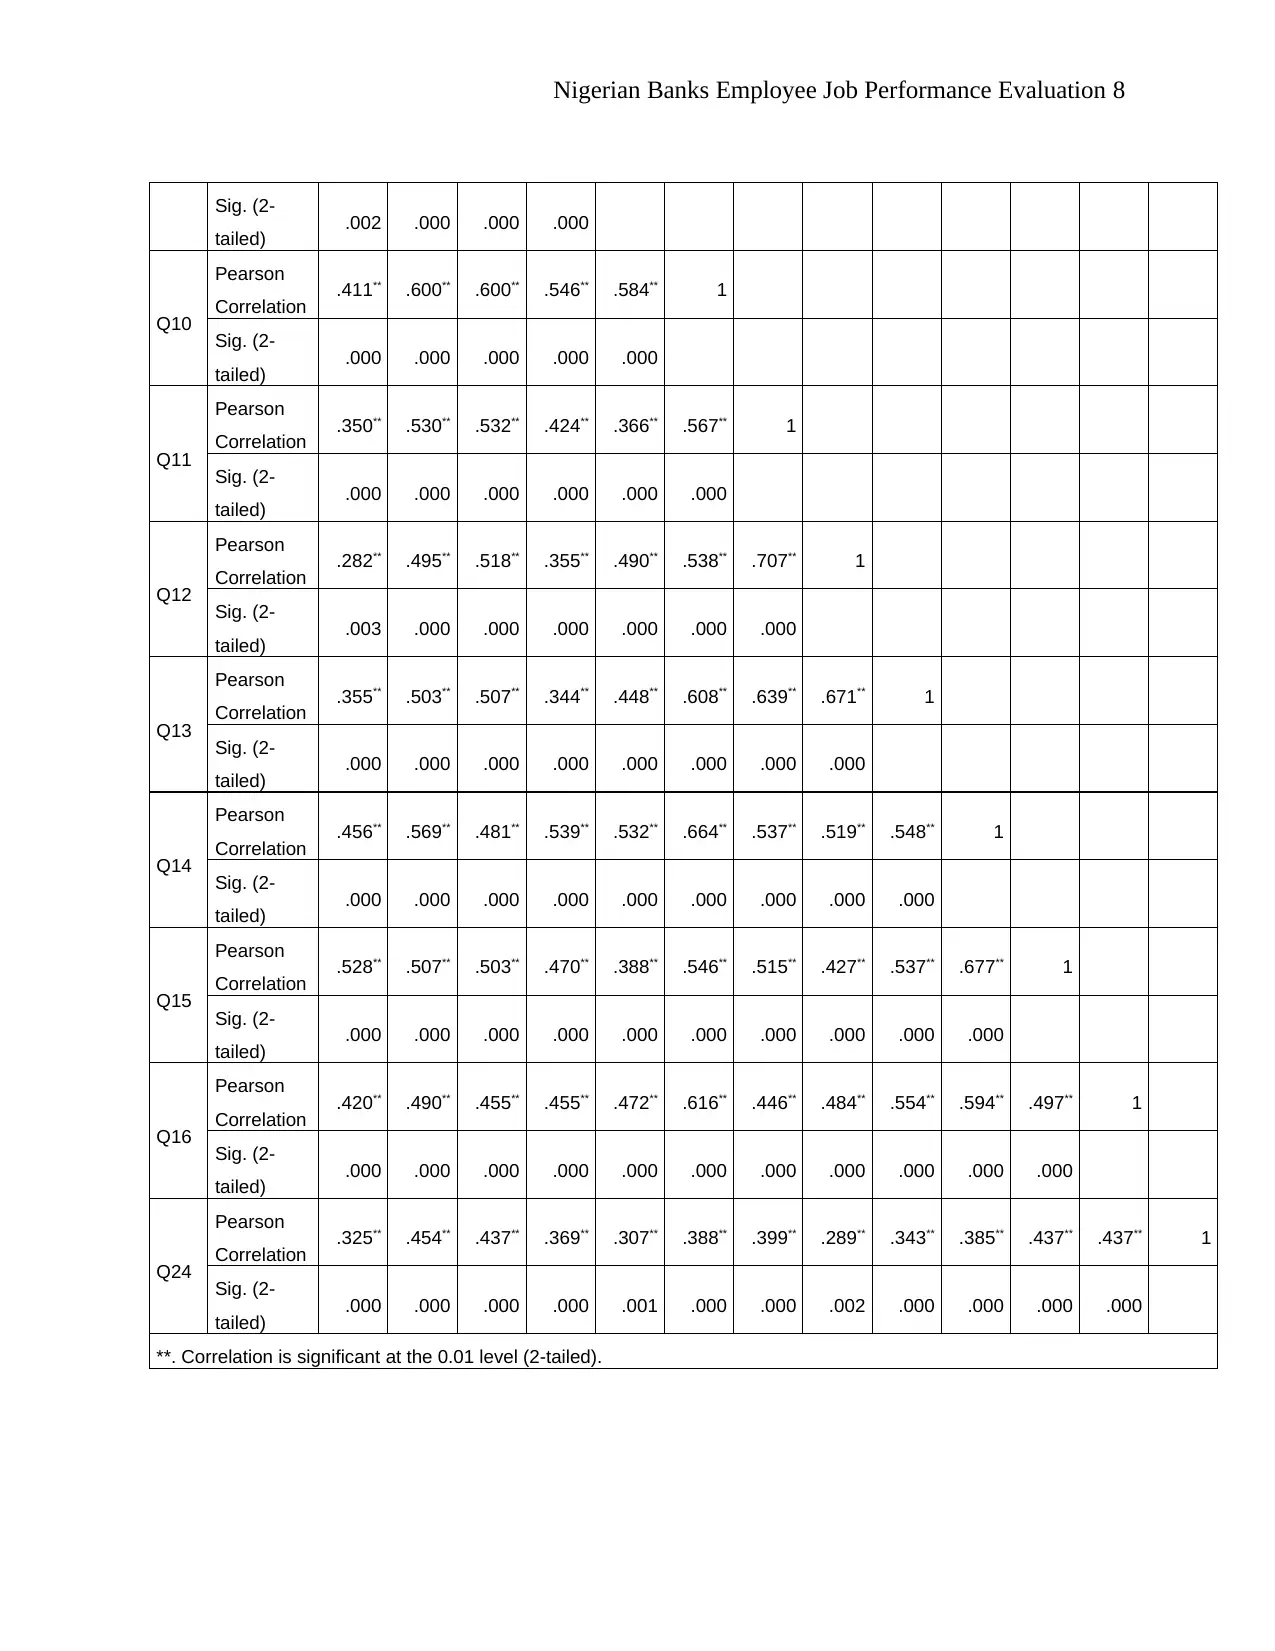
This report analyzes the impact of transactional and transformational leadership styles on employee performance in Nigerian banks. Data were collected from 111 participants in Lagos, Nigeria, through online surveys. The study examined demographics such as age, gender, education, and years of experience. The research investigated the effects of transformational leadership, which was found to significantly and positively affect employee performance, as evidenced by a Cronbach’s alpha of 0.923 and Pearson correlation analysis. Similarly, transactional leadership styles were also shown to significantly and positively impact employee performance. Furthermore, the report explored the relationship between leadership styles and job satisfaction, revealing that transformational leadership styles are more significant in promoting job satisfaction among employees in the Nigerian banking industry. A t-test confirmed a significant difference between the means of transactional and transformational styles concerning job satisfaction. The findings highlight the importance of leadership styles in influencing employee performance and job satisfaction within the Nigerian banking sector.

Running Header: Nigerian Banks Employee Job Performance Evaluation 1
Nigerian Banks Employee Job Performance Evaluation
Students Name:
Students ID:
Date:
The following report aims at analyzing the online data collected through the
Survey Monkey site. The report aims at determining the effect of
transactional and transformational leadership styles on staff performance in
Paraphrase This Document
Need a fresh take? Get an instant paraphrase of this document with our AI Paraphraser

Nigerian Banks Employee Job Performance Evaluation 2
Nigerian banks. Data were collected from 111 participants in Lagos Nigeria
through online means. The research targeted 200 employees from the
banking industry. Thus, it can be deduced that the response rate was at
55.5%.
Key Demographics
Age
The report aimed at capturing data from bank employees from Nigerian
banks from all age brackets.
Figure 1: Age
25 - 35 years 36 -45 years 46 & above years Below 25 years
45.95%
35.14%
9.91% 9.01%
Age
From figure 1, it is evident that most of the respondents were between the

Nigerian Banks Employee Job Performance Evaluation 3
ages of 25 to 35 years old (45.95%). They were closely followed by the age
brackets of 36 to 45 years old (35.14%) with the rest of the respondents
having representations that are below 10%.
Gender
On the other hand, most of the respondents were male (71.17%) as seen in
figure 2 below. The female population was represented by 28.83% of the
responses.
Figure 2: Gender
Male
71%
Female
29%
Gender
Highest Education Qualification
The survey sought to find out the level of educational qualification attained
by the Nigerian bank employees.
Figure 3: Education qualification
⊘ This is a preview!⊘
Do you want full access?
Subscribe today to unlock all pages.

Trusted by 1+ million students worldwide

Nigerian Banks Employee Job Performance Evaluation 4
Bachelor degree
Masters
Higher Diploma
Certificate/
Diploma
57.66%
32.43%
5.41%
4.50%
Education level
As seen in table 3 above, most of the employees had undertaken a
bachelor's degree (57.66%). Employees with a master's degree were second
with a representation rate of 32.43%. Higher diploma (5.41%) and
Certificate/diploma (4.50%) form the least representation among bank staffs
in Nigeria.
Years of experience
The years of experience of the bank staff who undertook the survey was also
captured.
Figure 4: Years of experience in the bank
Paraphrase This Document
Need a fresh take? Get an instant paraphrase of this document with our AI Paraphraser

Nigerian Banks Employee Job Performance Evaluation 5
1 - 3 years 4 - 6 years 7 - 10 years 11 - 15 years 16 & above
36.04%
21.62%
14.41% 15.32%
12.61%
Years of experience
It is clear that most of the bank employees have been in the banking
industry between 1 and 3 years. The fact is evident from the response rate
from the survey of 36.04%. The figure was closely followed by bankers with
an experience of 4 to 6 years with a response rate of 21.62%. 11 to 15 years
and 7 to 10 years had a representation o 15.32% and 14.41% respectively
while the least representation went to bankers aged between 11 to 15
years.
Transformational leadership

Nigerian Banks Employee Job Performance Evaluation 6
Transformational leadership styles are styles employed by leaders who aim
at motivating their teams and organizations to take action and make going
forward (Bass & Riggio, 2006, p.10). The afro-mentioned leadership style is
an approach that aims at changing individuals and the social systems. As a
result, it creates a positive change which is valuable to the followers
thereby leading to achievement of end goals and consequently changes
them into leaders. Transformational leadership is aimed at idealizing
influence, inspiring motivation, stimulating the intellect and individualizing
consideration (Dvir et al., 2002, p. 739).
A hypothesis was developed aimed at finding whether transformational
leadership styles significantly and positively affect employee performance in
Nigerian banks. Thus;
Ho: The Transformational leadership style does not significantly and
positively affect employee performance in Nigerian Banks.
The transformational styles variables were identified from the data
collected.
Questions 5 to 16 aim to identify the transformational styles which the
employees experience from their employees while job performance was
evaluated using Q24.
A reliability check was also carried out using the Cronbach’s alpha. The
Cronbach’s alpha measures the internal consistency or how closely related
⊘ This is a preview!⊘
Do you want full access?
Subscribe today to unlock all pages.

Trusted by 1+ million students worldwide

Nigerian Banks Employee Job Performance Evaluation 7
a set of items are as a group. The Cronbach’s alpha for transformational
styles is 0.923.
Table 1: Reliability test
Reliability Statistics
Cronbach's
Alpha
N of
Items
0.923 12
Since the reliability coefficient is higher than 0.7, the coefficient is
acceptable. Thus, the items have a high internal consistency.
Moreover, the following Pearson correlation table was obtained.
Table 2: Transformational styles and employee performance
Correlations
Q5 Q6 Q7 Q8 Q9 Q10 Q11 Q12 Q13 Q14 Q15 Q16 Q24
Q5
Pearson
Correlation 1
Sig. (2-
tailed)
Q6
Pearson
Correlation .471** 1
Sig. (2-
tailed) .000
Q7
Pearson
Correlation .456** .780** 1
Sig. (2-
tailed) .000 .000
Q8
Pearson
Correlation .361** .471** .476** 1
Sig. (2-
tailed) .000 .000 .000
Q9 Pearson
Correlation
.293** .380** .427** .516** 1
Paraphrase This Document
Need a fresh take? Get an instant paraphrase of this document with our AI Paraphraser

Nigerian Banks Employee Job Performance Evaluation 8
Sig. (2-
tailed) .002 .000 .000 .000
Q10
Pearson
Correlation .411** .600** .600** .546** .584** 1
Sig. (2-
tailed) .000 .000 .000 .000 .000
Q11
Pearson
Correlation .350** .530** .532** .424** .366** .567** 1
Sig. (2-
tailed) .000 .000 .000 .000 .000 .000
Q12
Pearson
Correlation .282** .495** .518** .355** .490** .538** .707** 1
Sig. (2-
tailed) .003 .000 .000 .000 .000 .000 .000
Q13
Pearson
Correlation .355** .503** .507** .344** .448** .608** .639** .671** 1
Sig. (2-
tailed) .000 .000 .000 .000 .000 .000 .000 .000
Q14
Pearson
Correlation .456** .569** .481** .539** .532** .664** .537** .519** .548** 1
Sig. (2-
tailed) .000 .000 .000 .000 .000 .000 .000 .000 .000
Q15
Pearson
Correlation .528** .507** .503** .470** .388** .546** .515** .427** .537** .677** 1
Sig. (2-
tailed) .000 .000 .000 .000 .000 .000 .000 .000 .000 .000
Q16
Pearson
Correlation .420** .490** .455** .455** .472** .616** .446** .484** .554** .594** .497** 1
Sig. (2-
tailed) .000 .000 .000 .000 .000 .000 .000 .000 .000 .000 .000
Q24
Pearson
Correlation .325** .454** .437** .369** .307** .388** .399** .289** .343** .385** .437** .437** 1
Sig. (2-
tailed) .000 .000 .000 .000 .001 .000 .000 .002 .000 .000 .000 .000
**. Correlation is significant at the 0.01 level (2-tailed).
Sig. (2-
tailed) .002 .000 .000 .000
Q10
Pearson
Correlation .411** .600** .600** .546** .584** 1
Sig. (2-
tailed) .000 .000 .000 .000 .000
Q11
Pearson
Correlation .350** .530** .532** .424** .366** .567** 1
Sig. (2-
tailed) .000 .000 .000 .000 .000 .000
Q12
Pearson
Correlation .282** .495** .518** .355** .490** .538** .707** 1
Sig. (2-
tailed) .003 .000 .000 .000 .000 .000 .000
Q13
Pearson
Correlation .355** .503** .507** .344** .448** .608** .639** .671** 1
Sig. (2-
tailed) .000 .000 .000 .000 .000 .000 .000 .000
Q14
Pearson
Correlation .456** .569** .481** .539** .532** .664** .537** .519** .548** 1
Sig. (2-
tailed) .000 .000 .000 .000 .000 .000 .000 .000 .000
Q15
Pearson
Correlation .528** .507** .503** .470** .388** .546** .515** .427** .537** .677** 1
Sig. (2-
tailed) .000 .000 .000 .000 .000 .000 .000 .000 .000 .000
Q16
Pearson
Correlation .420** .490** .455** .455** .472** .616** .446** .484** .554** .594** .497** 1
Sig. (2-
tailed) .000 .000 .000 .000 .000 .000 .000 .000 .000 .000 .000
Q24
Pearson
Correlation .325** .454** .437** .369** .307** .388** .399** .289** .343** .385** .437** .437** 1
Sig. (2-
tailed) .000 .000 .000 .000 .001 .000 .000 .002 .000 .000 .000 .000
**. Correlation is significant at the 0.01 level (2-tailed).

Nigerian Banks Employee Job Performance Evaluation 9
From the Pearson correlation analysis, it was found out that the correlation
is significant at the 0.01 level (2-tailed). Thus, we reject the null hypothesis
and conclude that transformational leadership style significantly and
positively affect employee performance in Nigerian Banks.
Transactional leadership
Unlike transformational leadership, transactional leadership focuses on
results, conformity existing structures within the organization and
measuring the success structure in accordance with the system of the
organization's rewards and penalties (Judge & iccolo, 2004, p.755).
Transactional leader value the order and structure of an organization (Bono
& Judge, 2004, p.901). To test the hypothesis II, the transactional variables
were identified. They were from question 17 to question 23.
The hypothesis aims at finding if there is any relationship between the
transactional leadership and employee performance in Nigerian Banks.
Thus;
Ho: The Transactional leadership style does not significantly and positively
affect employee performance in Nigerian Banks.
A reliability check was also carried out using the cronbach’s alpha. The
cronbach’s alpha for transactional styles is 0.73.
Table 3: Reliability test
⊘ This is a preview!⊘
Do you want full access?
Subscribe today to unlock all pages.

Trusted by 1+ million students worldwide

Nigerian Banks Employee Job Performance Evaluation 10
Reliability Statistics
Cronbach's
Alpha
N of
Items
0.73 7
Since the reliability coefficient is higher than 0.7, the coefficient is
acceptable. Thus, the items have a relatively high internal consistency.
The following Pearson correlation was then obtained.
Table 4: Transactional leadership style and employee performance
Correlations
Q17 Q18 Q19 Q20 Q21 Q22 Q23 Q24
Q17 Pearson Correlation 1
Sig. (2-tailed)
Q18 Pearson Correlation .672** 1
Sig. (2-tailed) .000
Q19 Pearson Correlation .476** .668** 1
Sig. (2-tailed) .000 .000
Q20 Pearson Correlation -.062 .165 .234* 1
Sig. (2-tailed) .518 .083 .013
Q21 Pearson Correlation .299** .360** .405** .027 1
Sig. (2-tailed) .001 .000 .000 .777
Q22 Pearson Correlation .040 .216* .219* .170 .175 1
Sig. (2-tailed) .676 .023 .021 .075 .066
Q23 Pearson Correlation .622** .464** .390** -.011 .442** .207* 1
Sig. (2-tailed) .000 .000 .000 .910 .000 .029
Q24 Pearson Correlation .420** .394** .308** .066 .280** .203* .528** 1
Sig. (2-tailed) .000 .000 .001 .493 .003 .032 .000
**. Correlation is significant at the 0.01 level (2-tailed).
*. Correlation is significant at the 0.05 level (2-tailed).
From the Pearson correlation analysis in table 2, it was found out that the
correlations are significant at the 0.05 level (2-tailed) with exemption of
Paraphrase This Document
Need a fresh take? Get an instant paraphrase of this document with our AI Paraphraser

Nigerian Banks Employee Job Performance Evaluation 11
Q20. Thus, we reject the null hypothesis and conclude that transactional
leadership styles significantly and positively affect employee performance in
Nigerian Banks.
Transactional leadership and transformational leadership
A third hypothesis was also developed to determine the significance of the
relationship between transactional, transformational leadership styles and
the employee's job satisfaction. Thus;
Ho: There is no significant relationship between transactional,
transformational leadership styles and employee’s job satisfaction.
H1: There is a significant relationship between transactional,
transformational leadership styles and employee’s job satisfaction.
The following Pearson correlations were derived:
Table 5: Correlation between transformational leadership styles and job
satisfaction mediated between transformational leadership and employee
performance
Correlations
Q5 Q6 Q7 Q8 Q9 Q10 Q11 Q12 Q13 Q14 Q15 Q16 Q29
Q5
Pearson
Correlation 1
Sig. (2-
tailed)
Q6 Pearson
Correlation
.471** 1

Nigerian Banks Employee Job Performance Evaluation 12
Sig. (2-
tailed) .000
Q7
Pearson
Correlation .456** .780** 1
Sig. (2-
tailed) .000 .000
Q8
Pearson
Correlation .361** .471** .476** 1
Sig. (2-
tailed) .000 .000 .000
Q9
Pearson
Correlation .293** .380** .427** .516** 1
Sig. (2-
tailed) .002 .000 .000 .000
Q10
Pearson
Correlation .411** .600** .600** .546** .584** 1
Sig. (2-
tailed) .000 .000 .000 .000 .000
Q11
Pearson
Correlation .350** .530** .532** .424** .366** .567** 1
Sig. (2-
tailed) .000 .000 .000 .000 .000 .000
Q12
Pearson
Correlation .282** .495** .518** .355** .490** .538** .707** 1
Sig. (2-
tailed) .003 .000 .000 .000 .000 .000 .000
Q13
Pearson
Correlation .355** .503** .507** .344** .448** .608** .639** .671** 1
Sig. (2-
tailed) .000 .000 .000 .000 .000 .000 .000 .000
Q14
Pearson
Correlation .456** .569** .481** .539** .532** .664** .537** .519** .548** 1
Sig. (2-
tailed) .000 .000 .000 .000 .000 .000 .000 .000 .000
Q15
Pearson
Correlation .528** .507** .503** .470** .388** .546** .515** .427** .537** .677** 1
Sig. (2-
tailed) .000 .000 .000 .000 .000 .000 .000 .000 .000 .000
Sig. (2-
tailed) .000
Q7
Pearson
Correlation .456** .780** 1
Sig. (2-
tailed) .000 .000
Q8
Pearson
Correlation .361** .471** .476** 1
Sig. (2-
tailed) .000 .000 .000
Q9
Pearson
Correlation .293** .380** .427** .516** 1
Sig. (2-
tailed) .002 .000 .000 .000
Q10
Pearson
Correlation .411** .600** .600** .546** .584** 1
Sig. (2-
tailed) .000 .000 .000 .000 .000
Q11
Pearson
Correlation .350** .530** .532** .424** .366** .567** 1
Sig. (2-
tailed) .000 .000 .000 .000 .000 .000
Q12
Pearson
Correlation .282** .495** .518** .355** .490** .538** .707** 1
Sig. (2-
tailed) .003 .000 .000 .000 .000 .000 .000
Q13
Pearson
Correlation .355** .503** .507** .344** .448** .608** .639** .671** 1
Sig. (2-
tailed) .000 .000 .000 .000 .000 .000 .000 .000
Q14
Pearson
Correlation .456** .569** .481** .539** .532** .664** .537** .519** .548** 1
Sig. (2-
tailed) .000 .000 .000 .000 .000 .000 .000 .000 .000
Q15
Pearson
Correlation .528** .507** .503** .470** .388** .546** .515** .427** .537** .677** 1
Sig. (2-
tailed) .000 .000 .000 .000 .000 .000 .000 .000 .000 .000
⊘ This is a preview!⊘
Do you want full access?
Subscribe today to unlock all pages.

Trusted by 1+ million students worldwide
1 out of 24
Related Documents

Your All-in-One AI-Powered Toolkit for Academic Success.
 +13062052269
info@desklib.com
Available 24*7 on WhatsApp / Email
Unlock your academic potential
Copyright © 2020–2025 A2Z Services. All Rights Reserved. Developed and managed by ZUCOL.