Analyzing Leadership Styles & Student Performance at MGI Schools
VerifiedAdded on 2023/04/21
|55
|7560
|463
Report
AI Summary
This report analyzes data collected from educators in six schools within the Mahatma Gandhi Institute (MGI) network to explore the leadership styles of rectors and their impact on teaching, learning, and student academic performance. The study examines educators' perceptions of leadership styles, finding that a majority believe their rectors employ a democratic style. The report further investigates the factors influencing rector's leadership styles, such as professional ethics, school culture, and employee diversity. All educators surveyed agreed that leadership style affects the teaching and learning process. The report also delves into student academic performance trends over the past five years and explores the perceived dependence of student success on the rector's leadership approach. Desklib provides access to similar solved assignments and resources for students.
Table of Contents
CHAPTER FOUR................................................................................................................................2
DATA PRESENTATION, ANALYSIS AND DISCUSSION............................................................2
4.1 INTRODUCTION......................................................................................................................2
4.2 RESPONSE RATE.....................................................................................................................2
4.3 BACKGROUND INFORMATION...........................................................................................3
4.3.1 Gender..................................................................................................................................3
4.3.2 Age.......................................................................................................................................4
4.3.3 Academic qualifications.......................................................................................................5
4.3.4 Teaching experience............................................................................................................6
4.4 CONTEXTUAL DESCRIPTIONS OF RESEARCH FINDINGS.......................................7
4.4.1 Research Question 1: What are the leadership styles commonly practiced by the rectors? 7
4.4.1.1 The commonly used leadership style by rectors in the secondary schools...................7
4.4.1.2 Does the leadership style applied by the rector affect the teaching and learning
process in your school?.............................................................................................................8
4.4.1.3 Factors influencing the leadership style of the rector..............................................9
4.4.1.4 Student’s academic performance trends for Cambridge SC and HSC examinations for
the past five years....................................................................................................................10
4.4.1.5 Student’s academic performance at Cambridge SC and HSC examinations is
dependent on the leadership style used by the school rector...................................................12
1
Paraphrase This Document
Need a fresh take? Get an instant paraphrase of this document with our AI Paraphraser
CHAPTER FOUR
DATA PRESENTATION, ANALYSIS AND DISCUSSION
4.1 INTRODUCTION
This chapter presents analyses and discusses the data collected from the empirical study from a
sample of educators from the six schools under the Mahatma Gandhi Institute network. The
findings were analysed, processed and discussed as per the objective of the research questions for
the study. Analysis was made easier by use of Statistical Package for Social Sciences (SPSS). In
addition, the findings were presented systematically in tables and charts in brief, starting with
background information of the respondents as obtained from questionnaires while other important
findings were arranged in accordance with the research questions that focused on the rector’s
2
leadership styles and their effects on teaching and learning process and the students’ academic
performances in the schools under scrutiny. The research findings also focused on leadership style
commonly practised by the heads of schools.
4.2 RESPONSE RATE
A total of 100 questionnaires were distributed to school educators of the Mahatma Gandhi Institute
network, comprising of 6 schools located in various regions of the country. All questionnaires were
duly filled and returned. This represented a 100 percent response rate from educators. This was
made possible because confidentiality was observed and the information gathered was meant for
academic purposes only. This made the respondents give a high response rate which was considered
suitable enough to give a true reflection of the issues under study.
4.3 BACKGROUND INFORMATION
The background information involved the issues such as category of respondents by gender, age
teaching experience, and level of education of educators who participated in answering
questionnaires. The essence of using the background characteristics of the various respondents who
3
⊘ This is a preview!⊘
Do you want full access?
Subscribe today to unlock all pages.
Trusted by 1+ million students worldwide
participated in the survey was to enable researcher to describe the characteristics of the target
population and to gather aspects of the six schools under the MGI network which would be seen as
helpful to elaborate the findings. Their characteristics have a strong bearing on the study’s findings
relating to the hypotheses. Questionnaires among educators were administered because they were
the direct focus of the study and due to their unique role in student’s academic performance. This
helped to grasp essential information on the influence of the leadership styles of rectors on student’s
academic performance. Data gathered were arranged based on the gender, age, teaching experience
and the level of education obtained.
4.3.1 Gender
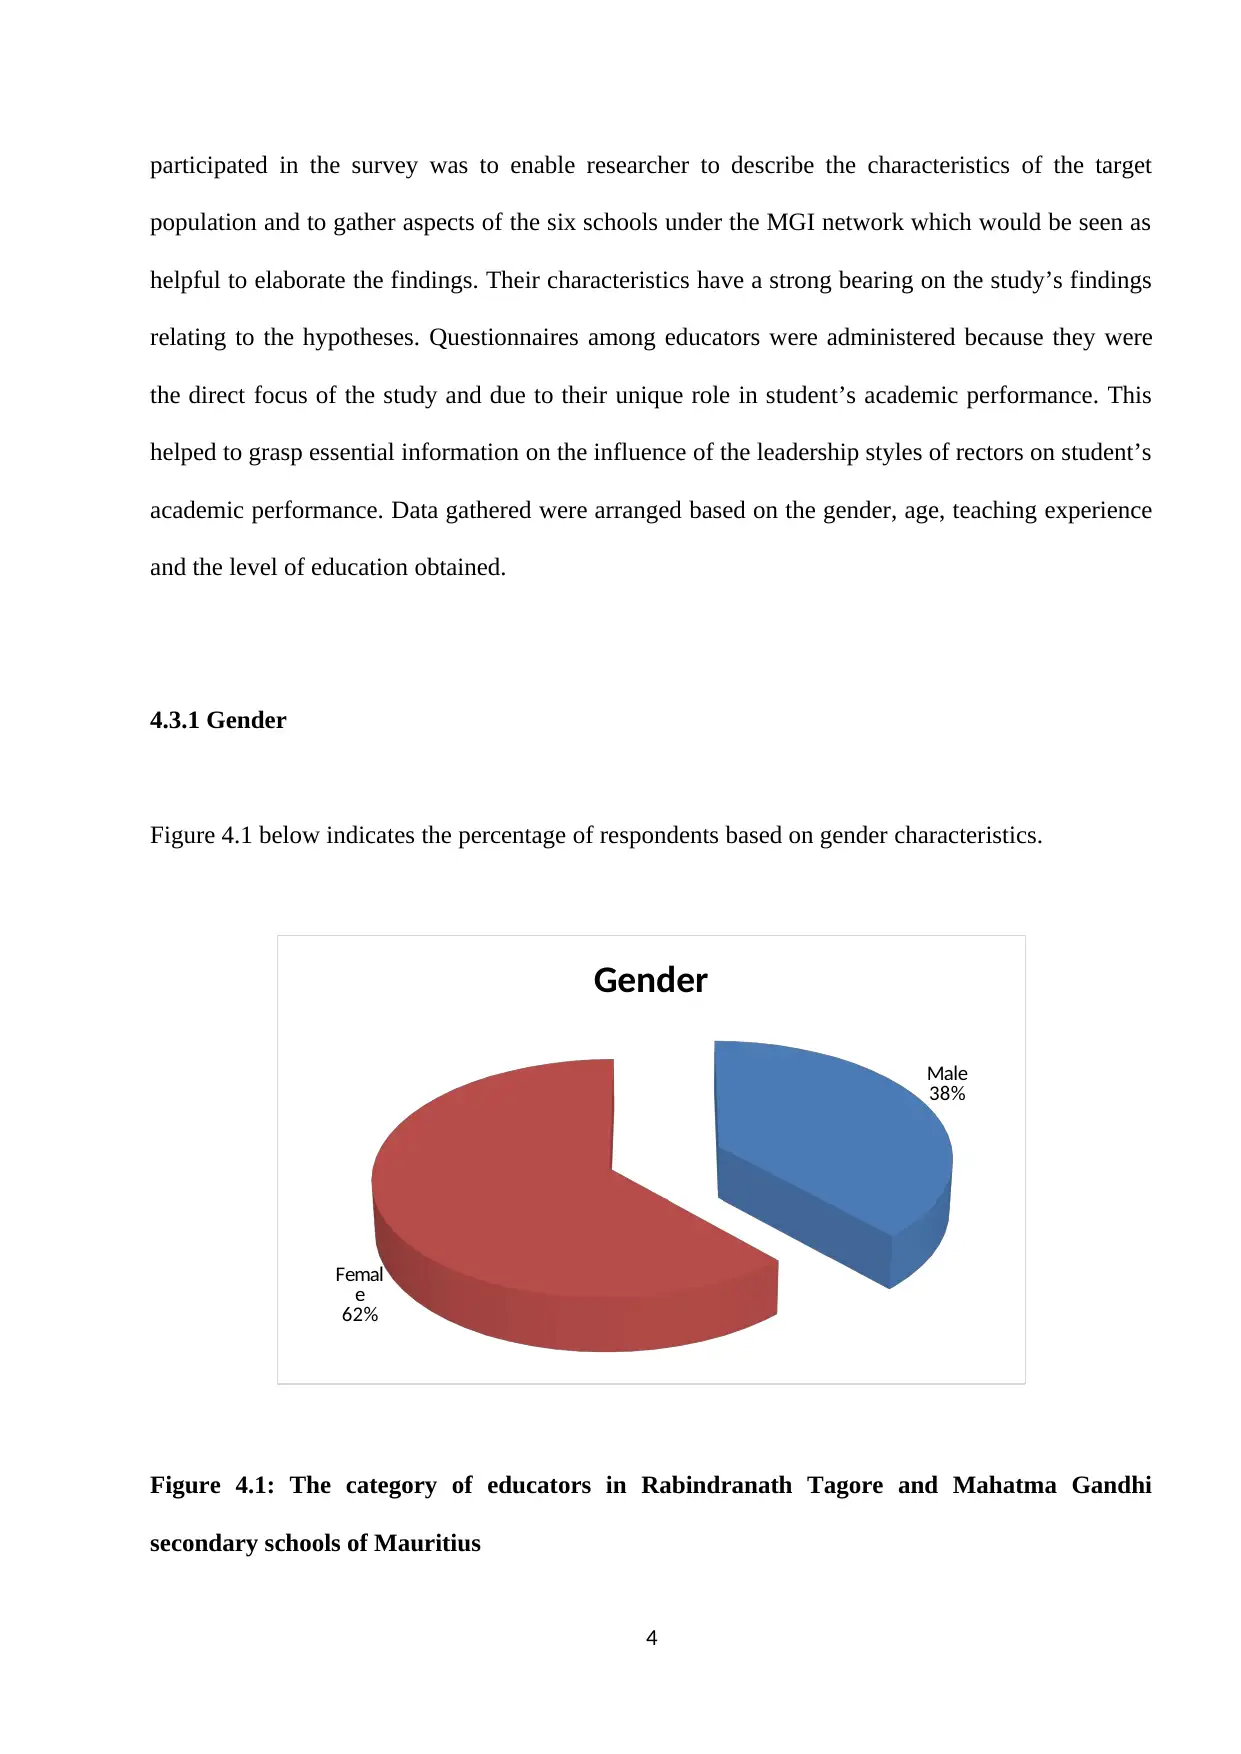
Figure 4.1 below indicates the percentage of respondents based on gender characteristics.
Male
38%
Femal
e
62%
Gender
Figure 4.1: The category of educators in Rabindranath Tagore and Mahatma Gandhi
secondary schools of Mauritius
4
population and to gather aspects of the six schools under the MGI network which would be seen as
helpful to elaborate the findings. Their characteristics have a strong bearing on the study’s findings
relating to the hypotheses. Questionnaires among educators were administered because they were
the direct focus of the study and due to their unique role in student’s academic performance. This
helped to grasp essential information on the influence of the leadership styles of rectors on student’s
academic performance. Data gathered were arranged based on the gender, age, teaching experience
and the level of education obtained.
4.3.1 Gender
Figure 4.1 below indicates the percentage of respondents based on gender characteristics.
Male
38%
Femal
e
62%
Gender
Figure 4.1: The category of educators in Rabindranath Tagore and Mahatma Gandhi
secondary schools of Mauritius
4
Paraphrase This Document
Need a fresh take? Get an instant paraphrase of this document with our AI Paraphraser
The pie chart above shows the percentage of educators based on gender characteristics involved in
responding to the questionnaires. It indicates that most educators in the studied area are female
(62%) than female (38%). This shows that the six schools of the Mahatma Gandhi Institute
including the Rabindranath Tagore secondary school are dominated more by female than male. The
imbalance in gender raises doubt as to whether the leadership styles applied in these secondary
schools is gender sensitive. The nature of leadership imposed by leaders in these schools favours
female more than male and hence giving a different working environment to male educators.
4.3.2 Age
The age of respondents was also analysed and the findings revealed as shown in Table 4.1 below
shows that more than half of the educators (62%) who participated in the study were between the
ages of 31 and 40 years, followed by (26%) between the ages of 20 and 30 and a small percentage
(10%) were between the ages of 41 and 50 years. Most of the opinions of the respondents on the
relationship between leadership styles and their effect on student’s academic performance in the
secondary schools emerged from the age range of 31-40 and few opinions expressed by the other
age groups.
Since the majority of educators in Rabindranath Tagore and Mahatma Gandhi secondary schools of
Mauritius are in their thirties (30s), this explains why the study was dominated by participants from
this age group.
Age of respondents
20 - 30 years 31 - 40 years 41 - 50 years above 51 years
Count Count Count Count
5
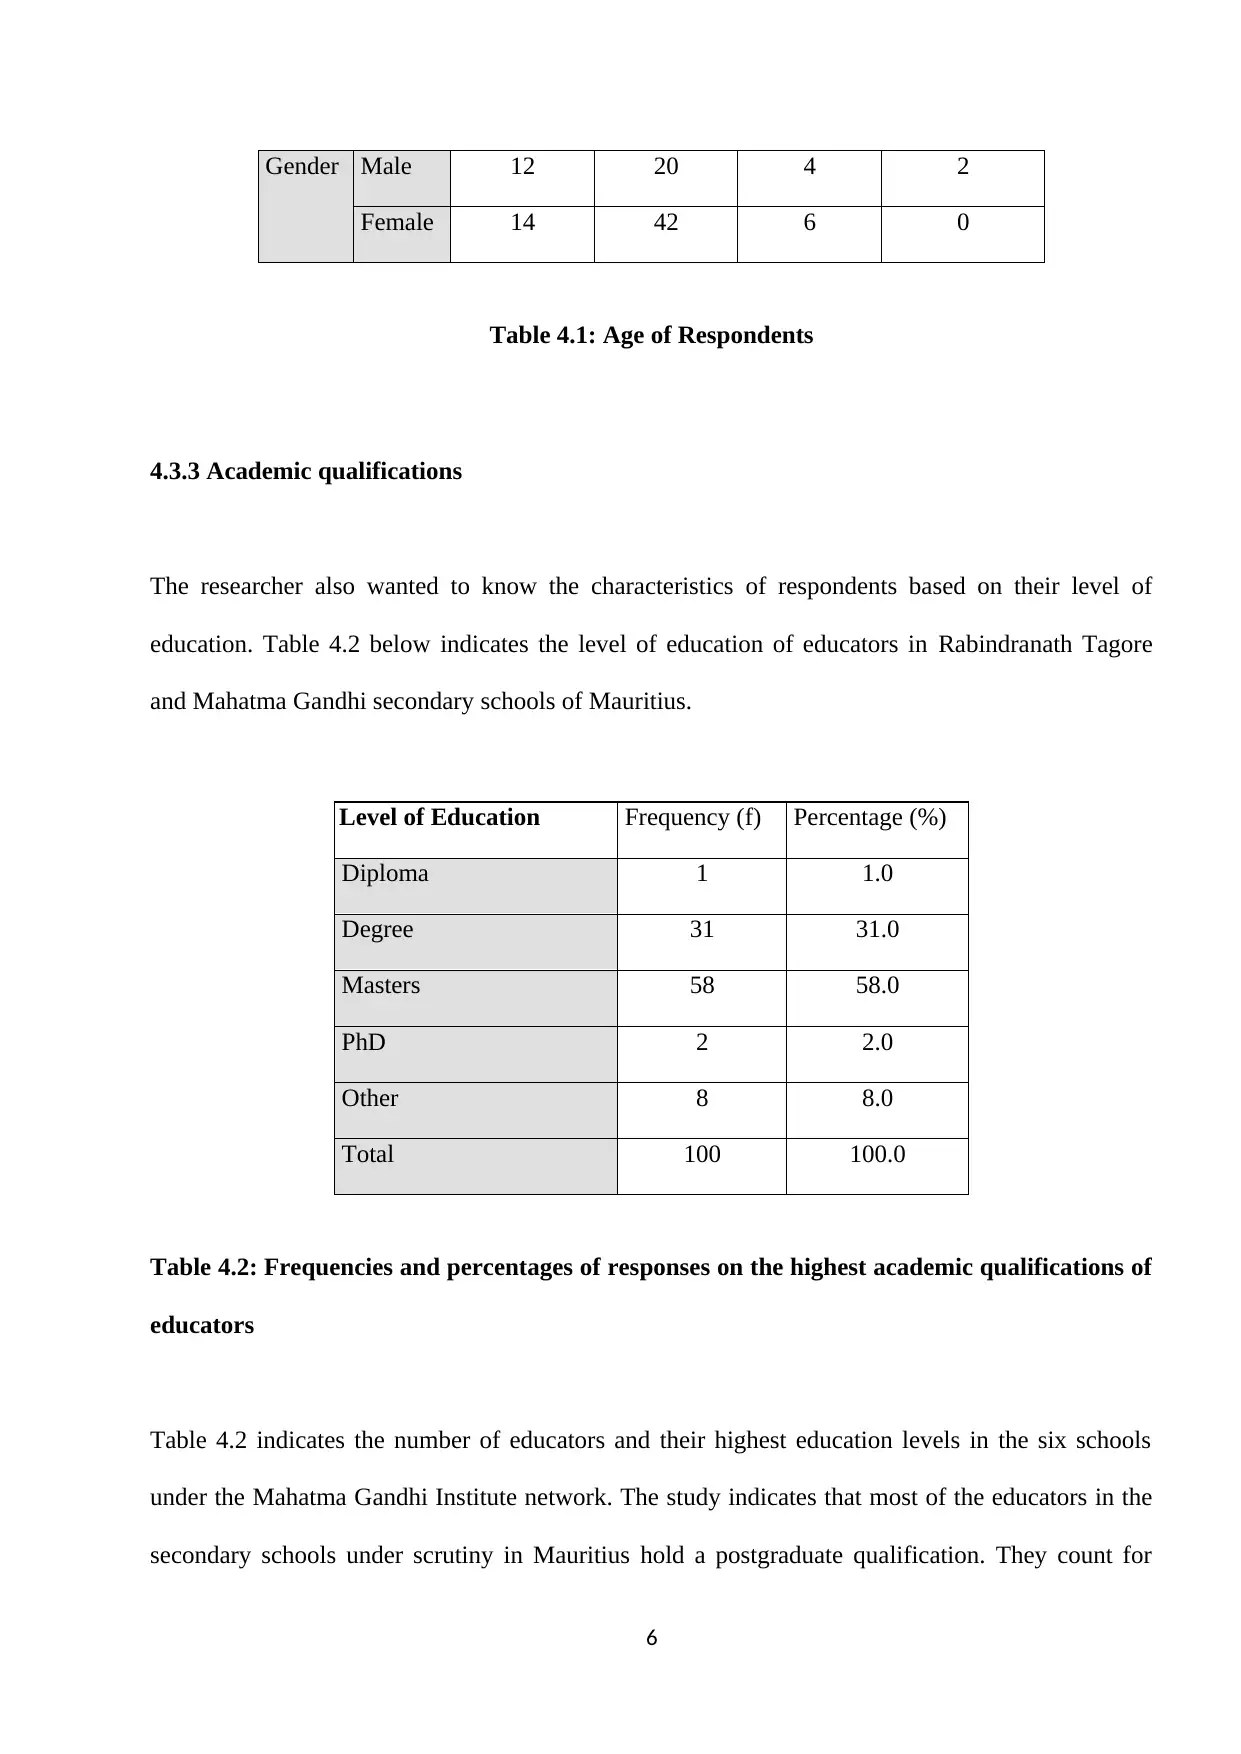
Gender Male 12 20 4 2
Female 14 42 6 0
Table 4.1: Age of Respondents
4.3.3 Academic qualifications
The researcher also wanted to know the characteristics of respondents based on their level of
education. Table 4.2 below indicates the level of education of educators in Rabindranath Tagore
and Mahatma Gandhi secondary schools of Mauritius.
Level of Education Frequency (f) Percentage (%)
Diploma 1 1.0
Degree 31 31.0
Masters 58 58.0
PhD 2 2.0
Other 8 8.0
Total 100 100.0
Table 4.2: Frequencies and percentages of responses on the highest academic qualifications of
educators
Table 4.2 indicates the number of educators and their highest education levels in the six schools
under the Mahatma Gandhi Institute network. The study indicates that most of the educators in the
secondary schools under scrutiny in Mauritius hold a postgraduate qualification. They count for
6
⊘ This is a preview!⊘
Do you want full access?
Subscribe today to unlock all pages.
Trusted by 1+ million students worldwide
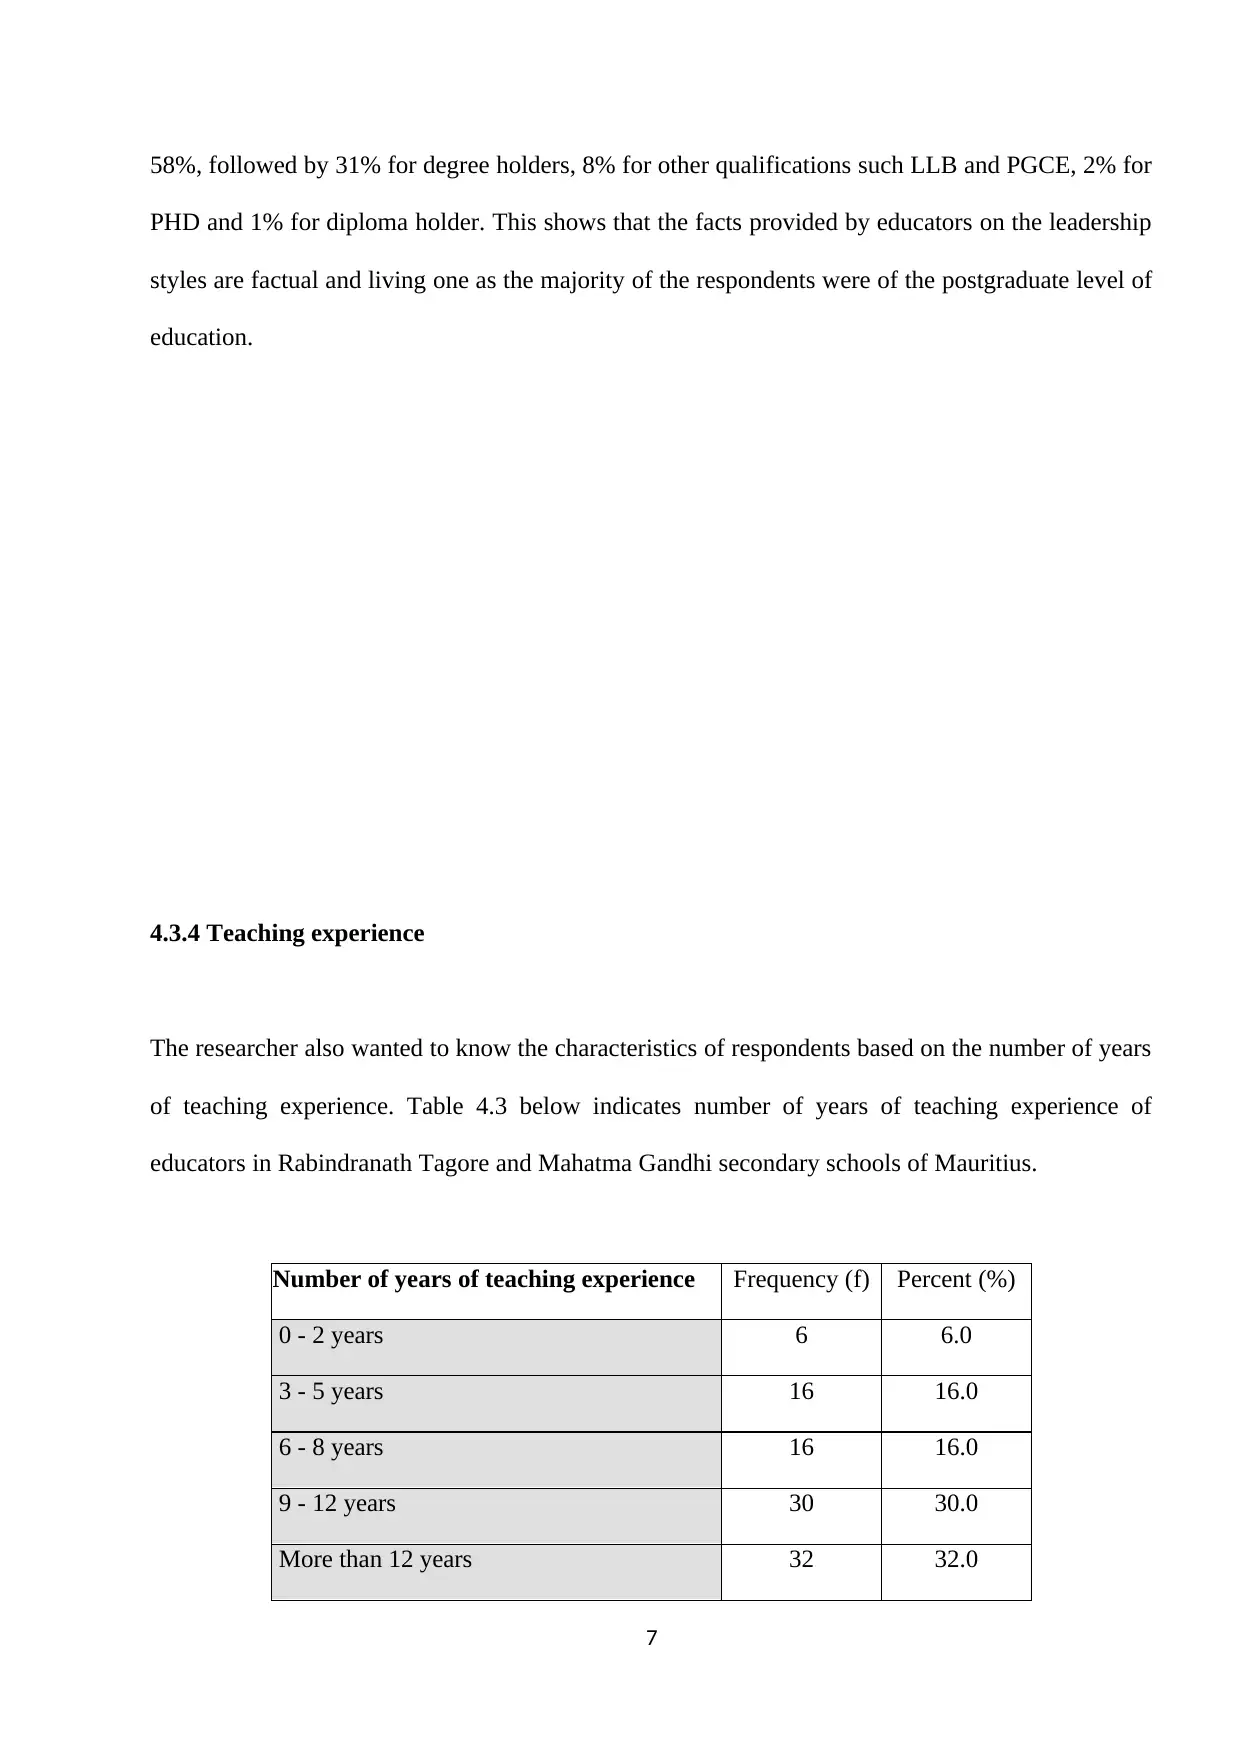
58%, followed by 31% for degree holders, 8% for other qualifications such LLB and PGCE, 2% for
PHD and 1% for diploma holder. This shows that the facts provided by educators on the leadership
styles are factual and living one as the majority of the respondents were of the postgraduate level of
education.
4.3.4 Teaching experience
The researcher also wanted to know the characteristics of respondents based on the number of years
of teaching experience. Table 4.3 below indicates number of years of teaching experience of
educators in Rabindranath Tagore and Mahatma Gandhi secondary schools of Mauritius.
Number of years of teaching experience Frequency (f) Percent (%)
0 - 2 years 6 6.0
3 - 5 years 16 16.0
6 - 8 years 16 16.0
9 - 12 years 30 30.0
More than 12 years 32 32.0
7
Paraphrase This Document
Need a fresh take? Get an instant paraphrase of this document with our AI Paraphraser
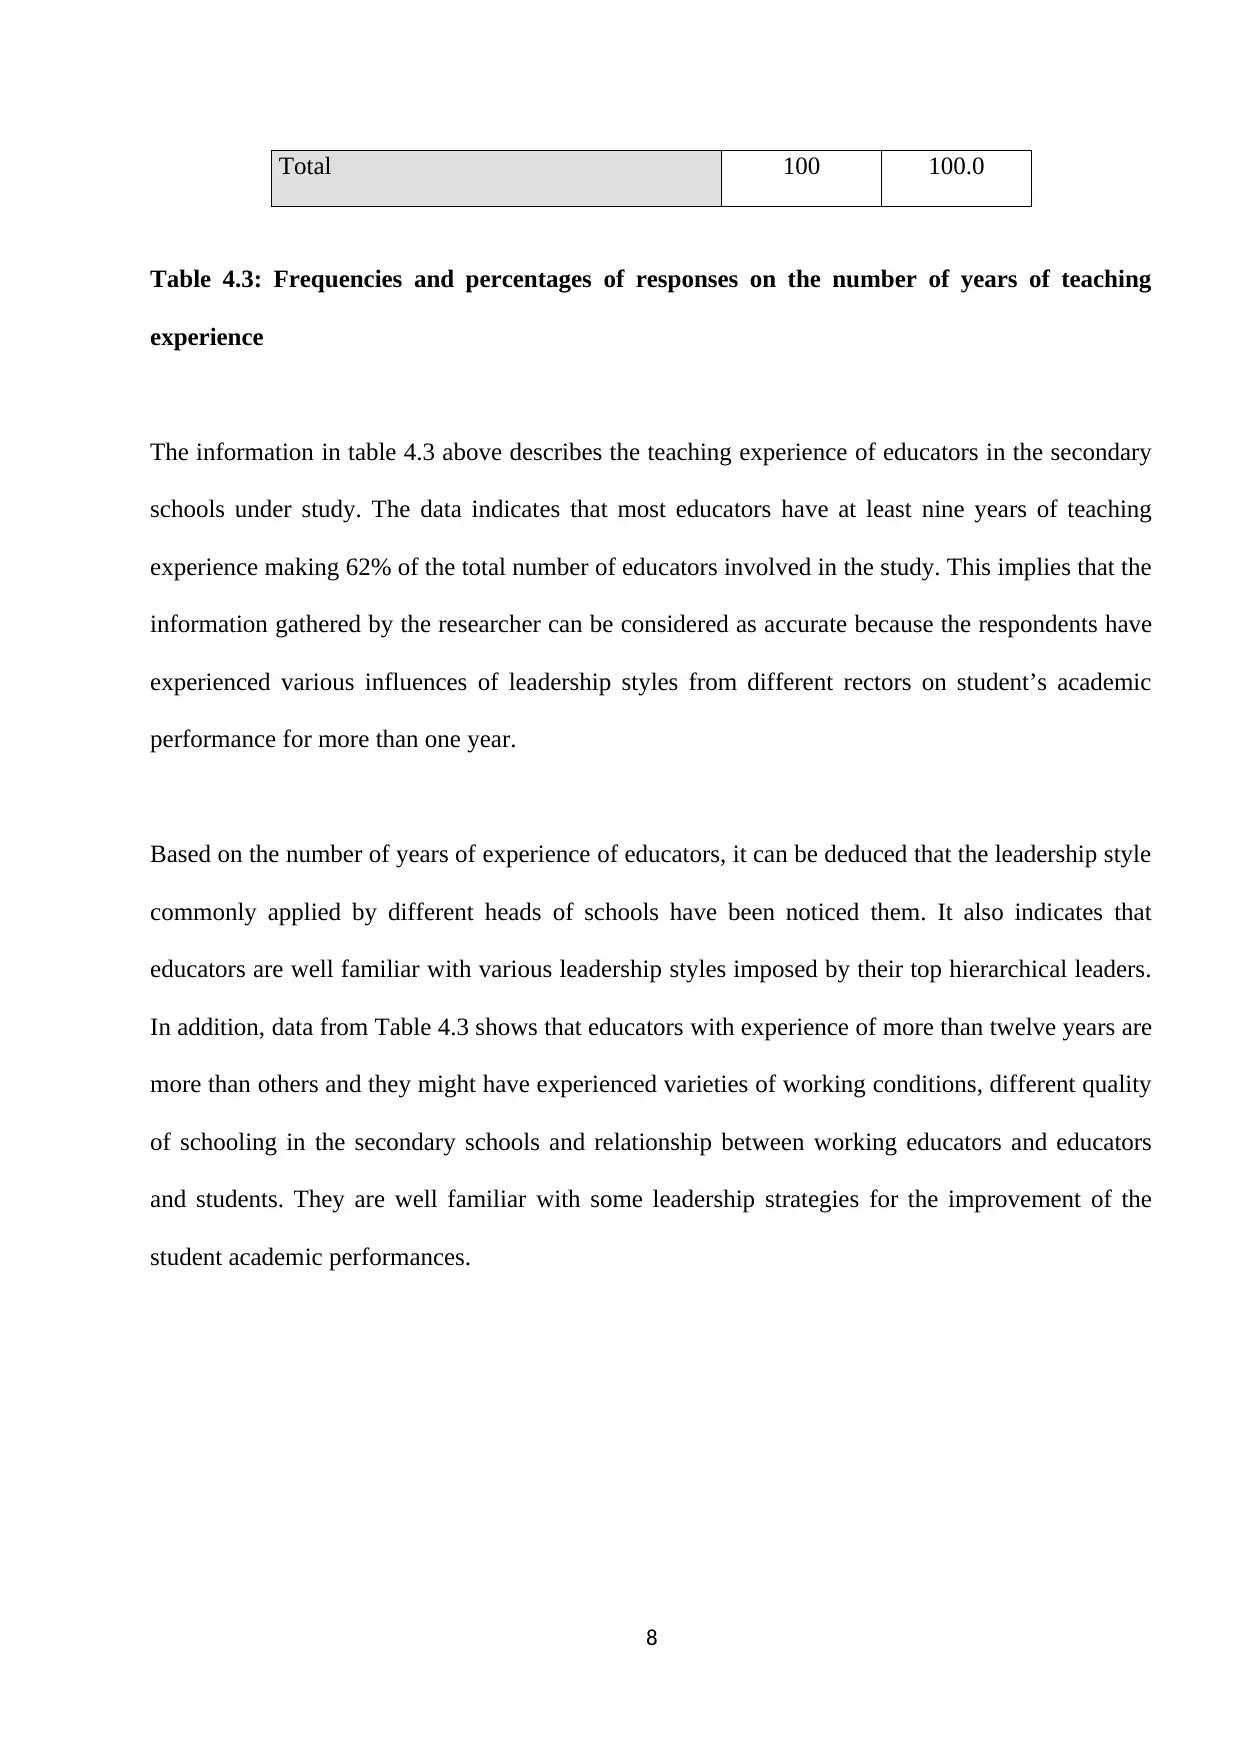
Total 100 100.0
Table 4.3: Frequencies and percentages of responses on the number of years of teaching
experience
The information in table 4.3 above describes the teaching experience of educators in the secondary
schools under study. The data indicates that most educators have at least nine years of teaching
experience making 62% of the total number of educators involved in the study. This implies that the
information gathered by the researcher can be considered as accurate because the respondents have
experienced various influences of leadership styles from different rectors on student’s academic
performance for more than one year.
Based on the number of years of experience of educators, it can be deduced that the leadership style
commonly applied by different heads of schools have been noticed them. It also indicates that
educators are well familiar with various leadership styles imposed by their top hierarchical leaders.
In addition, data from Table 4.3 shows that educators with experience of more than twelve years are
more than others and they might have experienced varieties of working conditions, different quality
of schooling in the secondary schools and relationship between working educators and educators
and students. They are well familiar with some leadership strategies for the improvement of the
student academic performances.
8
4.4 CONTEXTUAL DESCRIPTIONS OF RESEARCH FINDINGS
This part describes the findings and discussions using the questionnaires collected. The respondents
were requested to answer several questions related to four research questions. The participant’s
responses to each research question are presented below.
4.4.1 Research Question 1: What are the leadership styles commonly practiced by the rectors?
This objective was purposely speculated because educational leaders play important role with the
intention to make teaching and learning more effective and to give quality education to students and
thus improving their performance. In this view, it was necessary to explore the extent to which the
rector’s leadership style influence the academic performance of students in the secondary schools of
the Mahatma Gandhi Institute system. The assumption within this objective was that, apart from
other factors influencing student’s performance is the function that can be defined in terms of what
leadership style the school leaders apply.
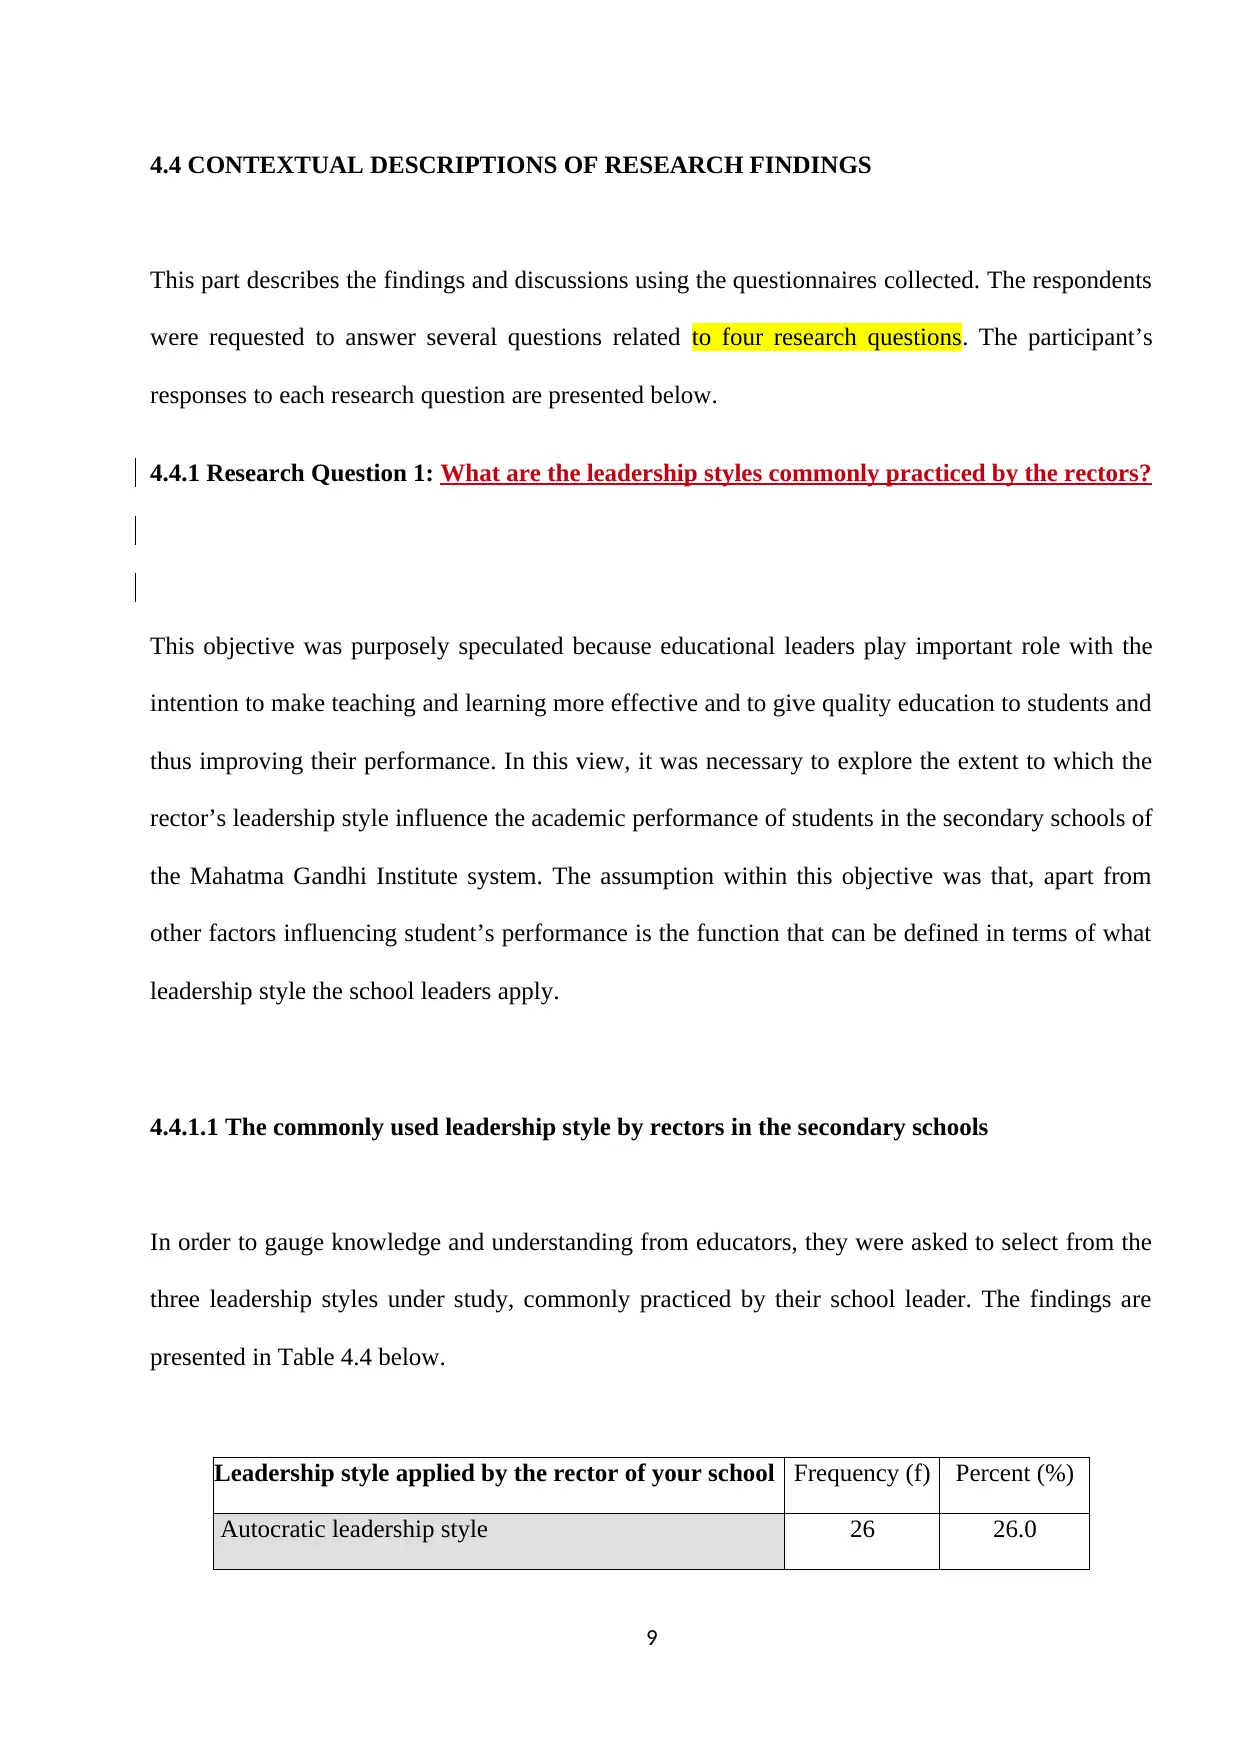
4.4.1.1 The commonly used leadership style by rectors in the secondary schools
In order to gauge knowledge and understanding from educators, they were asked to select from the
three leadership styles under study, commonly practiced by their school leader. The findings are
presented in Table 4.4 below.
Leadership style applied by the rector of your school Frequency (f) Percent (%)
Autocratic leadership style 26 26.0
9
This part describes the findings and discussions using the questionnaires collected. The respondents
were requested to answer several questions related to four research questions. The participant’s
responses to each research question are presented below.
4.4.1 Research Question 1: What are the leadership styles commonly practiced by the rectors?
This objective was purposely speculated because educational leaders play important role with the
intention to make teaching and learning more effective and to give quality education to students and
thus improving their performance. In this view, it was necessary to explore the extent to which the
rector’s leadership style influence the academic performance of students in the secondary schools of
the Mahatma Gandhi Institute system. The assumption within this objective was that, apart from
other factors influencing student’s performance is the function that can be defined in terms of what
leadership style the school leaders apply.
4.4.1.1 The commonly used leadership style by rectors in the secondary schools
In order to gauge knowledge and understanding from educators, they were asked to select from the
three leadership styles under study, commonly practiced by their school leader. The findings are
presented in Table 4.4 below.
Leadership style applied by the rector of your school Frequency (f) Percent (%)
Autocratic leadership style 26 26.0
9
⊘ This is a preview!⊘
Do you want full access?
Subscribe today to unlock all pages.
Trusted by 1+ million students worldwide
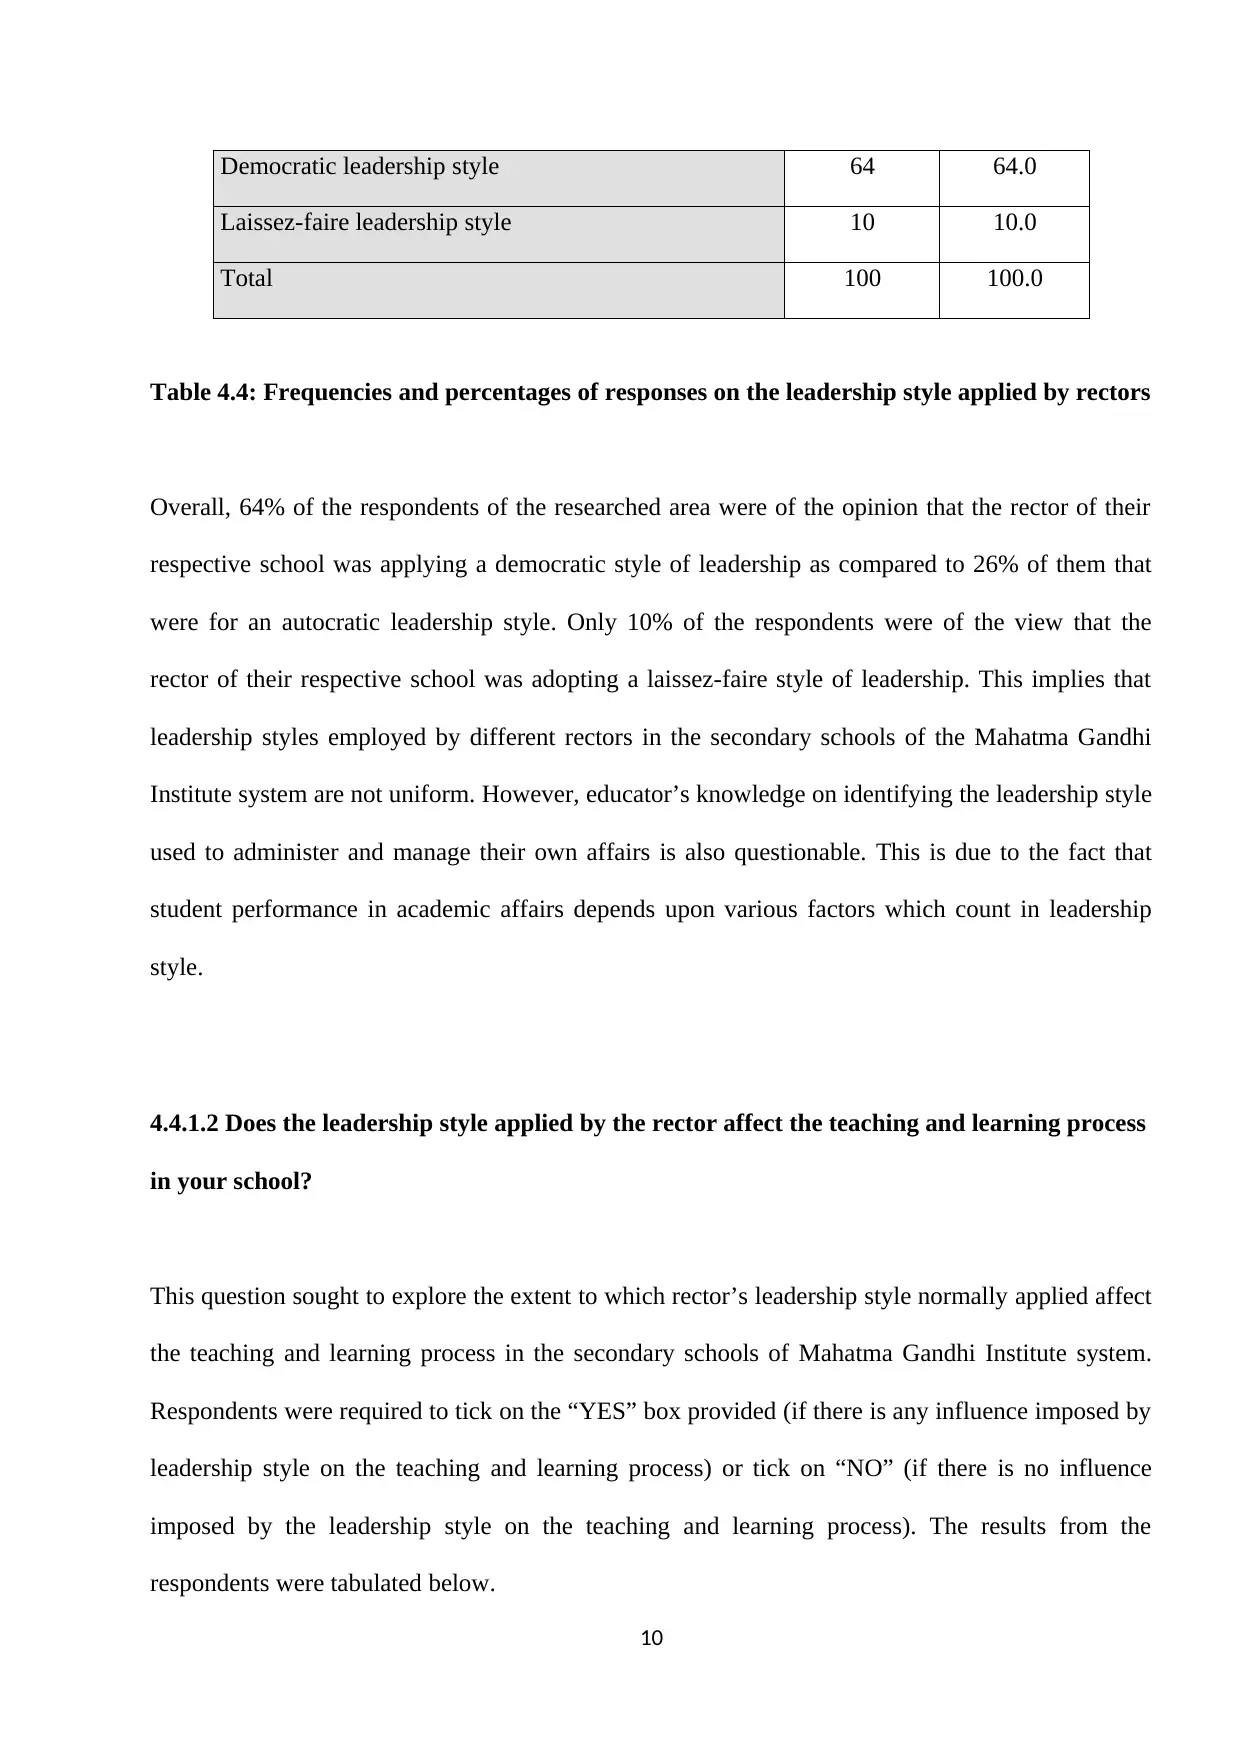
Democratic leadership style 64 64.0
Laissez-faire leadership style 10 10.0
Total 100 100.0
Table 4.4: Frequencies and percentages of responses on the leadership style applied by rectors
Overall, 64% of the respondents of the researched area were of the opinion that the rector of their
respective school was applying a democratic style of leadership as compared to 26% of them that
were for an autocratic leadership style. Only 10% of the respondents were of the view that the
rector of their respective school was adopting a laissez-faire style of leadership. This implies that
leadership styles employed by different rectors in the secondary schools of the Mahatma Gandhi
Institute system are not uniform. However, educator’s knowledge on identifying the leadership style
used to administer and manage their own affairs is also questionable. This is due to the fact that
student performance in academic affairs depends upon various factors which count in leadership
style.
4.4.1.2 Does the leadership style applied by the rector affect the teaching and learning process
in your school?
This question sought to explore the extent to which rector’s leadership style normally applied affect
the teaching and learning process in the secondary schools of Mahatma Gandhi Institute system.
Respondents were required to tick on the “YES” box provided (if there is any influence imposed by
leadership style on the teaching and learning process) or tick on “NO” (if there is no influence
imposed by the leadership style on the teaching and learning process). The results from the
respondents were tabulated below.
10
Paraphrase This Document
Need a fresh take? Get an instant paraphrase of this document with our AI Paraphraser
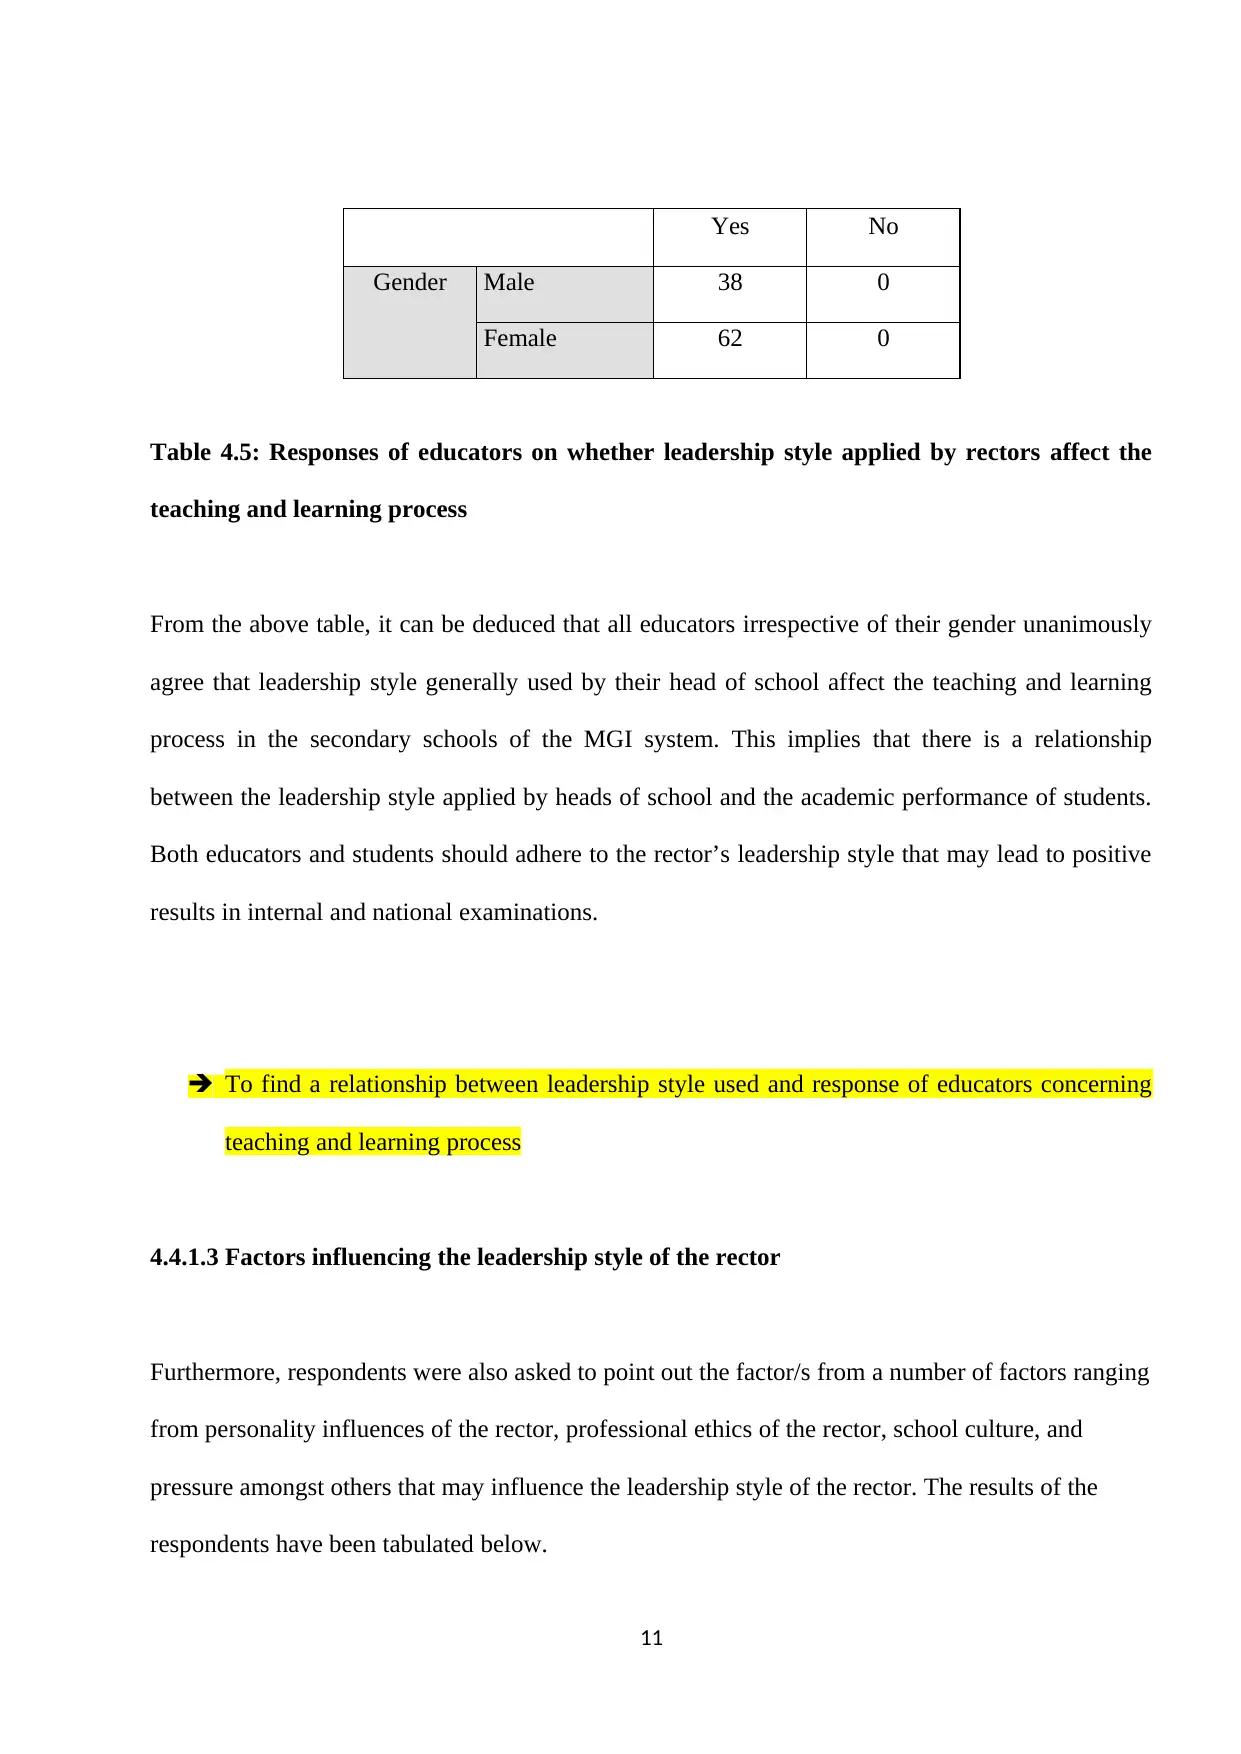
Yes No
Gender Male 38 0
Female 62 0
Table 4.5: Responses of educators on whether leadership style applied by rectors affect the
teaching and learning process
From the above table, it can be deduced that all educators irrespective of their gender unanimously
agree that leadership style generally used by their head of school affect the teaching and learning
process in the secondary schools of the MGI system. This implies that there is a relationship
between the leadership style applied by heads of school and the academic performance of students.
Both educators and students should adhere to the rector’s leadership style that may lead to positive
results in internal and national examinations.
To find a relationship between leadership style used and response of educators concerning
teaching and learning process
4.4.1.3 Factors influencing the leadership style of the rector
Furthermore, respondents were also asked to point out the factor/s from a number of factors ranging
from personality influences of the rector, professional ethics of the rector, school culture, and
pressure amongst others that may influence the leadership style of the rector. The results of the
respondents have been tabulated below.
11
Responses
Count Percent (%)
Factor/s that may influence the
leadership style of the rectora
Personality influences 84 18.4%
Professional ethics 74 16.2%
School culture 60 13.2%
Employee diversity 46 10.1%
Skills and experience of staff 60 13.2%
Pressure 38 8.3%
Feelings of security 38 8.3%
Nature of task 56 12.3%
Total 456 100.0%
a. Dichotomy group tabulated at value 1.
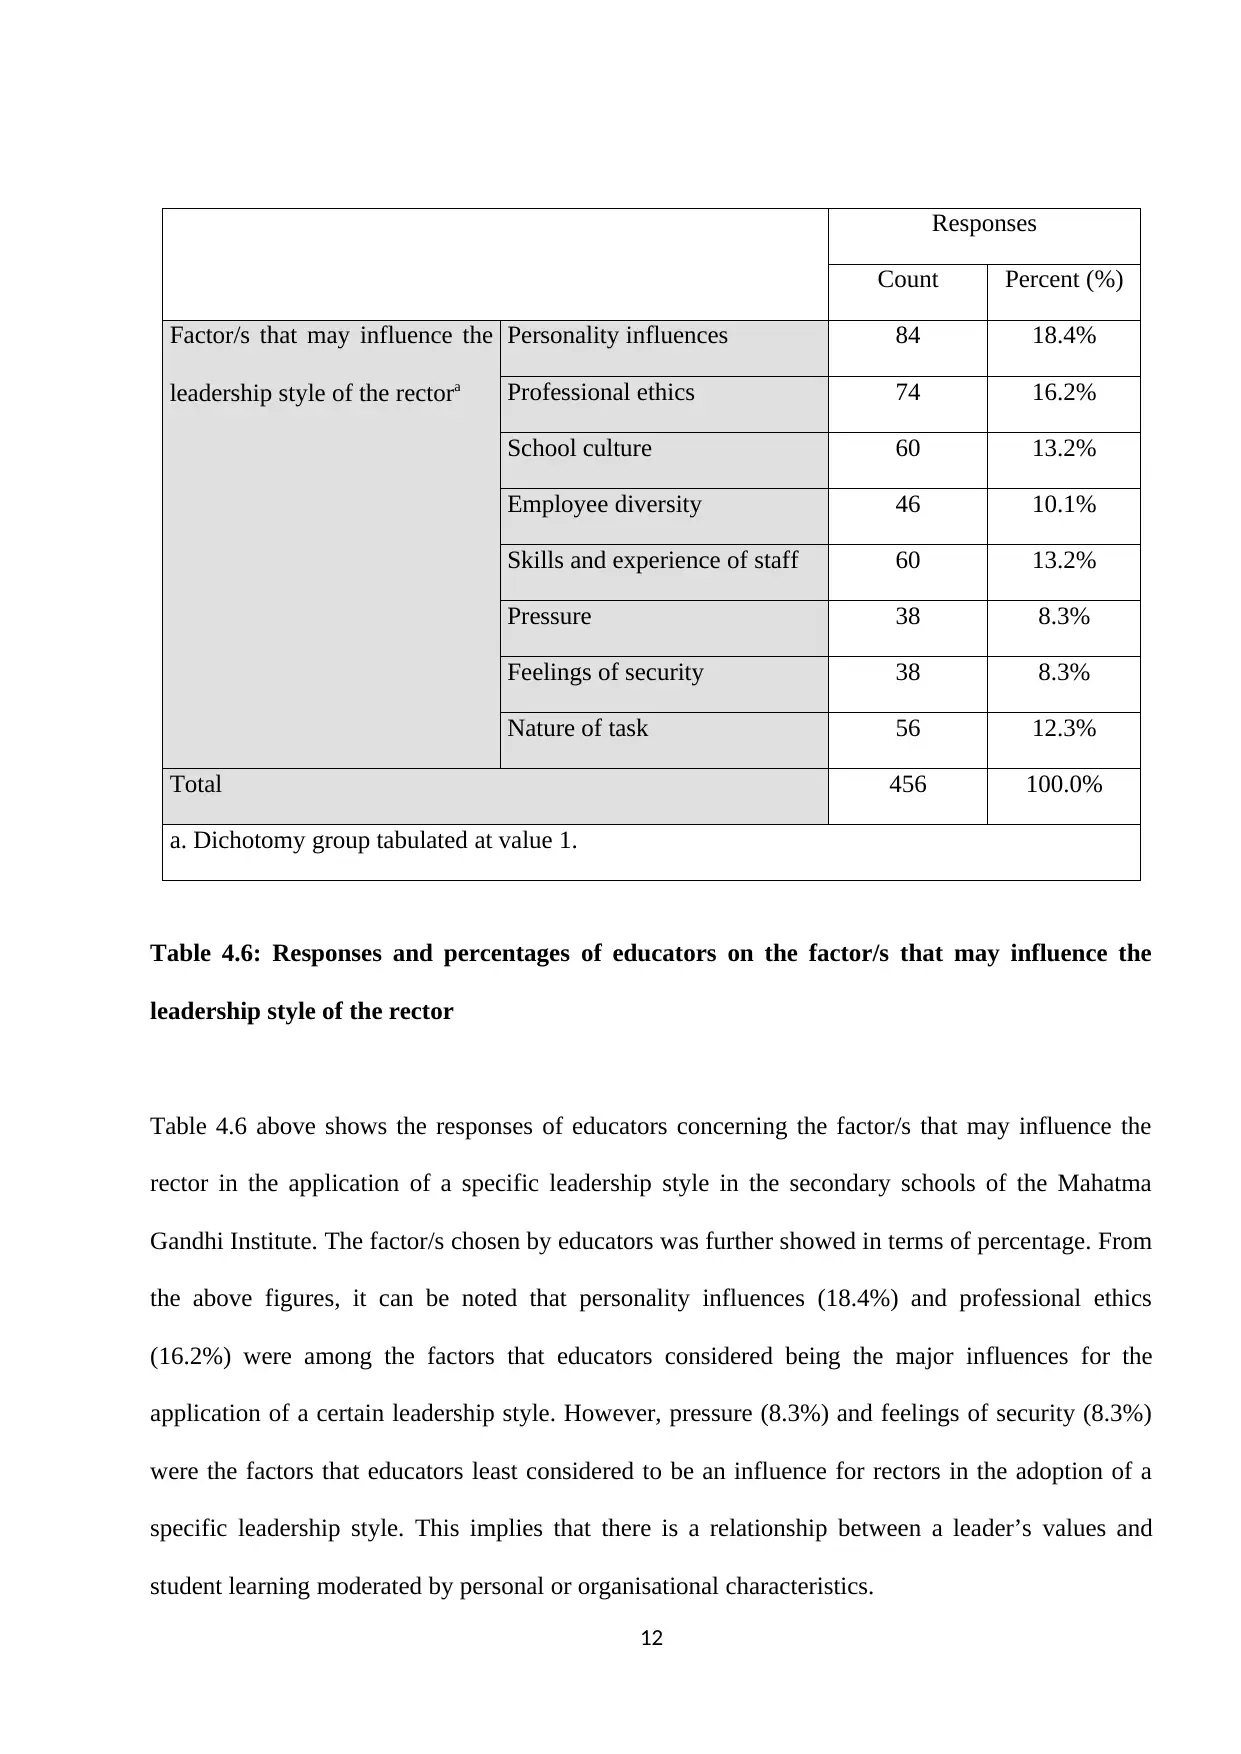
Table 4.6: Responses and percentages of educators on the factor/s that may influence the
leadership style of the rector
Table 4.6 above shows the responses of educators concerning the factor/s that may influence the
rector in the application of a specific leadership style in the secondary schools of the Mahatma
Gandhi Institute. The factor/s chosen by educators was further showed in terms of percentage. From
the above figures, it can be noted that personality influences (18.4%) and professional ethics
(16.2%) were among the factors that educators considered being the major influences for the
application of a certain leadership style. However, pressure (8.3%) and feelings of security (8.3%)
were the factors that educators least considered to be an influence for rectors in the adoption of a
specific leadership style. This implies that there is a relationship between a leader’s values and
student learning moderated by personal or organisational characteristics.
12
Count Percent (%)
Factor/s that may influence the
leadership style of the rectora
Personality influences 84 18.4%
Professional ethics 74 16.2%
School culture 60 13.2%
Employee diversity 46 10.1%
Skills and experience of staff 60 13.2%
Pressure 38 8.3%
Feelings of security 38 8.3%
Nature of task 56 12.3%
Total 456 100.0%
a. Dichotomy group tabulated at value 1.
Table 4.6: Responses and percentages of educators on the factor/s that may influence the
leadership style of the rector
Table 4.6 above shows the responses of educators concerning the factor/s that may influence the
rector in the application of a specific leadership style in the secondary schools of the Mahatma
Gandhi Institute. The factor/s chosen by educators was further showed in terms of percentage. From
the above figures, it can be noted that personality influences (18.4%) and professional ethics
(16.2%) were among the factors that educators considered being the major influences for the
application of a certain leadership style. However, pressure (8.3%) and feelings of security (8.3%)
were the factors that educators least considered to be an influence for rectors in the adoption of a
specific leadership style. This implies that there is a relationship between a leader’s values and
student learning moderated by personal or organisational characteristics.
12
⊘ This is a preview!⊘
Do you want full access?
Subscribe today to unlock all pages.
Trusted by 1+ million students worldwide
1 out of 55


Your All-in-One AI-Powered Toolkit for Academic Success.
+13062052269
info@desklib.com
Available 24*7 on WhatsApp / Email
![[object Object]](/_next/static/media/star-bottom.7253800d.svg)
Unlock your academic potential
Copyright © 2020–2026 A2Z Services. All Rights Reserved. Developed and managed by ZUCOL.