Leading Lean Projects: Case Study on Continuous Improvement at PEW
VerifiedAdded on 2023/06/04
|19
|3477
|358
Case Study
AI Summary
This case study analyzes Precision Engineering Works (PEW), an original equipment manufacturer facing declining profitability due to increased competition and employee attrition. The assessment identifies root causes using tools like Pareto analysis, cause and effect diagrams, and the 5 Whys, revealing issues like lack of employee skills, poor management coordination, and insufficient technical expertise. The solution proposes a comprehensive continuous improvement plan, including targeted training programs, updated management information systems, and technical skill development initiatives. The plan outlines resources required, follow-up actions, and expected competencies for effective change, focusing on business and strategic management, technical management, and leadership. The analysis highlights the importance of training, updated tools, and better management practices to restore profitability and market competitiveness for PEW.
Assessment 2: Case study: Continuous
Improvement
Improvement
Paraphrase This Document
Need a fresh take? Get an instant paraphrase of this document with our AI Paraphraser

Table of Contents
Introduction................................................................................................................................2
Determine the root cause that leads to the issues.......................................................................2
Assumption for this..................................................................................................................11
Conclusion................................................................................................................................12
References................................................................................................................................13
Introduction
According to Ilie, & Ciocoiu, (2010), the problem has been and will remain one of the major
issues of any organization and hampered the performance of the business and profitability.
The main objective of this assessment is to determine the root causes that lead to the issues of
an organization Precision Engineering works private limited. The organization is offering
original equipment manufacturing in modelling part for telecommunication organization. Due
to high competitions and entry of new clients in telecommunication industries, reduces
organization’s profitability about 45%. Thus main objective of this assessment is to evaluate
and analyze the main roots cause of these issues through seven tools and techniques. These
tools and techniques are Pareto analysis, cause and effect analysis, histogram, scatter
diagram, control chart and 5 why techniques. In addition to this, the assessment also
empathized upon the continuous improvement plan to ensure issues are not repeated.
Determine the root cause that leads to the issues
The consultant implemented Pareto analysis, cause and effect analysis, histogram, scatter
diagram, control chart and 5 why techniques. With help of fish bone diagram it can be
observed that lack of skills and unavailability technology leads the main issues why the
business is suffered from the profitability issues (Wong, 2011). Then the consultant
implemented the 5 WHY techniques in order to investigate the issues of reducing
organization profitability.
⊘ This is a preview!⊘
Do you want full access?
Subscribe today to unlock all pages.
Trusted by 1+ million students worldwide
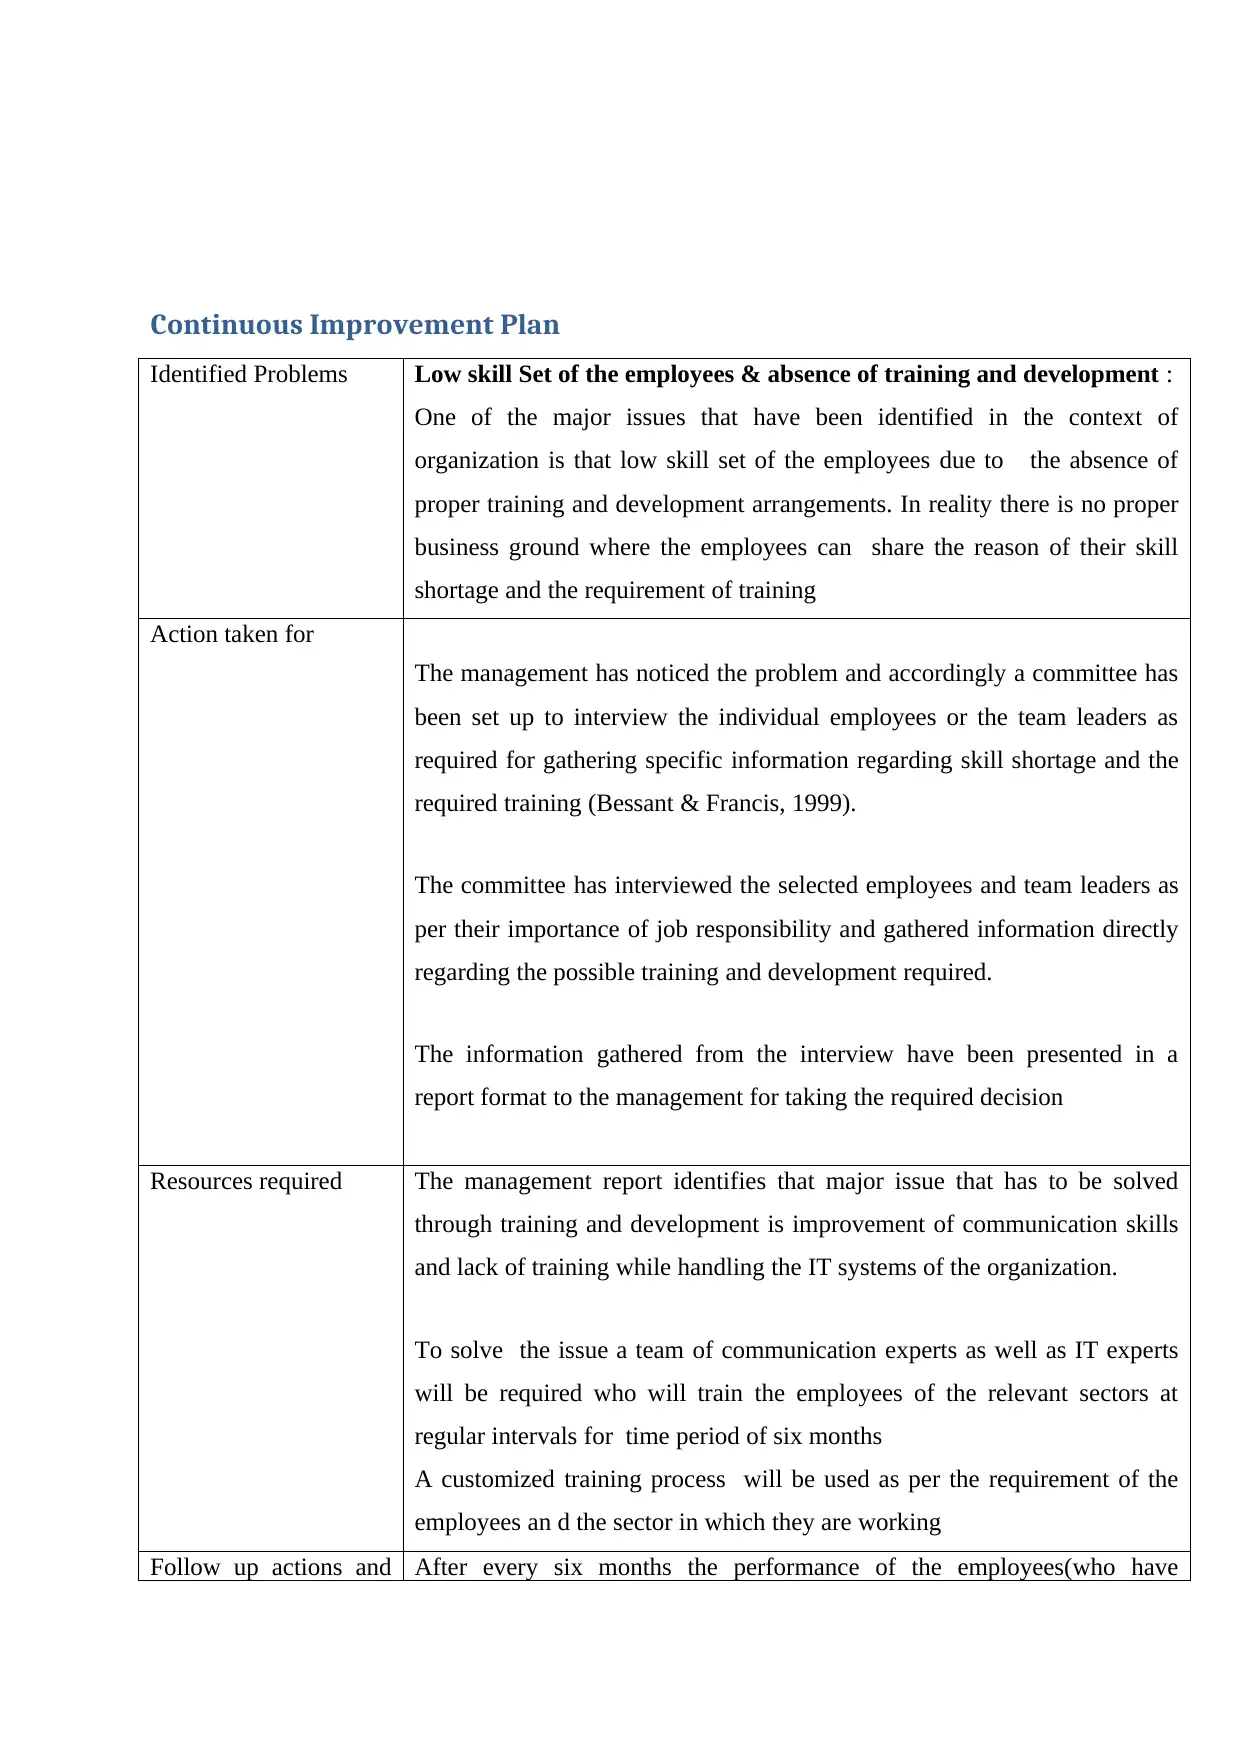
Continuous Improvement Plan
Identified Problems Low skill Set of the employees & absence of training and development :
One of the major issues that have been identified in the context of
organization is that low skill set of the employees due to the absence of
proper training and development arrangements. In reality there is no proper
business ground where the employees can share the reason of their skill
shortage and the requirement of training
Action taken for
The management has noticed the problem and accordingly a committee has
been set up to interview the individual employees or the team leaders as
required for gathering specific information regarding skill shortage and the
required training (Bessant & Francis, 1999).
The committee has interviewed the selected employees and team leaders as
per their importance of job responsibility and gathered information directly
regarding the possible training and development required.
The information gathered from the interview have been presented in a
report format to the management for taking the required decision
Resources required The management report identifies that major issue that has to be solved
through training and development is improvement of communication skills
and lack of training while handling the IT systems of the organization.
To solve the issue a team of communication experts as well as IT experts
will be required who will train the employees of the relevant sectors at
regular intervals for time period of six months
A customized training process will be used as per the requirement of the
employees an d the sector in which they are working
Follow up actions and After every six months the performance of the employees(who have
Paraphrase This Document
Need a fresh take? Get an instant paraphrase of this document with our AI Paraphraser
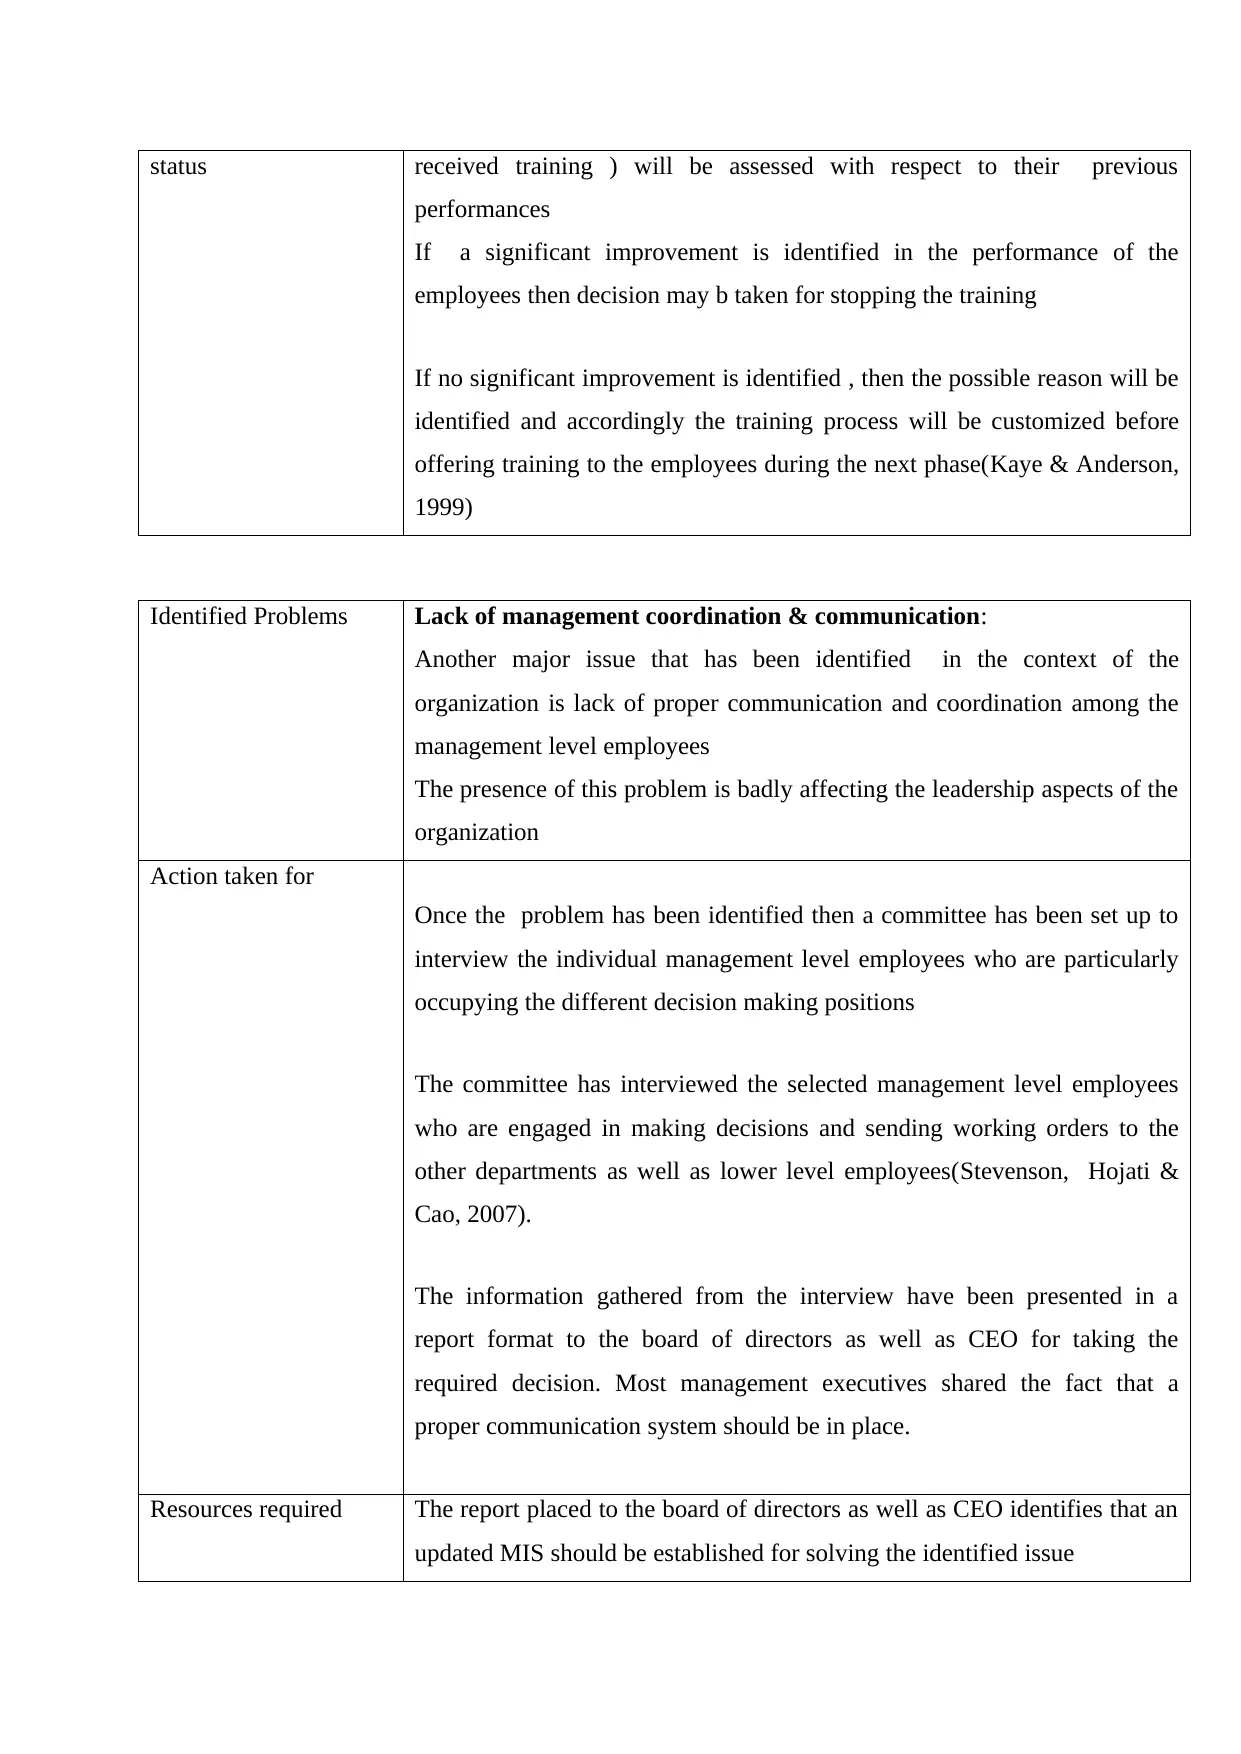
status received training ) will be assessed with respect to their previous
performances
If a significant improvement is identified in the performance of the
employees then decision may b taken for stopping the training
If no significant improvement is identified , then the possible reason will be
identified and accordingly the training process will be customized before
offering training to the employees during the next phase(Kaye & Anderson,
1999)
Identified Problems Lack of management coordination & communication:
Another major issue that has been identified in the context of the
organization is lack of proper communication and coordination among the
management level employees
The presence of this problem is badly affecting the leadership aspects of the
organization
Action taken for
Once the problem has been identified then a committee has been set up to
interview the individual management level employees who are particularly
occupying the different decision making positions
The committee has interviewed the selected management level employees
who are engaged in making decisions and sending working orders to the
other departments as well as lower level employees(Stevenson, Hojati &
Cao, 2007).
The information gathered from the interview have been presented in a
report format to the board of directors as well as CEO for taking the
required decision. Most management executives shared the fact that a
proper communication system should be in place.
Resources required The report placed to the board of directors as well as CEO identifies that an
updated MIS should be established for solving the identified issue
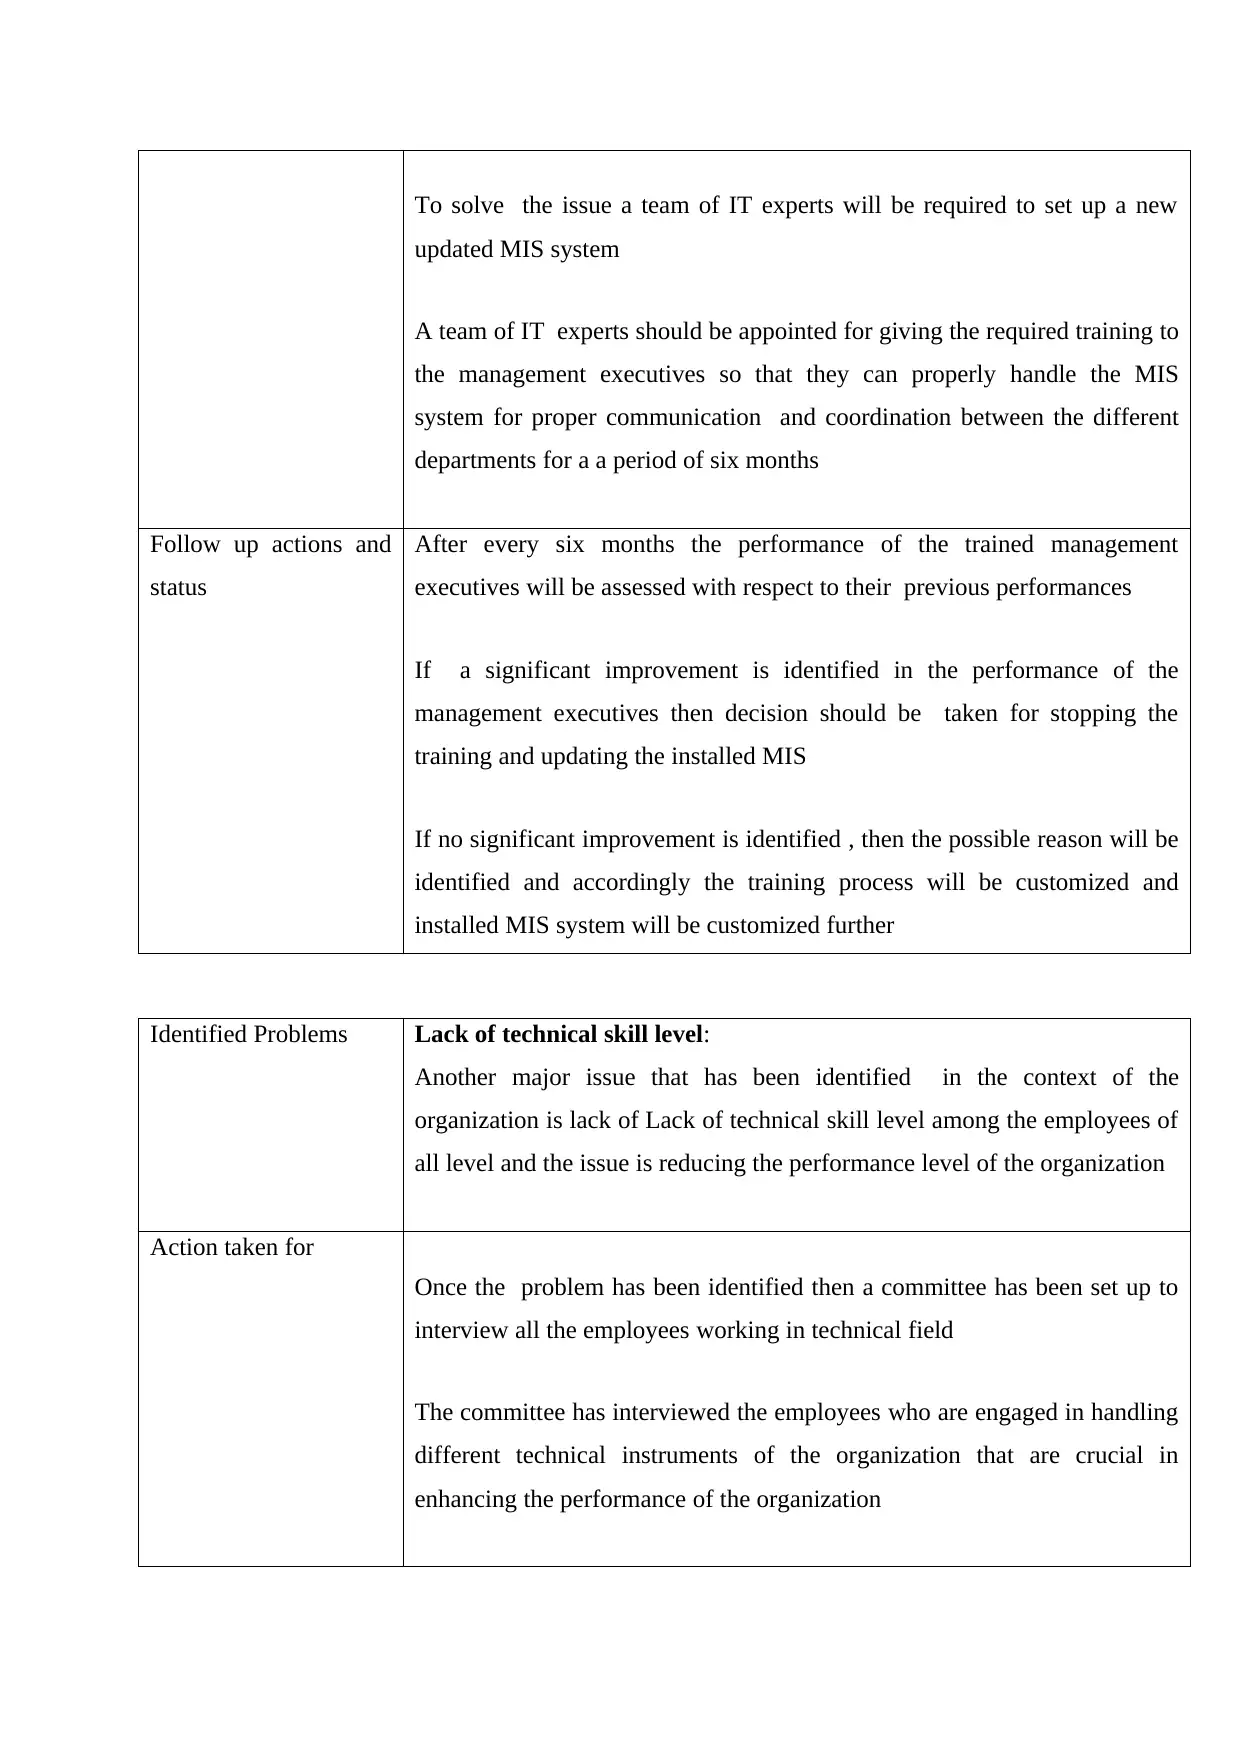
To solve the issue a team of IT experts will be required to set up a new
updated MIS system
A team of IT experts should be appointed for giving the required training to
the management executives so that they can properly handle the MIS
system for proper communication and coordination between the different
departments for a a period of six months
Follow up actions and
status
After every six months the performance of the trained management
executives will be assessed with respect to their previous performances
If a significant improvement is identified in the performance of the
management executives then decision should be taken for stopping the
training and updating the installed MIS
If no significant improvement is identified , then the possible reason will be
identified and accordingly the training process will be customized and
installed MIS system will be customized further
Identified Problems Lack of technical skill level:
Another major issue that has been identified in the context of the
organization is lack of Lack of technical skill level among the employees of
all level and the issue is reducing the performance level of the organization
Action taken for
Once the problem has been identified then a committee has been set up to
interview all the employees working in technical field
The committee has interviewed the employees who are engaged in handling
different technical instruments of the organization that are crucial in
enhancing the performance of the organization
⊘ This is a preview!⊘
Do you want full access?
Subscribe today to unlock all pages.
Trusted by 1+ million students worldwide
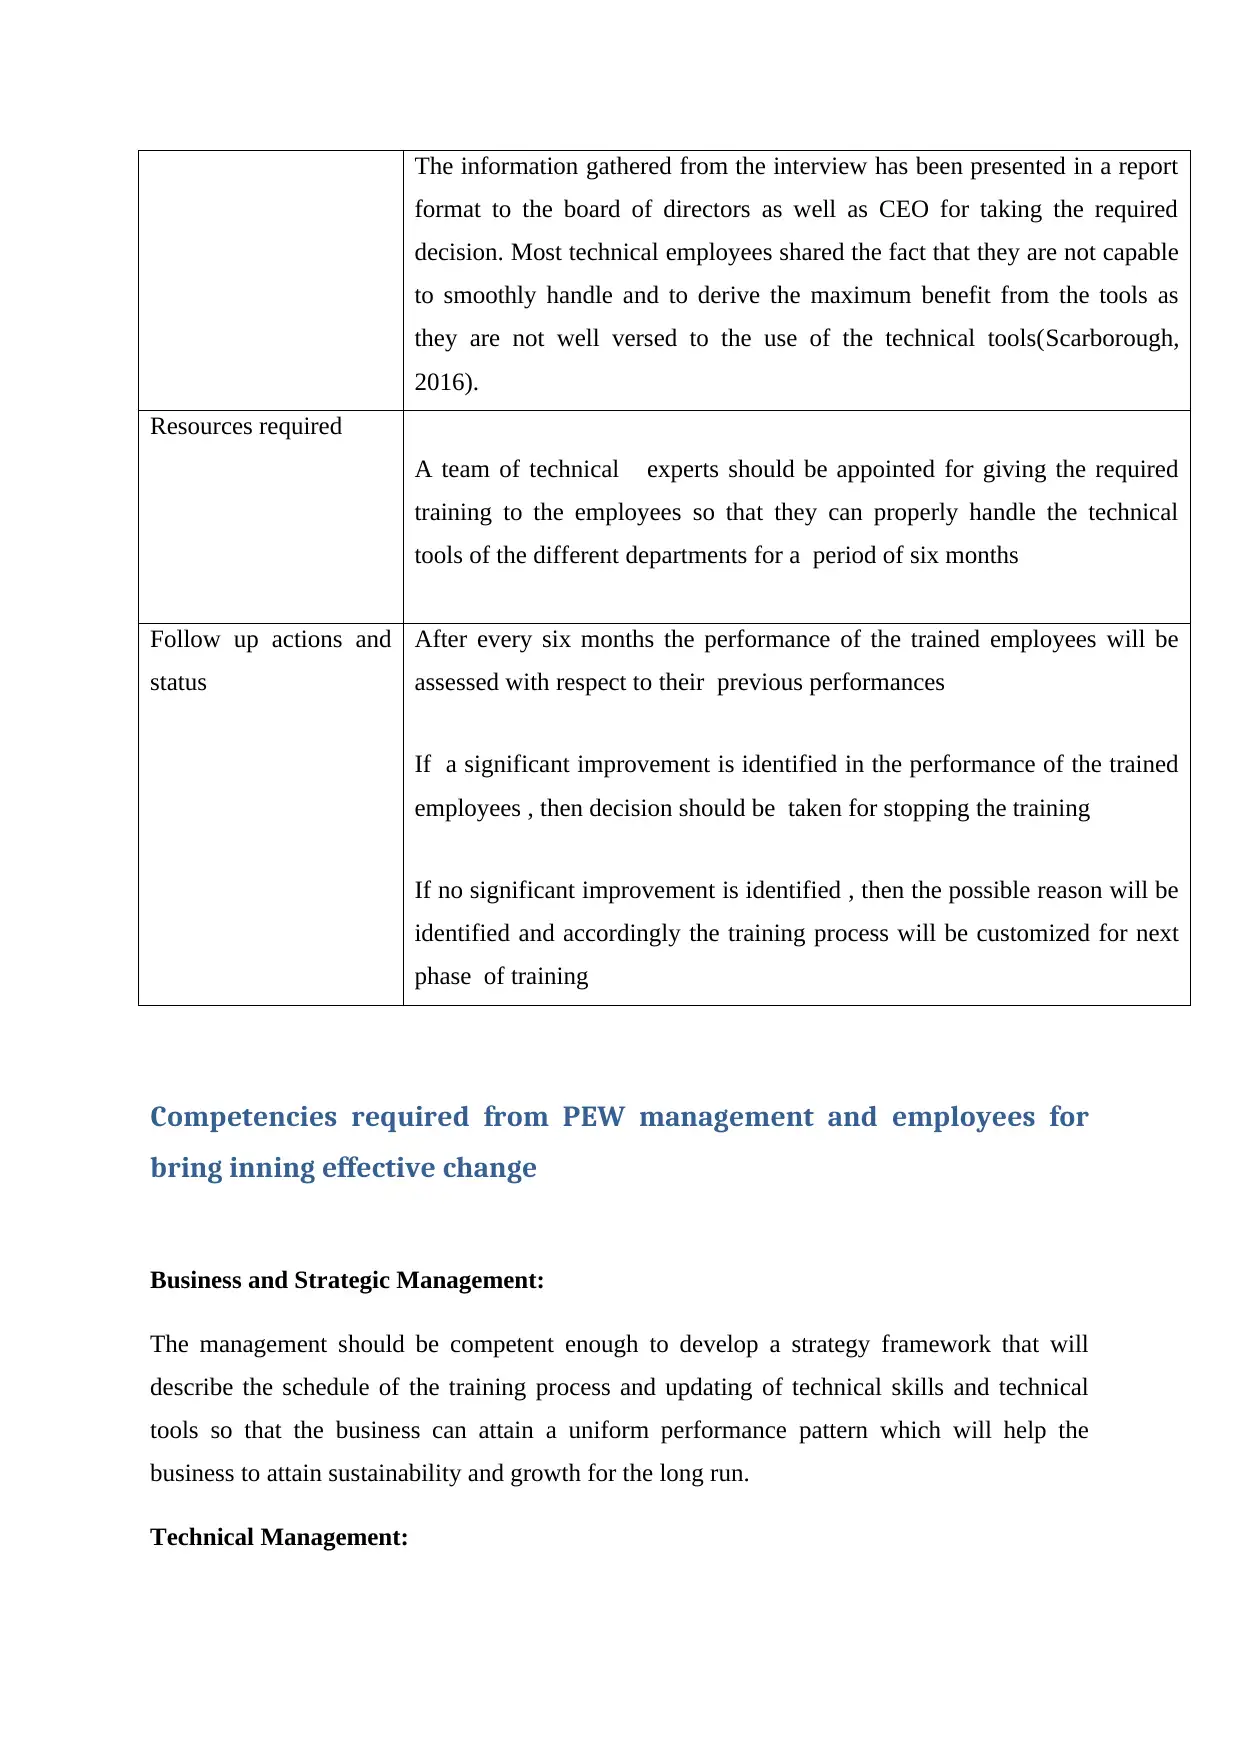
The information gathered from the interview has been presented in a report
format to the board of directors as well as CEO for taking the required
decision. Most technical employees shared the fact that they are not capable
to smoothly handle and to derive the maximum benefit from the tools as
they are not well versed to the use of the technical tools(Scarborough,
2016).
Resources required
A team of technical experts should be appointed for giving the required
training to the employees so that they can properly handle the technical
tools of the different departments for a period of six months
Follow up actions and
status
After every six months the performance of the trained employees will be
assessed with respect to their previous performances
If a significant improvement is identified in the performance of the trained
employees , then decision should be taken for stopping the training
If no significant improvement is identified , then the possible reason will be
identified and accordingly the training process will be customized for next
phase of training
Competencies required from PEW management and employees for
bring inning effective change
Business and Strategic Management:
The management should be competent enough to develop a strategy framework that will
describe the schedule of the training process and updating of technical skills and technical
tools so that the business can attain a uniform performance pattern which will help the
business to attain sustainability and growth for the long run.
Technical Management:
Paraphrase This Document
Need a fresh take? Get an instant paraphrase of this document with our AI Paraphraser
For proper technical management the employees of the organization has to be technically
sound enough so that they can properly handle the technical tools for processing of
information and maintaining proper communication and coordination between the employees
of the different departments(Bücker, & Poutsma, 2010).
Leadership:
The management level employees who are engaged in decision making should be competent
enough to take the right business decision at the right time and to change the course of
working from time to time as per the requirement of the changing business situations so that
the business can maintain uniform growth pattern in the long term.
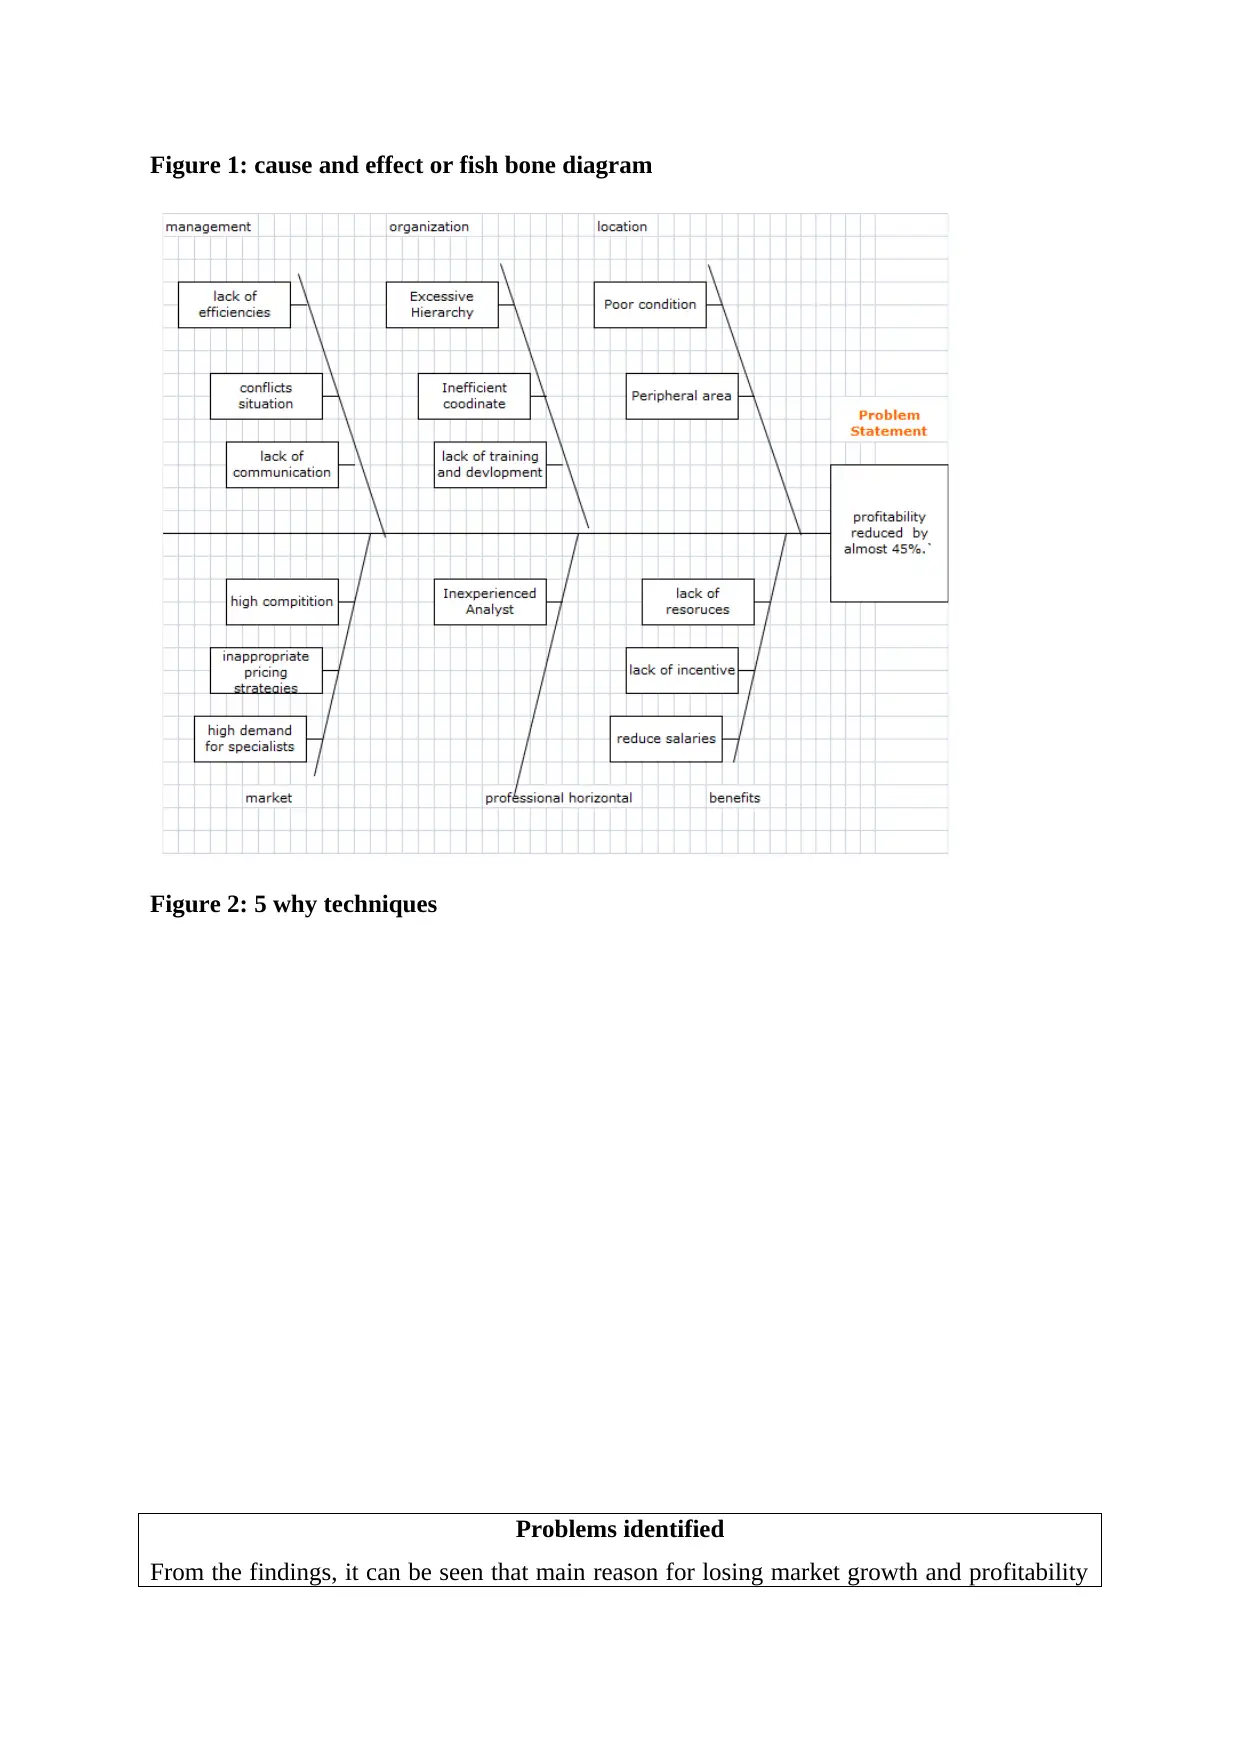
Figure 1: cause and effect or fish bone diagram
Figure 2: 5 why techniques
Problems identified
From the findings, it can be seen that main reason for losing market growth and profitability
Figure 2: 5 why techniques
Problems identified
From the findings, it can be seen that main reason for losing market growth and profitability
⊘ This is a preview!⊘
Do you want full access?
Subscribe today to unlock all pages.
Trusted by 1+ million students worldwide
is lack of training and development and updated tools and techniques.
Counter measure
Provide an appropriate training and development to staffs members who can deliver products
with better quality, so that the organization can continue to reduce inventory, reduce wastage
and response to client’s demand in successful manner.
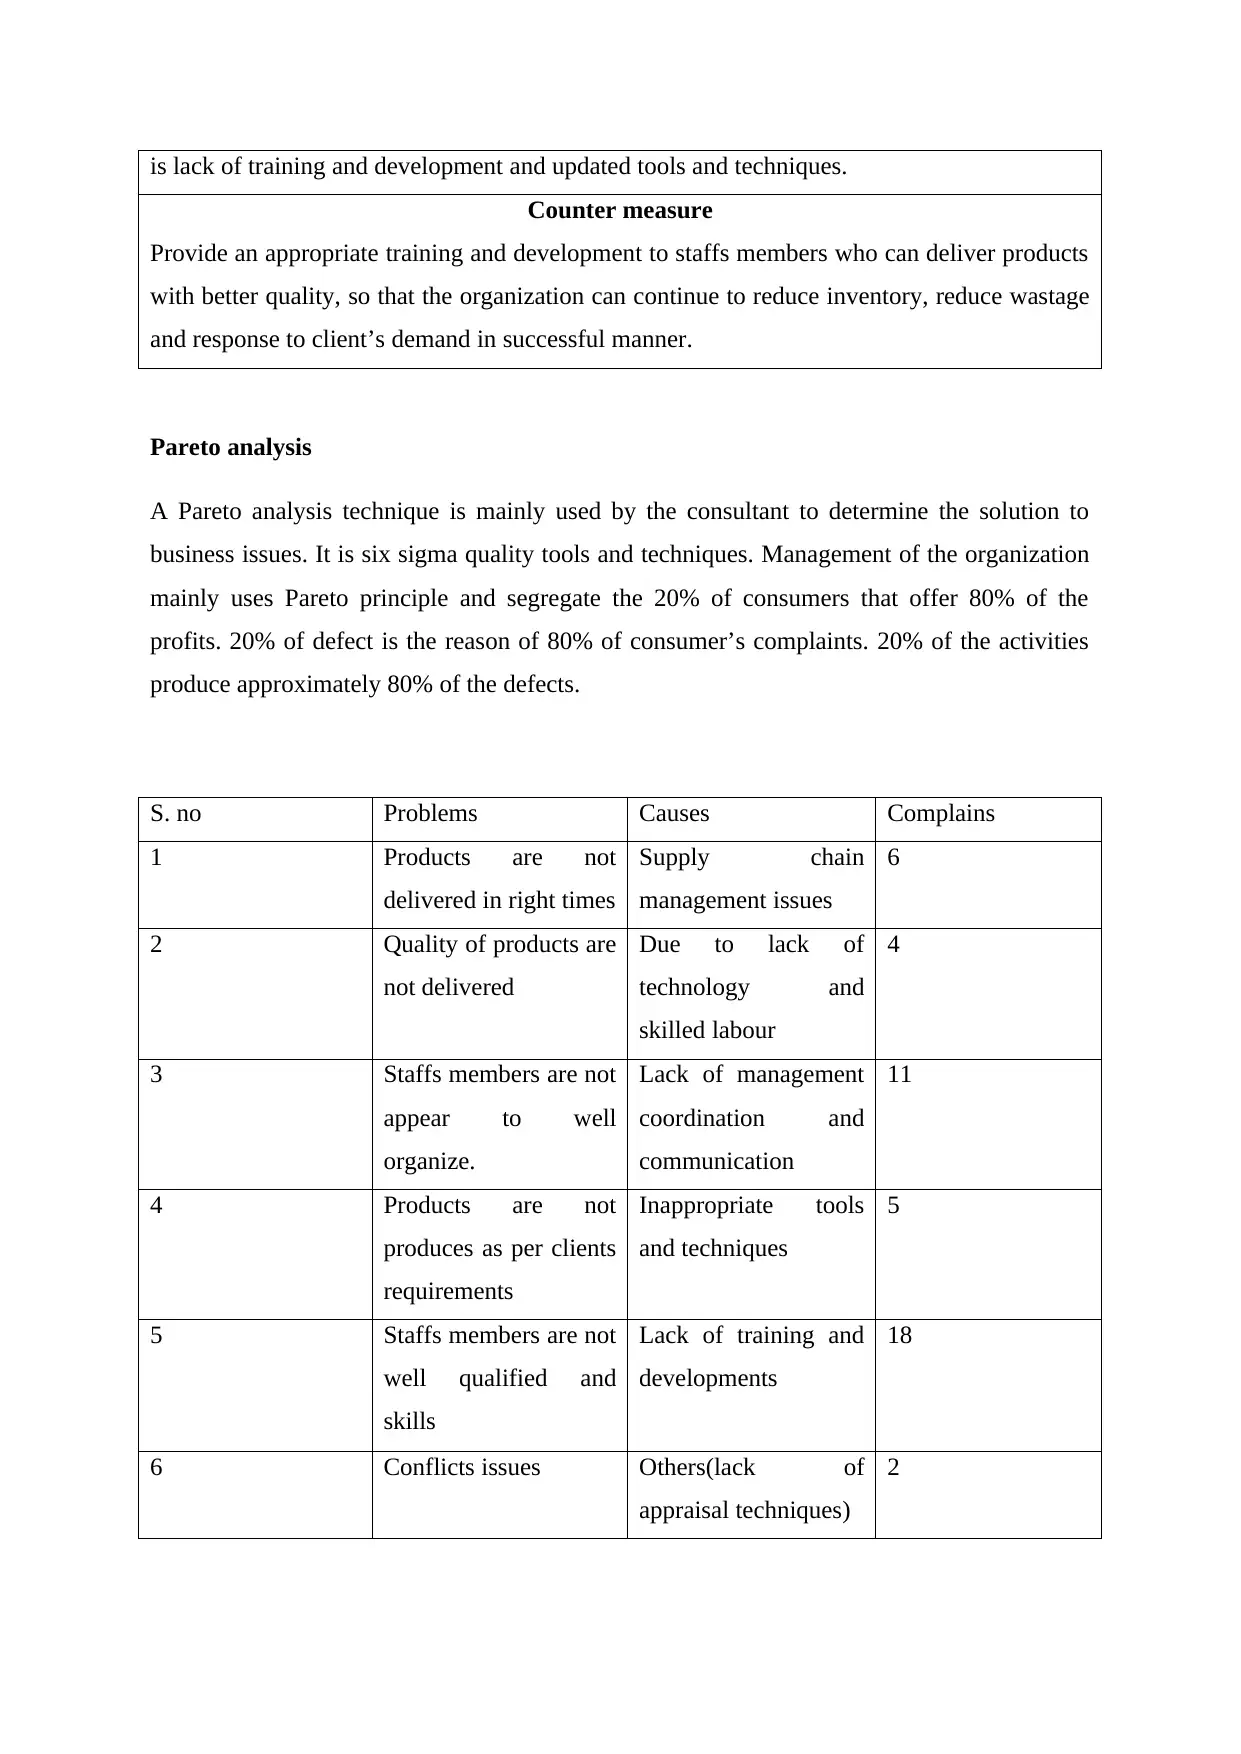
Pareto analysis
A Pareto analysis technique is mainly used by the consultant to determine the solution to
business issues. It is six sigma quality tools and techniques. Management of the organization
mainly uses Pareto principle and segregate the 20% of consumers that offer 80% of the
profits. 20% of defect is the reason of 80% of consumer’s complaints. 20% of the activities
produce approximately 80% of the defects.
S. no Problems Causes Complains
1 Products are not
delivered in right times
Supply chain
management issues
6
2 Quality of products are
not delivered
Due to lack of
technology and
skilled labour
4
3 Staffs members are not
appear to well
organize.
Lack of management
coordination and
communication
11
4 Products are not
produces as per clients
requirements
Inappropriate tools
and techniques
5
5 Staffs members are not
well qualified and
skills
Lack of training and
developments
18
6 Conflicts issues Others(lack of
appraisal techniques)
2
Counter measure
Provide an appropriate training and development to staffs members who can deliver products
with better quality, so that the organization can continue to reduce inventory, reduce wastage
and response to client’s demand in successful manner.
Pareto analysis
A Pareto analysis technique is mainly used by the consultant to determine the solution to
business issues. It is six sigma quality tools and techniques. Management of the organization
mainly uses Pareto principle and segregate the 20% of consumers that offer 80% of the
profits. 20% of defect is the reason of 80% of consumer’s complaints. 20% of the activities
produce approximately 80% of the defects.
S. no Problems Causes Complains
1 Products are not
delivered in right times
Supply chain
management issues
6
2 Quality of products are
not delivered
Due to lack of
technology and
skilled labour
4
3 Staffs members are not
appear to well
organize.
Lack of management
coordination and
communication
11
4 Products are not
produces as per clients
requirements
Inappropriate tools
and techniques
5
5 Staffs members are not
well qualified and
skills
Lack of training and
developments
18
6 Conflicts issues Others(lack of
appraisal techniques)
2
Paraphrase This Document
Need a fresh take? Get an instant paraphrase of this document with our AI Paraphraser
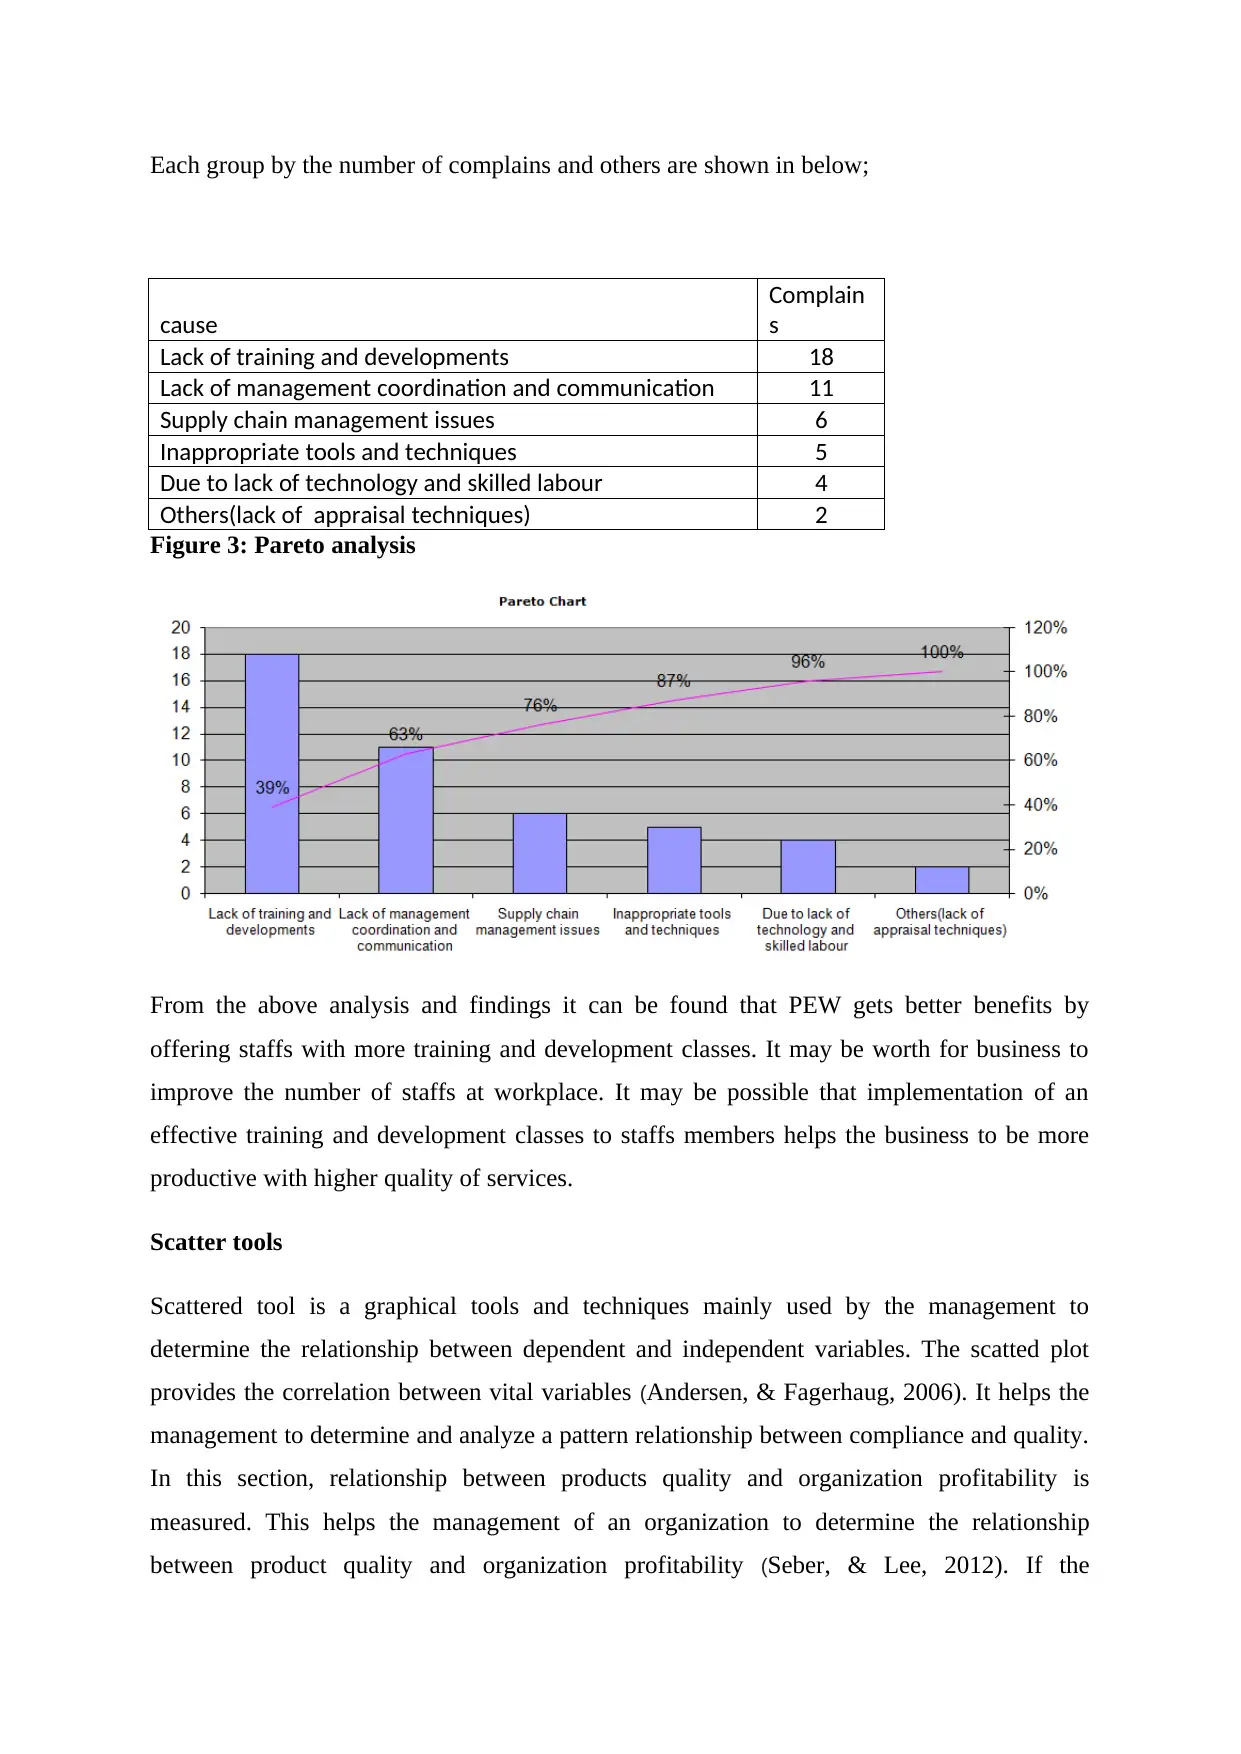
Each group by the number of complains and others are shown in below;
cause
Complain
s
Lack of training and developments 18
Lack of management coordination and communication 11
Supply chain management issues 6
Inappropriate tools and techniques 5
Due to lack of technology and skilled labour 4
Others(lack of appraisal techniques) 2
Figure 3: Pareto analysis
From the above analysis and findings it can be found that PEW gets better benefits by
offering staffs with more training and development classes. It may be worth for business to
improve the number of staffs at workplace. It may be possible that implementation of an
effective training and development classes to staffs members helps the business to be more
productive with higher quality of services.
Scatter tools
Scattered tool is a graphical tools and techniques mainly used by the management to
determine the relationship between dependent and independent variables. The scatted plot
provides the correlation between vital variables (Andersen, & Fagerhaug, 2006). It helps the
management to determine and analyze a pattern relationship between compliance and quality.
In this section, relationship between products quality and organization profitability is
measured. This helps the management of an organization to determine the relationship
between product quality and organization profitability (Seber, & Lee, 2012). If the
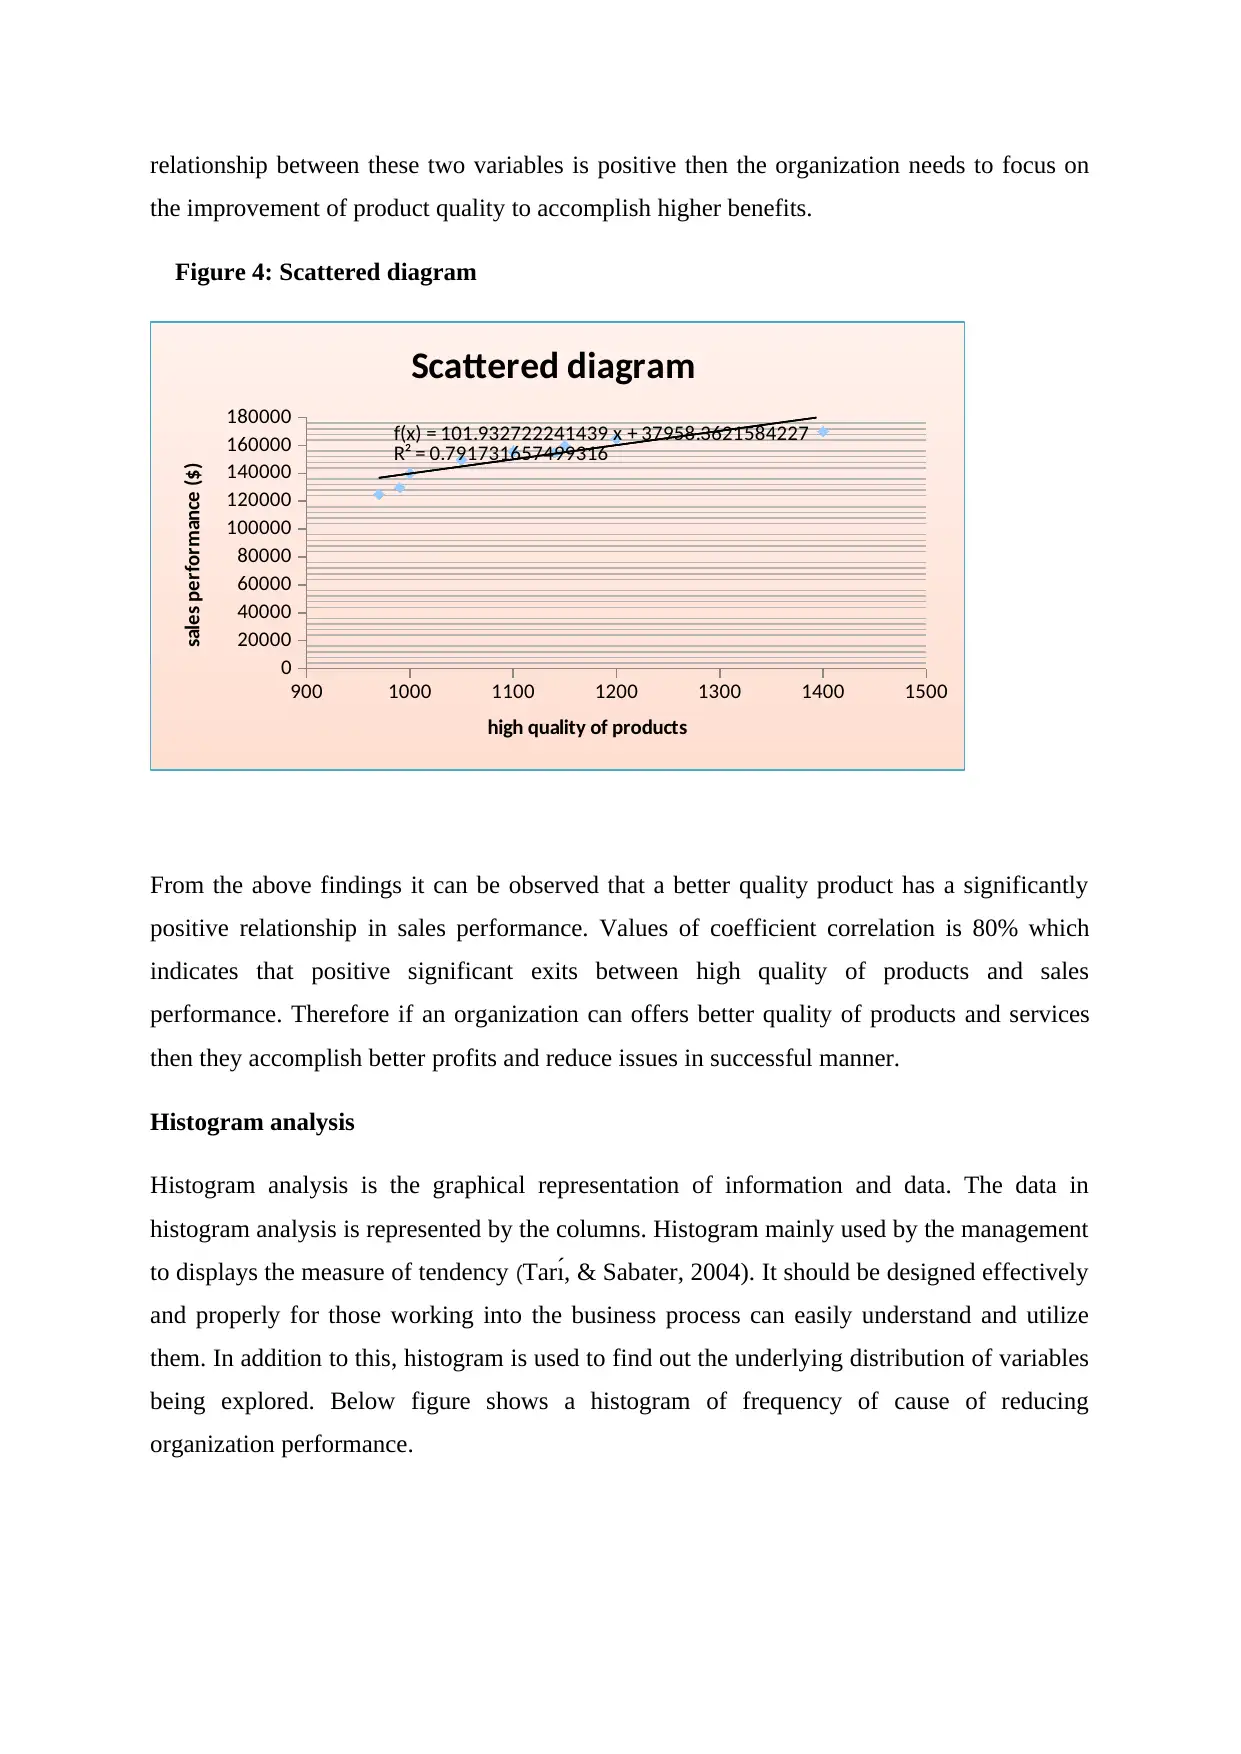
relationship between these two variables is positive then the organization needs to focus on
the improvement of product quality to accomplish higher benefits.
Figure 4: Scattered diagram
900 1000 1100 1200 1300 1400 1500
0
20000
40000
60000
80000
100000
120000
140000
160000
180000 f(x) = 101.932722241439 x + 37958.3621584227
R² = 0.791731657499316
Scattered diagram
high quality of products
sales performance ($)
From the above findings it can be observed that a better quality product has a significantly
positive relationship in sales performance. Values of coefficient correlation is 80% which
indicates that positive significant exits between high quality of products and sales
performance. Therefore if an organization can offers better quality of products and services
then they accomplish better profits and reduce issues in successful manner.
Histogram analysis
Histogram analysis is the graphical representation of information and data. The data in
histogram analysis is represented by the columns. Histogram mainly used by the management
to displays the measure of tendency (Tarı́, & Sabater, 2004). It should be designed effectively
and properly for those working into the business process can easily understand and utilize
them. In addition to this, histogram is used to find out the underlying distribution of variables
being explored. Below figure shows a histogram of frequency of cause of reducing
organization performance.
⊘ This is a preview!⊘
Do you want full access?
Subscribe today to unlock all pages.
Trusted by 1+ million students worldwide
1 out of 19
Related Documents


Your All-in-One AI-Powered Toolkit for Academic Success.
+13062052269
info@desklib.com
Available 24*7 on WhatsApp / Email
![[object Object]](/_next/static/media/star-bottom.7253800d.svg)
Unlock your academic potential
Copyright © 2020–2026 A2Z Services. All Rights Reserved. Developed and managed by ZUCOL.