Case Study: Lego Plant Robot Project- Capacity, Demand Analysis

Verified

Added on  2023/06/08

|15
|2463
|484
Case Study
AI Summary
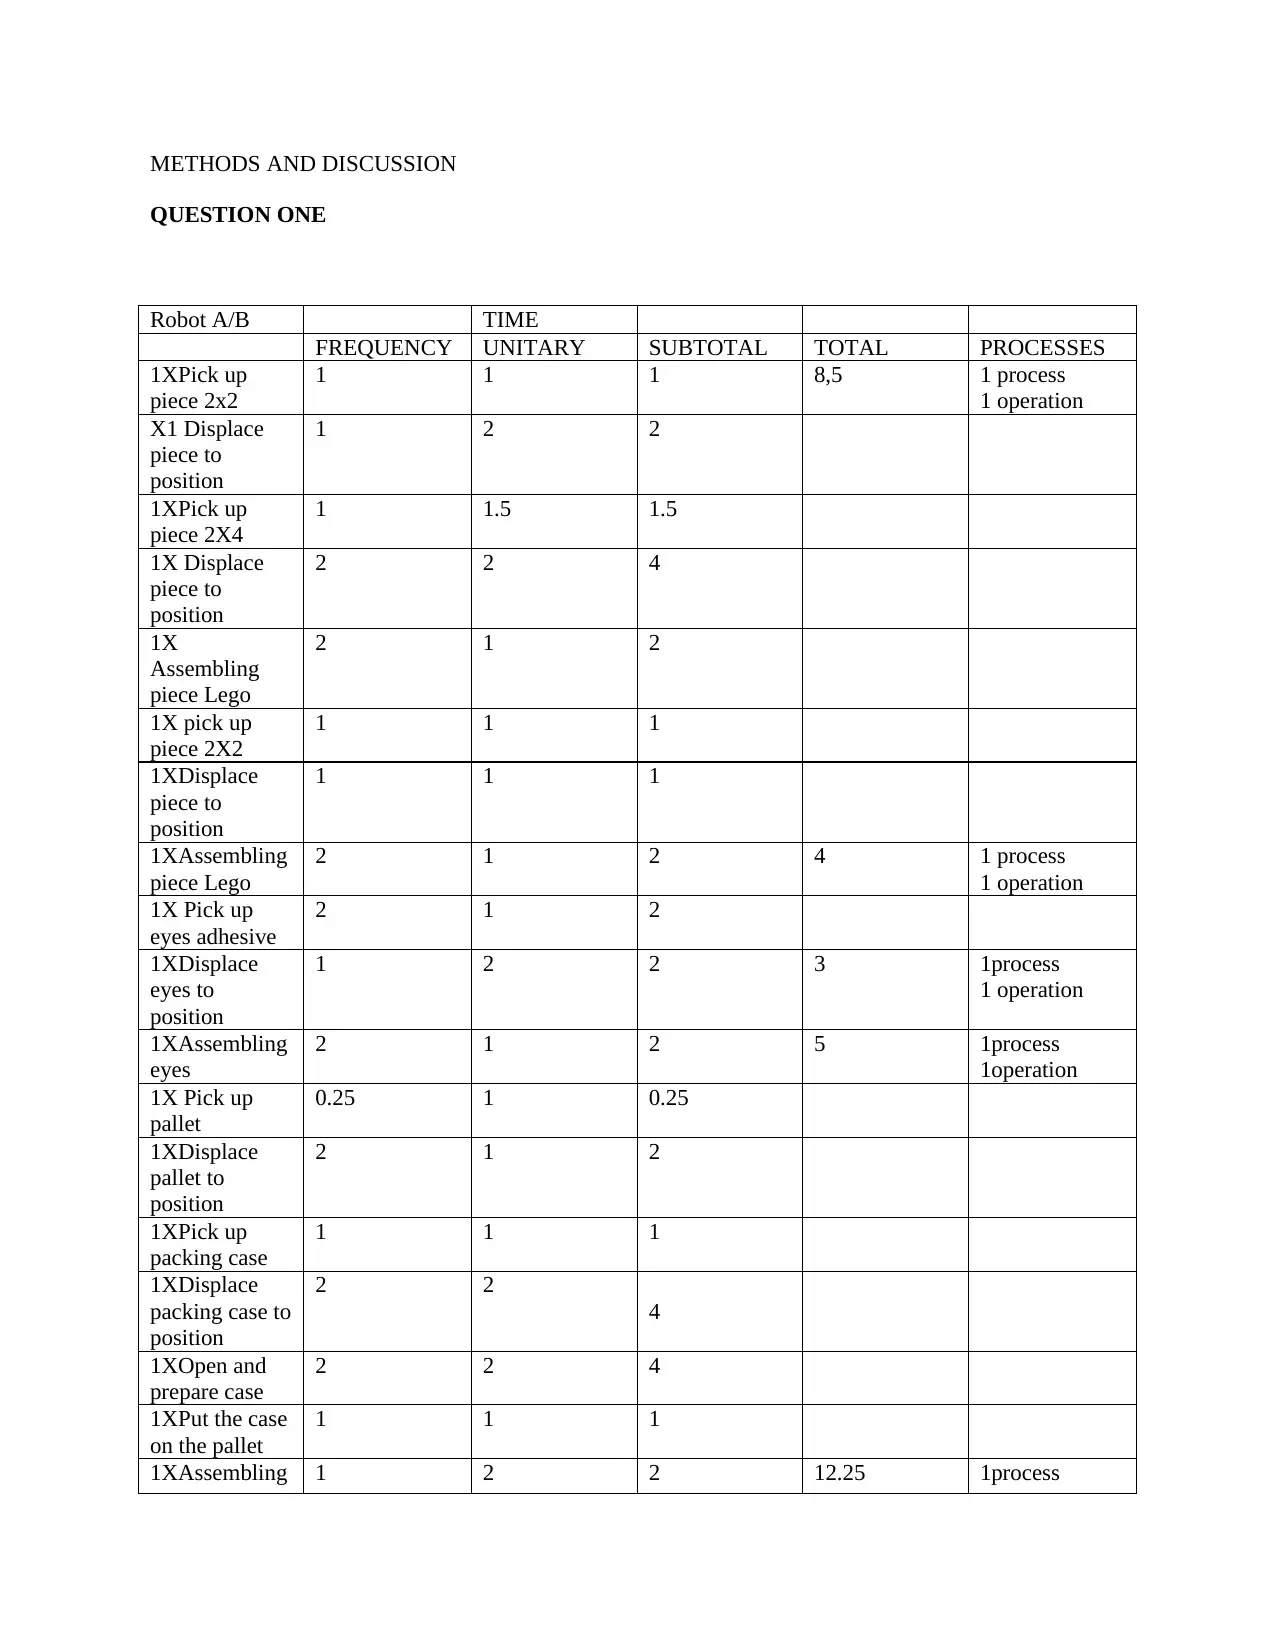
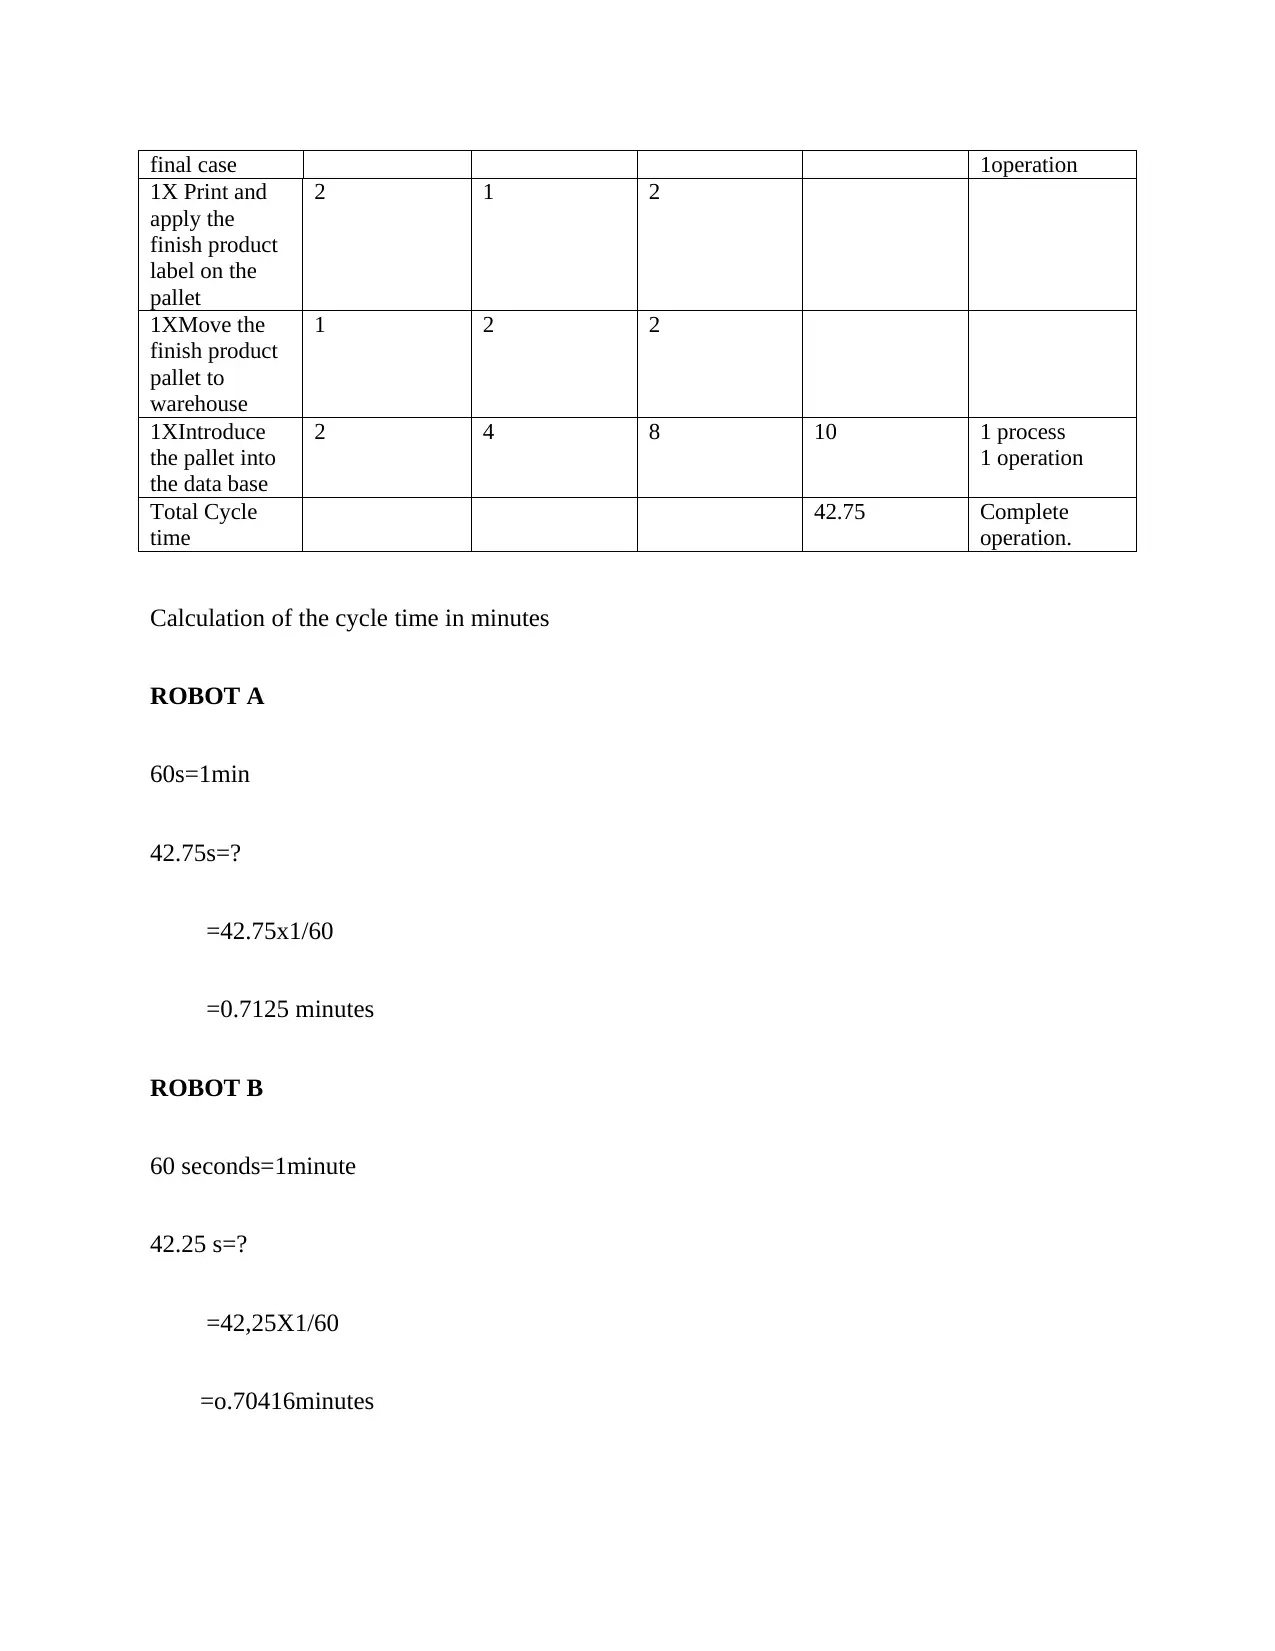
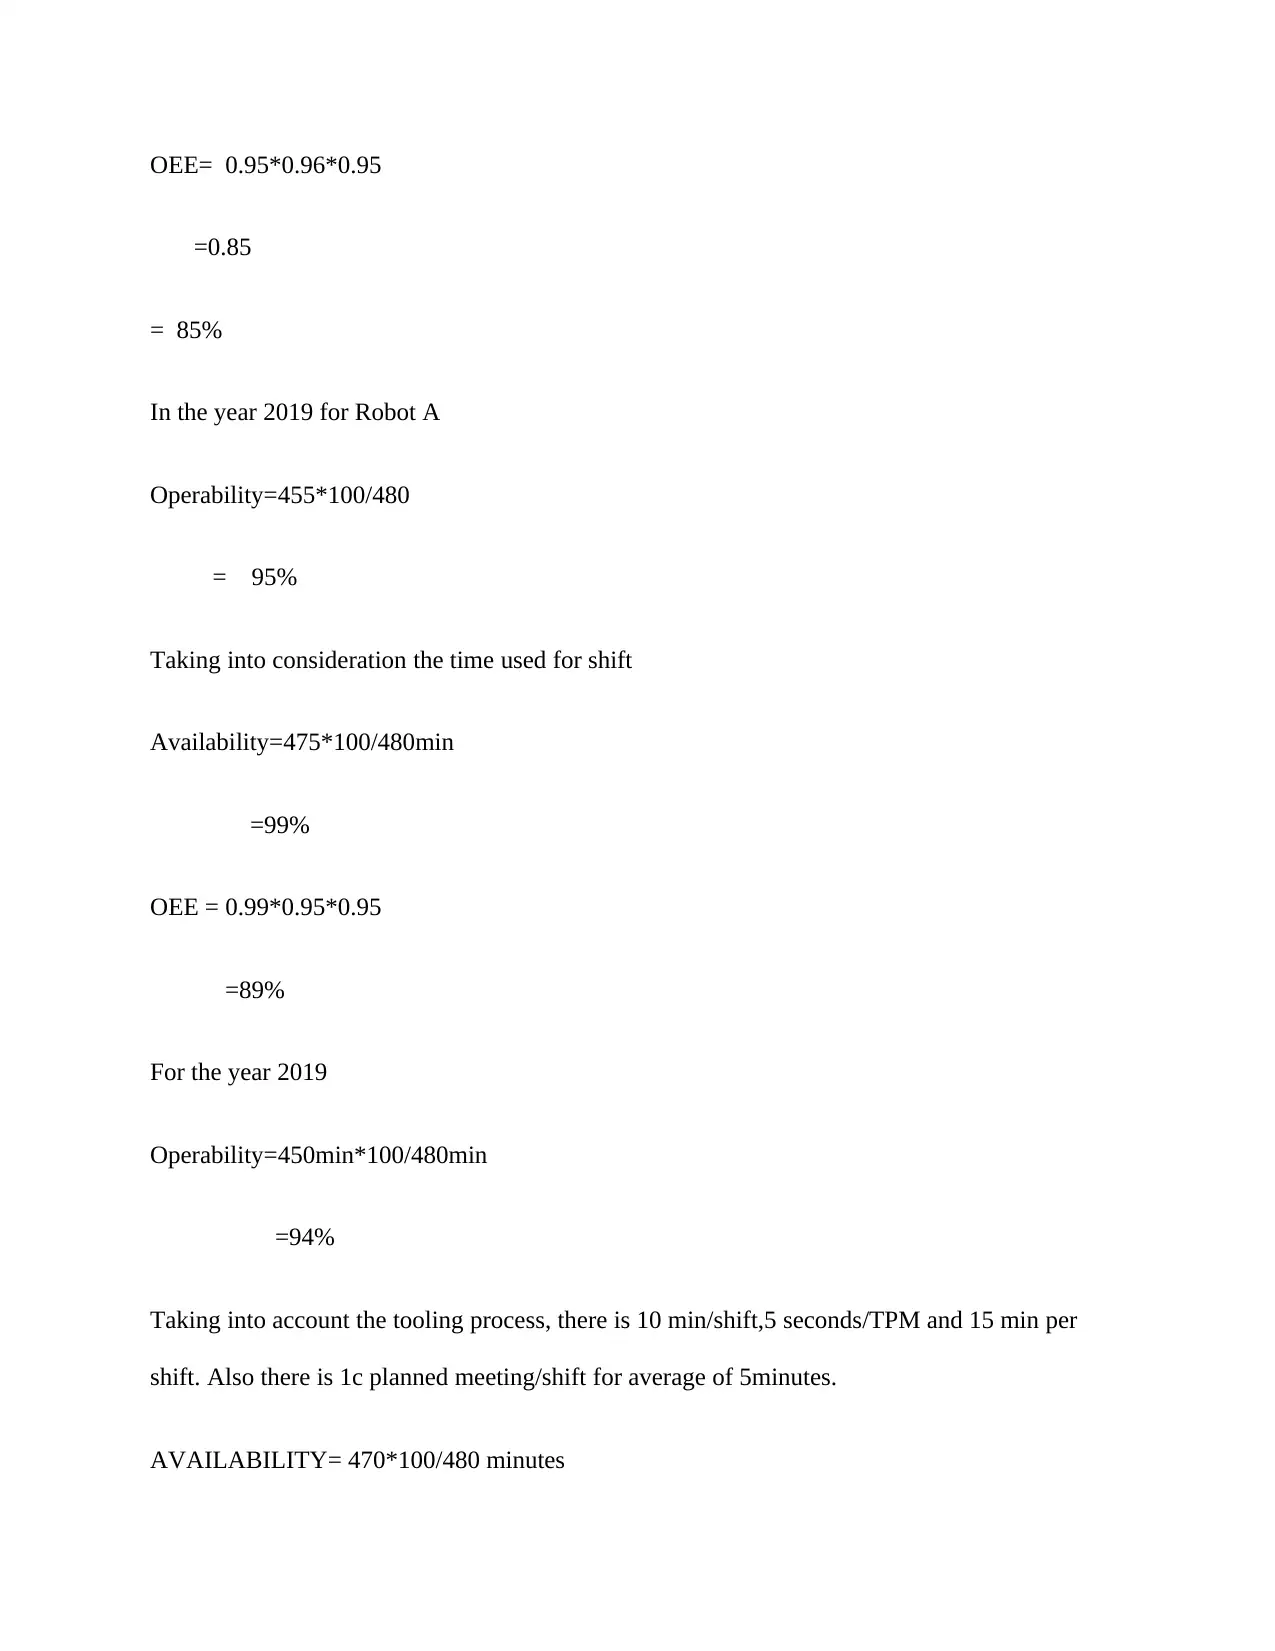
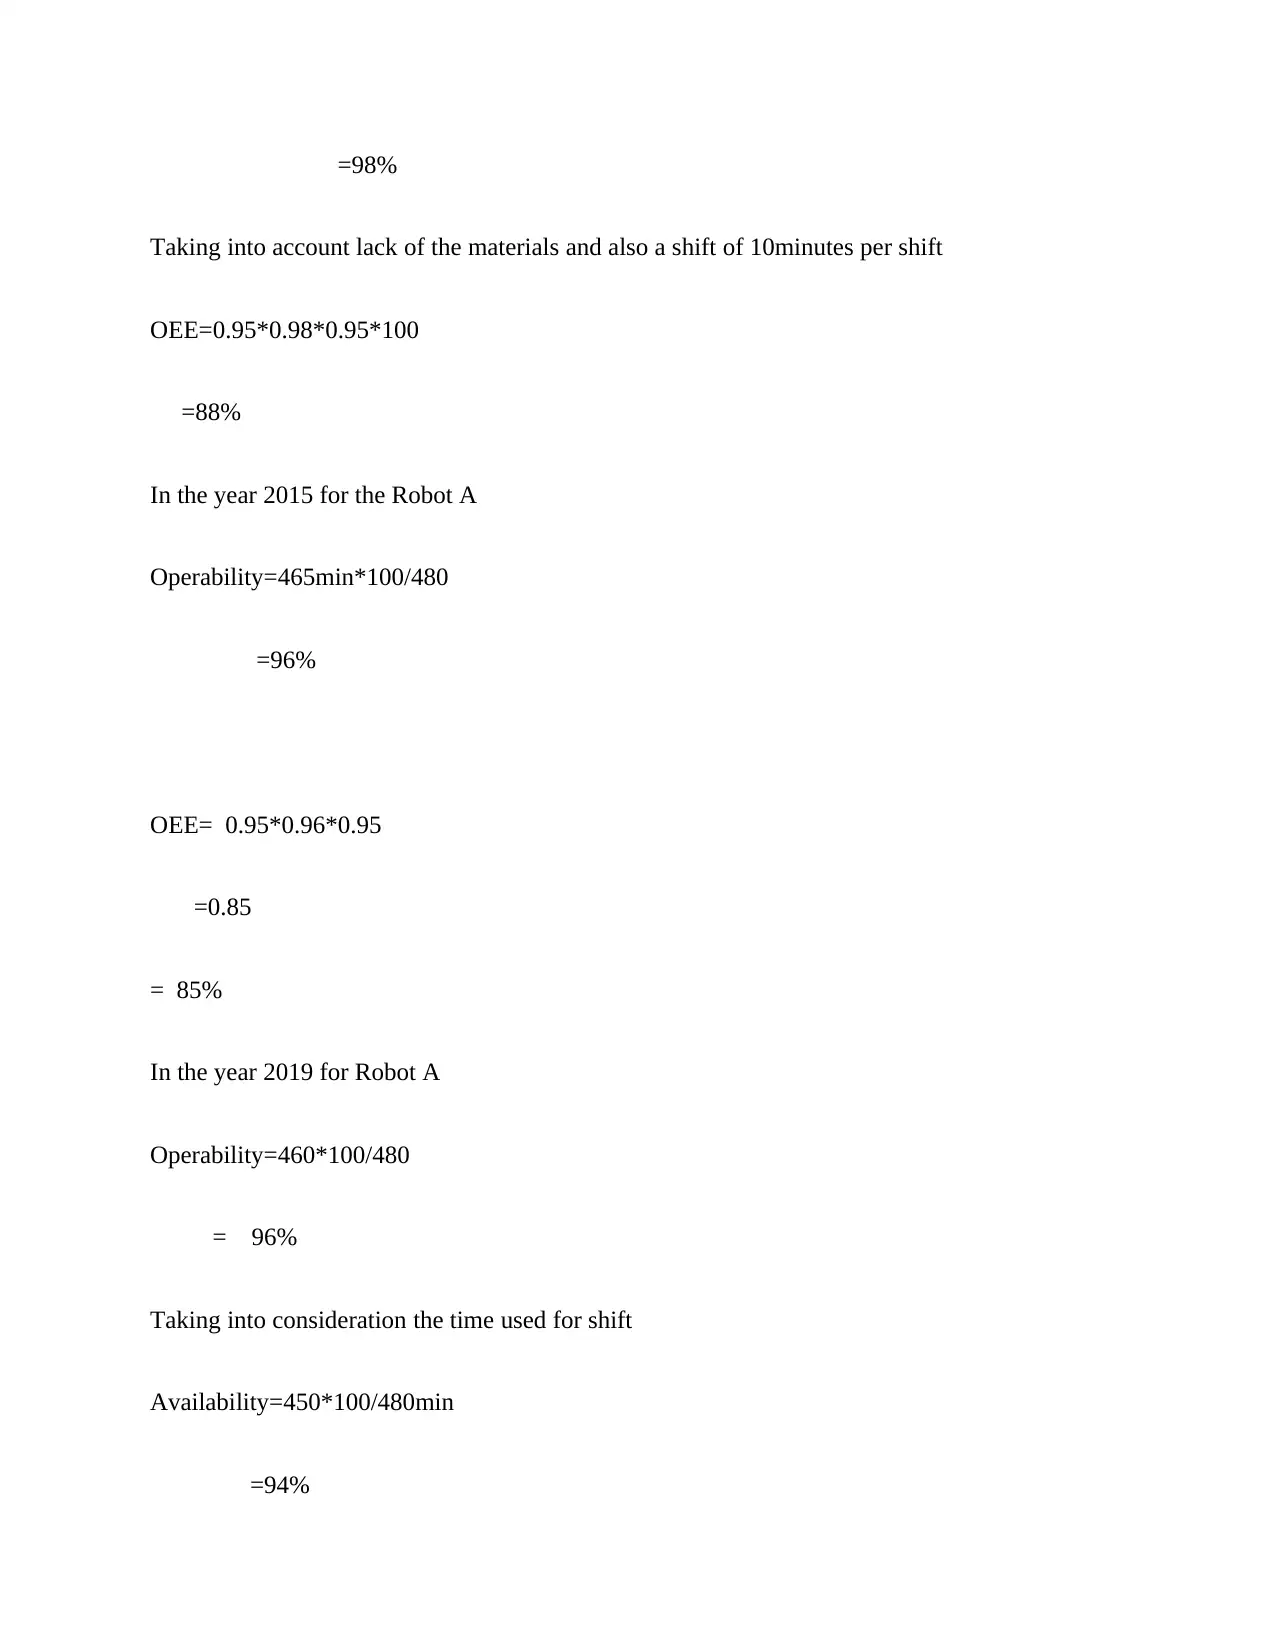
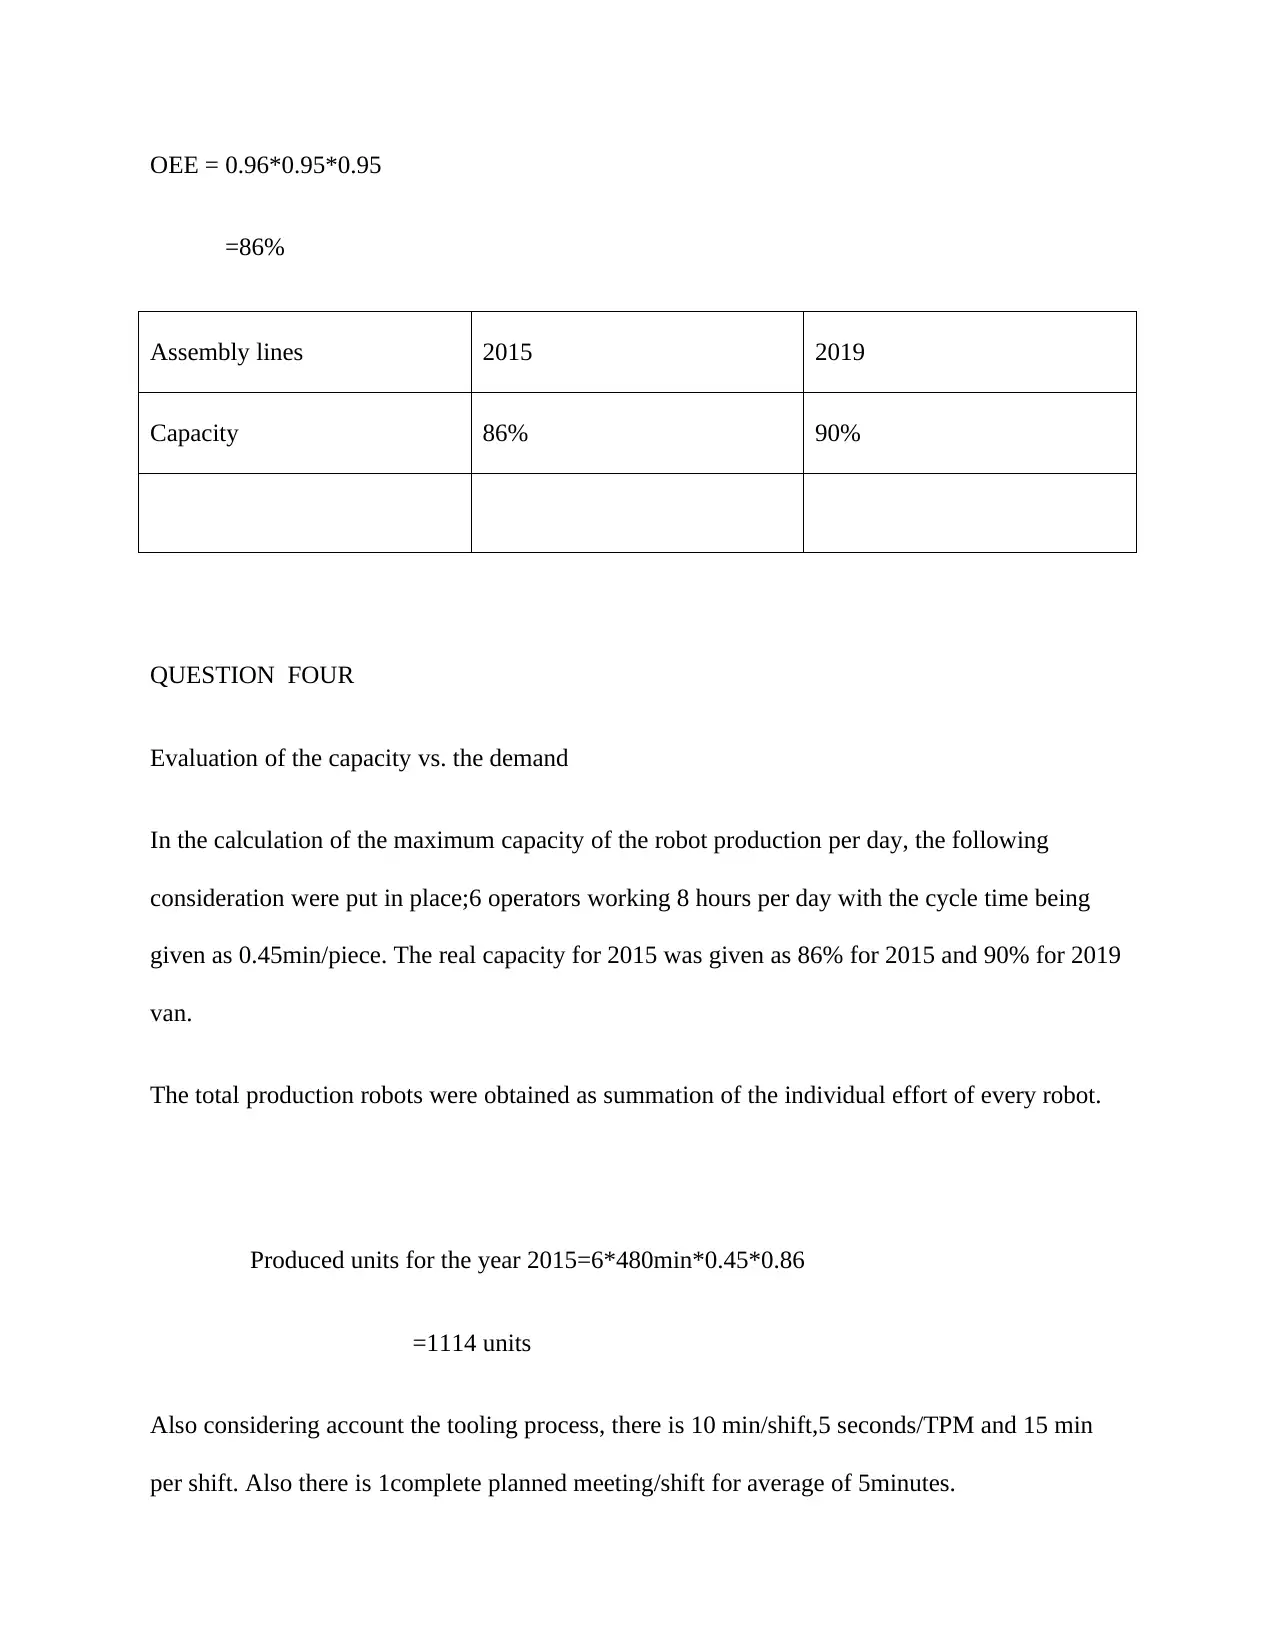
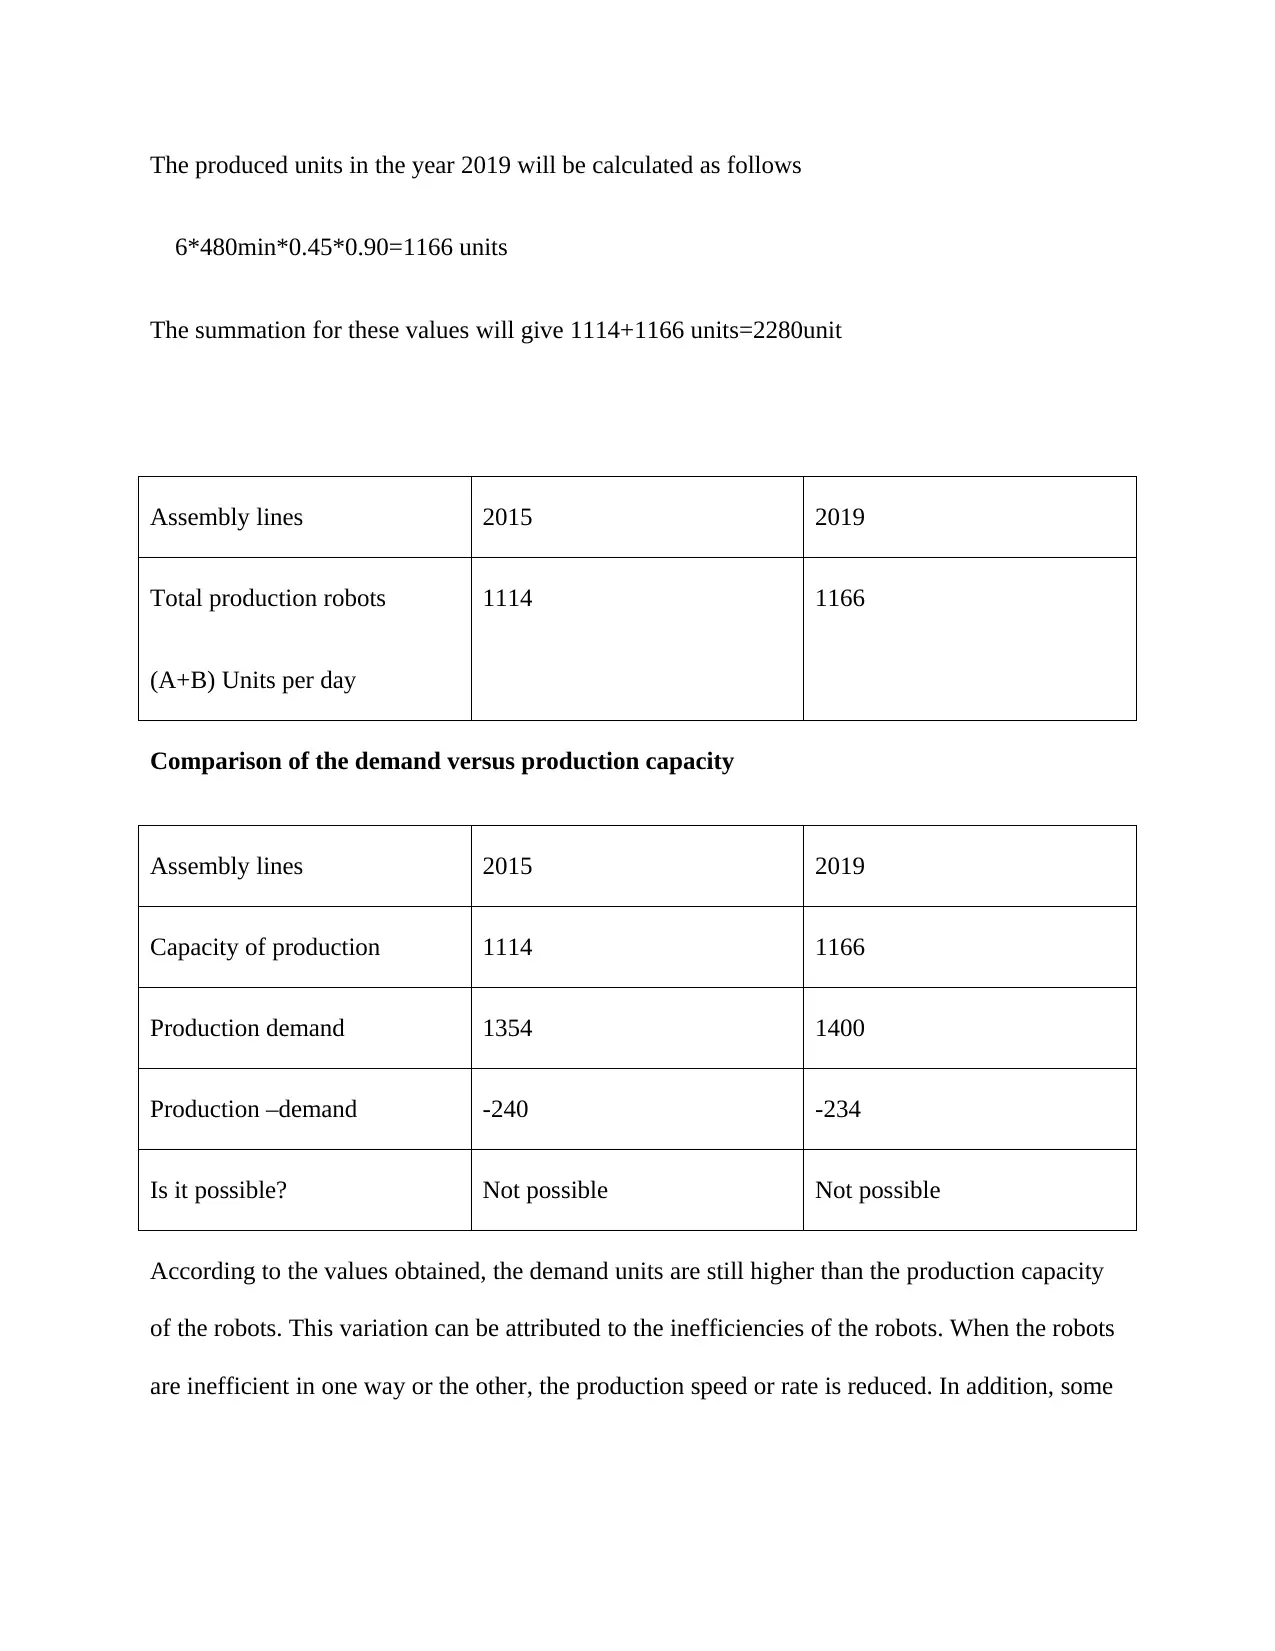
This case study analyzes the development of a new Lego robot plant, focusing on capacity, demand, and efficiency. It involves calculating cycle times, production volumes, and real capacity using data from 2015 and 2019. The study evaluates the plant's operability, availability, and overall equipment effectiveness (OEE). The analysis compares the production capacity with customer demand, revealing potential shortfalls and suggesting improvements in robot efficiency and raw material reliability to meet market requirements. The study concludes that while the robot system demonstrates interoperability, variations in cycle times and inefficiencies impact overall production, necessitating optimized processes and reliable resources.
Document Page
MASTERS IN LOGISTICS
By Name
Course
Instructor
Institution
Location
Date
tabler-icon-diamond-filled.svg

Paraphrase This Document

Need a fresh take? Get an instant paraphrase of this document with our AI Paraphraser
Document Page
EXECUTIVE SUMMARY
In the world of today, robots have excelled in performing tasks that are preprogrammed. These robots
work very well in the environment that is properly controlled with objects that are well defined. It
however important to note that those robots cannot cope perfectly with the complexities of the real world
situations. Some of these real problems are very complicated that they cannot be summarized into a set of
specifications. The use of sensors has greatly improved the performance of the robots and this has aided
in the connection or passing of information from one robot to another. There has been improvement in the
poor knowledge of robots. This improvement in the knowledge will allow tomorrows robots to identify
objects properly, improved actions over time in specific designs.
INTRODUCTION
The robots of today are basically not capable of understanding the environments that are not structured.
The available systems rely on the specifications that are highlighted. This specification will provide the
guidance until the robot cope with the task. The program to each response is done in advance .In the
execution of this particular programmed task, the robot will have to rely on the feedback mechanism to
have continuation of the operation. The robot will try to make the necessary adjustment. The major
disadvantage of this operation is that the next time a similar opera ration is required, the starting point has
to be the same (Zwilling, Niemueller & Lakemeyer 2014 ).
The ability of the robot to sense and act appropriately can be enhanced through global
memorization.However,there has been lack of these crucial parameters and this actually hinders the
process. This approach experiences several limitations since the real world is known to be too
complicated. The unpredictable nature of the real life problems further worsens the situation. The
instructions that have always been laid out to guide the robots are characterized by gaps, conflicts and
even ambiquity.The growth of the common cheap sensors has led to exponential growth of sensors and
this has led to problems in extracting meaning and purpose from some of these sensors. Despite these
Document Page
changes, robots have improved the capacity of production in the manufacturing industries especially in
the cases where human beings cannot assist. In addition, there have been improved safety measures
through utility of the robots( Jeon & Lee 2016).
MAIN OBJECTIVE
To build a plant robot “LEGO”
Specific Objectives
Calculation of cycle time
Calculation of the production volume
Calculation of the real capacity
LITERATURE REVIEW
Each individual robot collects data using its sensors. From this particular data, the objects are detected
and then labeled. These measurements however are very uncertain owing to the fact that there is
measurement noise. These kinds of data must be associated with the real world objects. The real world
parameters are then tracked as a function of time. The set of the tracked and static data object constitutes
the local world model that is utilized by the robot itself( Niemueller et al.2015).
The system will need to interpret the task that is to be executed and also combine this information with
the data collected from the environment. The objects and action are the affordances in this case and it is
received through 3D sensing. An essential ability of the robot to create such recipes is basically to
recognize the kind of action that is required. In this case there are two robots whose A and B that are used
to perform very specific tasks. This is rather a complex task. These robots use the knowledge of certain
sequences and actions to solve these specific problems( Cardarelli et al.2014).
Document Page
METHODS AND DISCUSSION
QUESTION ONE
Robot A/B TIME
FREQUENCY UNITARY SUBTOTAL TOTAL PROCESSES
1XPick up
piece 2x2
1 1 1 8,5 1 process
1 operation
X1 Displace
piece to
position
1 2 2
1XPick up
piece 2X4
1 1.5 1.5
1X Displace
piece to
position
2 2 4
1X
Assembling
piece Lego
2 1 2
1X pick up
piece 2X2
1 1 1
1XDisplace
piece to
position
1 1 1
1XAssembling
piece Lego
2 1 2 4 1 process
1 operation
1X Pick up
eyes adhesive
2 1 2
1XDisplace
eyes to
position
1 2 2 3 1process
1 operation
1XAssembling
eyes
2 1 2 5 1process
1operation
1X Pick up
pallet
0.25 1 0.25
1XDisplace
pallet to
position
2 1 2
1XPick up
packing case
1 1 1
1XDisplace
packing case to
position
2 2
4
1XOpen and
prepare case
2 2 4
1XPut the case
on the pallet
1 1 1
1XAssembling 1 2 2 12.25 1process
tabler-icon-diamond-filled.svg

Paraphrase This Document

Need a fresh take? Get an instant paraphrase of this document with our AI Paraphraser
Document Page
final case 1operation
1X Print and
apply the
finish product
label on the
pallet
2 1 2
1XMove the
finish product
pallet to
warehouse
1 2 2
1XIntroduce
the pallet into
the data base
2 4 8 10 1 process
1 operation
Total Cycle
time
42.75 Complete
operation.
Calculation of the cycle time in minutes
ROBOT A
60s=1min
42.75s=?
=42.75x1/60
=0.7125 minutes
ROBOT B
60 seconds=1minute
42.25 s=?
=42,25X1/60
=o.70416minutes
Document Page
From the obtained results it is obvious that the cycle time for each and every robot is different.
This difference can be attributed to the fact that different operation requires different length of
time. Although the robots may be considered identical, they have variations in terms of the
efficiencies (Karabegović et al.2015).
QUESTION TWO
Calculation of the production volume and tack time
Cycle time refers to the total time elapsed between when a customer places the requirement or
the order in this case and the time he/she receives it.The cycle time expresses the total manual
work that is involved in the procedure or just the process itself (Niemueller et al 2016).
The best calculation method is done by using the available minutes for the production/required
production units.
We therefore start with 8 hours;
8 hours X60 minutes=480 total minutes
Also there is a 10 minute start-up process that is usually known to be present in the morning.
During the day. There are two 10 minutes breaks. The shut –down process consumes 5 minutes.
Also there is 15 minutes nonproductive time for other shifts.Collectively,the nonproductive time
is 40 minutes.
The productive time is obtained by subtracting the nonproductive time from the available
minutes (Beinschob & Reinke 2014).
Document Page
According to the demands of the customer, the available working days are 220 for every year.
This is tied to production without fluctuation throughout the year. The month of vacation of these
customers perfectly match in between. The expectation is that delivery is done on a daily basis to
all the clients. The delivered products are grouped as A and B
PRODUCT CYCLE
TIME(MN)
CUSTOMER 2015 2019 2015 2019
ROBOTA HONDA 100.00 150.00 100.00 150.OO
ROBOTB SUSUKI 50.00 70.00 50.00 70.00
TOTAL 150.00 220.00 150.00 220.00
Calculation of the tack time for the robots A in the year 2015
Tack time(Robot A-2015) =480min/day
----------------------- = 106 min/piece
100.00 pieces/220 days
Tack time(Robot B-2015) =( 480min/day)/50/220 days
= 2112 min/piece.
Tack time(Robot A-2019) =(480min/day)/150/220 days
=704 min/piece.
Tack time (RobotB-2019)=(480min/day)/70/220 days
=1509min/piece.
Table: Tack time
Track time in Minutes
tabler-icon-diamond-filled.svg

Paraphrase This Document

Need a fresh take? Get an instant paraphrase of this document with our AI Paraphraser
Document Page
Product 2015 2019
ROBOT A 106 704
ROBOT B 2112 1509
QUESTION 3:
CALCULATION OF THE REAL CAPACITY OF THE PLANT
Operability=450min*100/480min
=94%
Taking into account the tooling process, there is 10 min/shift,5 seconds/TPM and 15 min per
shift. Also there is 1c planned meeting/shift for average of 5minutes.
AVAILABILITY= 470*100/480 minutes
=98%
Taking into account lack of the materials and also a shift of 10minutes per shift
OEE=0.95*0.98*0.95*100
=88%
In the year 2015 for the Robot A
Operability=465min*100/480
=96%
Document Page
OEE= 0.95*0.96*0.95
=0.85
= 85%
In the year 2019 for Robot A
Operability=455*100/480
= 95%
Taking into consideration the time used for shift
Availability=475*100/480min
=99%
OEE = 0.99*0.95*0.95
=89%
For the year 2019
Operability=450min*100/480min
=94%
Taking into account the tooling process, there is 10 min/shift,5 seconds/TPM and 15 min per
shift. Also there is 1c planned meeting/shift for average of 5minutes.
AVAILABILITY= 470*100/480 minutes
Document Page
=98%
Taking into account lack of the materials and also a shift of 10minutes per shift
OEE=0.95*0.98*0.95*100
=88%
In the year 2015 for the Robot A
Operability=465min*100/480
=96%
OEE= 0.95*0.96*0.95
=0.85
= 85%
In the year 2019 for Robot A
Operability=460*100/480
= 96%
Taking into consideration the time used for shift
Availability=450*100/480min
=94%
tabler-icon-diamond-filled.svg

Paraphrase This Document

Need a fresh take? Get an instant paraphrase of this document with our AI Paraphraser
Document Page
OEE = 0.96*0.95*0.95
=86%
Assembly lines 2015 2019
Capacity 86% 90%
QUESTION FOUR
Evaluation of the capacity vs. the demand
In the calculation of the maximum capacity of the robot production per day, the following
consideration were put in place;6 operators working 8 hours per day with the cycle time being
given as 0.45min/piece. The real capacity for 2015 was given as 86% for 2015 and 90% for 2019
van.
The total production robots were obtained as summation of the individual effort of every robot.
Produced units for the year 2015=6*480min*0.45*0.86
=1114 units
Also considering account the tooling process, there is 10 min/shift,5 seconds/TPM and 15 min
per shift. Also there is 1complete planned meeting/shift for average of 5minutes.
Document Page
The produced units in the year 2019 will be calculated as follows
6*480min*0.45*0.90=1166 units
The summation for these values will give 1114+1166 units=2280unit
Assembly lines 2015 2019
Total production robots
(A+B) Units per day
1114 1166
Comparison of the demand versus production capacity
Assembly lines 2015 2019
Capacity of production 1114 1166
Production demand 1354 1400
Production –demand -240 -234
Is it possible? Not possible Not possible
According to the values obtained, the demand units are still higher than the production capacity
of the robots. This variation can be attributed to the inefficiencies of the robots. When the robots
are inefficient in one way or the other, the production speed or rate is reduced. In addition, some
chevron_up_icon
1 out of 15
circle_padding
hide_on_mobile
zoom_out_icon
[object Object]