BX2174: Leisure Shopping Report - Economic Impact and Gender Analysis
VerifiedAdded on 2023/01/19
|25
|6084
|79
Report
AI Summary
This report presents a comprehensive analysis of leisure shopping, investigating its economic impact on village centers and the influence of gender on shopping habits. The research employed correlational and descriptive designs to examine the relationship between the mean number of hours spent in leisure shopping by males and females and to assess the economic effects. Key findings include a significant difference in shopping duration between genders and a positive economic impact on village centers. The study utilized interviews, questionnaires, and surveys for data collection, with a focus on quantitative and qualitative data. The report also reviews relevant literature on leisure shopping, including the importance of shopping villages, shop features, and customer satisfaction. The methodology includes a discussion of the research designs, data collection methods, and sampling procedures. The report concludes with recommendations and a critical review of leisure shopping, emphasizing the importance of understanding consumer behavior and its economic implications.

Leisure shopping
Paraphrase This Document
Need a fresh take? Get an instant paraphrase of this document with our AI Paraphraser
Executive summary
The purpose of this research was to answer the following two questions; how do the mean
number of hours spent in a day compare by gender of the participants? And is there economic
impact of leisure shopping on village centers? The methodology that was employed in this
research was correlational and descriptive research designs which helped in checking for the
relationship between variables and also obtaining the frequencies of the data. The results from
the research were as follows;
It was then found from the results that there was mean difference between the number of
hours spent by male leisure shopping customers and female leisure shopping customers in
a day.
Also, it was found that leisure shopping had economic impact on the shops in the village
centers where people visited and leisure shopping took place.
From the results therefore, it was concluded leisure activities were important and had economic
impact on the shops in the village centers and that females who engaged in leisure shopping
tended to take much longer time than their male counterparts as it was evident from the
hypothesis tested in study.
Introduction and research questions
Leisure is the time when one is free from their daily duties such as work and so on. It is the time
when people tend to spend their free time indulging in one among their entertaining activities
Sonnentag, S. (2012); Ding, D., & Gebel, K. (2012). Leisure is therefore some form of
experience that comes in people’s choices in relation to necessity activities. As a result, being
that people are free from their work, they may tend to travel and pay visit to new places. New
places visited by the travelers (tourists) are sometimes sophisticated with traditional products
which are not common in the tourists’ places of origin. Tourists then engage in buying things
from locals in their leisure walk which is then results to leisure shopping Rabbiosi, C. (2015);
García, J. A., & Ruiz, B. (2015).
On the other hand, in the current world, people are busy and have tight schedules in most of the
days of the week and month which then make people to lack time to go out for shopping the best
of the products they desire. On that note therefore, majority of the people make good use of any
slightest opportunity that come their way in terms of free time and utilize this time to do various
activities such as spending time with their loved ones at home, engaging in some of the leisure
activities of their interests and also doing leisure shopping. Leisure shopping is therefore
acquiring of goods and services from the shopping centers and shopping malls using money or
other valuables as medium of exchange Mokhtarian, P. L., Salomon, I., & Singer, M. E. (2015);
Rahman, N. A., Shamsuddin, S., & Ghani, I. (2015). Some people prefer acquiring goods from
the shopping malls by themselves hence use leisure time to visit the places and select items of
their choice.
⊘ This is a preview!⊘
Do you want full access?
Subscribe today to unlock all pages.
Trusted by 1+ million students worldwide
The way things used to be done in the world is rapidly changing due to the advancement in
technology. Since the emergence of technology, ways of doing things have become easier than
ever ranging from communication to trading. Nowadays technology have made it easy for the
businesses to sell their products to their prospective customers in the wider range across the
globe through the internet He, W., & Da Xu, L. (2014). This has as well enabled the customers to
be able to acquire goods from their homes without the need to physically travel to the market
Pantano, E. (Ed.). (2015). Due to varied preferences from one individual to another, some people
use their leisure time to do online shopping directly either from the producers or suppliers of
their choices. Goods will then be shipped to their homes or the nearby places where they can
easily collect them.
Research questions
This research seek to achieve the goals of determining the significant difference in the mean
number of hours spent by male and female in leisure shopping and also to determine the impact
of leisure shopping in the shops in village centers. The questions derived from the
aforementioned objectives were as follows:
1. How do the mean number of hours spent in a day compare by gender of the participants?
2. Is there economic impact of leisure shopping on village centers?
Paraphrase This Document
Need a fresh take? Get an instant paraphrase of this document with our AI Paraphraser
Literature review
Leisure shopping is explained as shopping by customers during free time, this is according to
Rajagopal (2017). Shopper often visit retail outlets and shopping malls. Being that people have
been busy with their schedule, leisure shopping have become source of entertainment. Leisure is
also seen happening at regular intervals such as weekly, fortnight or on holidays Martin and
Mason (2016). Customers often do this to have fun at their free time and in environment of their
choice. Display of products in the malls are in such a way that they refresh the emotions of the
customers. People are able to meet during leisure shopping at the shopping malls and mix up
freely in a way that help the stay away from their stressful life thus help them balance their busy
life in the comfortable environment.
According to Ahmad (2014), people get to new different malls to enjoy themselves. The
shopping centers and malls act as the attraction site that make shoppers entertained and engage in
other recreational activities. Tourism is determined to be highly developing around the world
Berfenfeldt (2011). Because of the design and display in the shopping malls, the shopping
centers act as better travel destination. On that note therefore, the government agencies across the
states in the world struggle to develop infrastructure that could support safe movement of the
tourists as they visit different locations in their countries.
Leisure shopping comes with some of the importance out of which Dutot (2013) stated that
leisure shopping plays a huge role in travelling decision making. It has been the norm of the
tourists to travel to different places where they can enjoy themselves and have easy access to
products of their choice. Leisure shopping have therefore had a great impact in generating
business opportunities for the locals of the visited places. In survey carried out by Haque et al
(2009), they found out that customers’ motivation would fully be accomplished in the shopping
centers. Sightseeing destinations attract travelers and also promote leisure shopping, this is
according to Martin & Mason (2006). Shopping villages being that they are visited by the
tourists, they help in earning foreign exchange thus promoting business activities and also
providing employment opportunities.
Designs and features of the shop are of great importance in regard to leisure shopping Parihar
(2012). The shop should be located in clean environment with the clear display of products. As
well, there should be good communication with the customers and the variety of products that
the customers can choose from. Having these features attract the customers’ interest who would
then be encouraged to keep shopping from the place and also relax. On regular basis, the shop
features are supposed to be updated to match the dynamic changes in the world.
Research study methodology
Data is always fundamental in supporting the basis and claims of a research (Harriss & Atkinson,
2015; Abbasi, Sarker & Chiang, 2016). In that regard therefore, a number of factors play major
role in the determination and choice of which research method to use, for instance, the type of
data that the researcher intend to collect Burke et al (2013). In this case, the research was aimed
at collecting quantitative and qualitative data and therefore the researcher employed correlational
and descriptive research designs.
Correlational research design is useful in the studies to inspect the statistical relationship that
exist between variables in the collected data Zechmeister, Zechmeister & Shaughnessy, 2006;
Curtis, Comiskey & Dempsey, 2016). This design is non-experimental and the researchers use it
to assess the correlation of variables in the collected data. This research design was opted for by
⊘ This is a preview!⊘
Do you want full access?
Subscribe today to unlock all pages.
Trusted by 1+ million students worldwide
the researcher in order to check for the relationship that exist between the mean number of hours
spent in leisure shopping by male and female leisure shopping customers. Understanding the
relationship between variables in the dataset is important since it help the researcher to
understand the effect of each variable in the end result as acquired from the data. In this research,
researcher seeks to check for the relationship that exist between the mean numbers of hours spent
in a day by gender of the shoppers.
Descriptive research design gives the description of the characteristics of a population that is
under study Burns, A. C., Bush, R. F., & Sinha, N. (2014); Corbin, J., Strauss, A., & Strauss, A.
L. (2014). This design was opted for by the researcher in order to enable the researcher
understand the influence of the factors on leisure shopping. As well, this design was helpful in
that it helps the researcher to determine some of the characteristics such as the frequency of visit
to a place that could lead to probable leisure shopping while on trip to different places.
Descriptive statistical analysis was then applied to help present the data on graphs and tables for
easy understanding and interpretation and bring strong insight of the data and findings.
Data collection methods
Due to the quantitative nature of data that was collected in this research study, some of the data
collection methods that were employed by the researcher were interviews, questionnaire and
surveys. Interviews were incorporated to help in deeper understanding of the collected data since
it allows for open ended responses Prudon, P. (2015); McCusker, K., & Gunaydin, S. (2015).
The researcher developed structured questions that acted as the guidelines questions in the
interview process and noted down the responses in return which would then be used in
comparison with the data that was collected through questionnaires and surveys.
Paraphrase This Document
Need a fresh take? Get an instant paraphrase of this document with our AI Paraphraser
Questionnaire is one of the data collection methods that is popularly used by the researchers to
attain data of their interest. Responses from this type of data collection method is quantitative
and thus can be analyzed using quantitative data analysis techniques. Questionnaires in this study
were structured as guided by the research questions. A set of questions were structured in the
questionnaire consisting of both closed ended and open ended questions where the participants
were to choose from the multiple choices offered by the researcher. This form of questions
structure makes it easier for the researcher to code the data and thus making the entire data
preparation process time effective. Open ended questions enable the respondents to freely
express their feelings towards a particular question Popping, R. (2015); Song, Y., Son, Y. J., &
Oh, D. (2015). When the researcher administer the entire data collection process it makes it
easier for the respondents to fill in the questionnaire as in case of unclear questions the
researcher is there to offer clarity and thus bring deeper understanding of the questions which
then lead to collection of relevant data that suit the interest of the subject matter unlike when the
questionnaires were sent to the respondents in the absence of the researcher.
The questions in the questionnaires were by all means made simple and easy to understand. This
was achieved by using simple sentence structure in the questions. By so doing, the response rate
of the respondents was increased making them to complete and hand over filled questionnaires
on time. The Likert scale was used in the questionnaire to ask for the attitude of the respondents
towards village performance as a result of leisure shopping. Sample procedure
After the designing of the questionnaires, they were all intended to be distributed to the
participants (leisure shopping customers) who were the group of interest. In the distribution of
the questionnaires to the respondents, the researcher applied the probabilistic sampling methods
with the intent of offering equal chances for the targeted group to take part in the data collection
process Denzin, N. K. (2017); Bain, L. (2017). . The researcher first identified the sites used by
the leisure shoppers and marked them as strata and then randomly selected the participants from
each stratum to participate in the data collection process. Stratified sampling methods was
applied by the researcher because there were different leisure shopping centers of interest to
different people and thus to covers a relatively large geographical location. Participant from each
stratum was believed to bear the same characteristics with other participants from other strata
and fully represented the targeted population. Random sampling method was applied in each
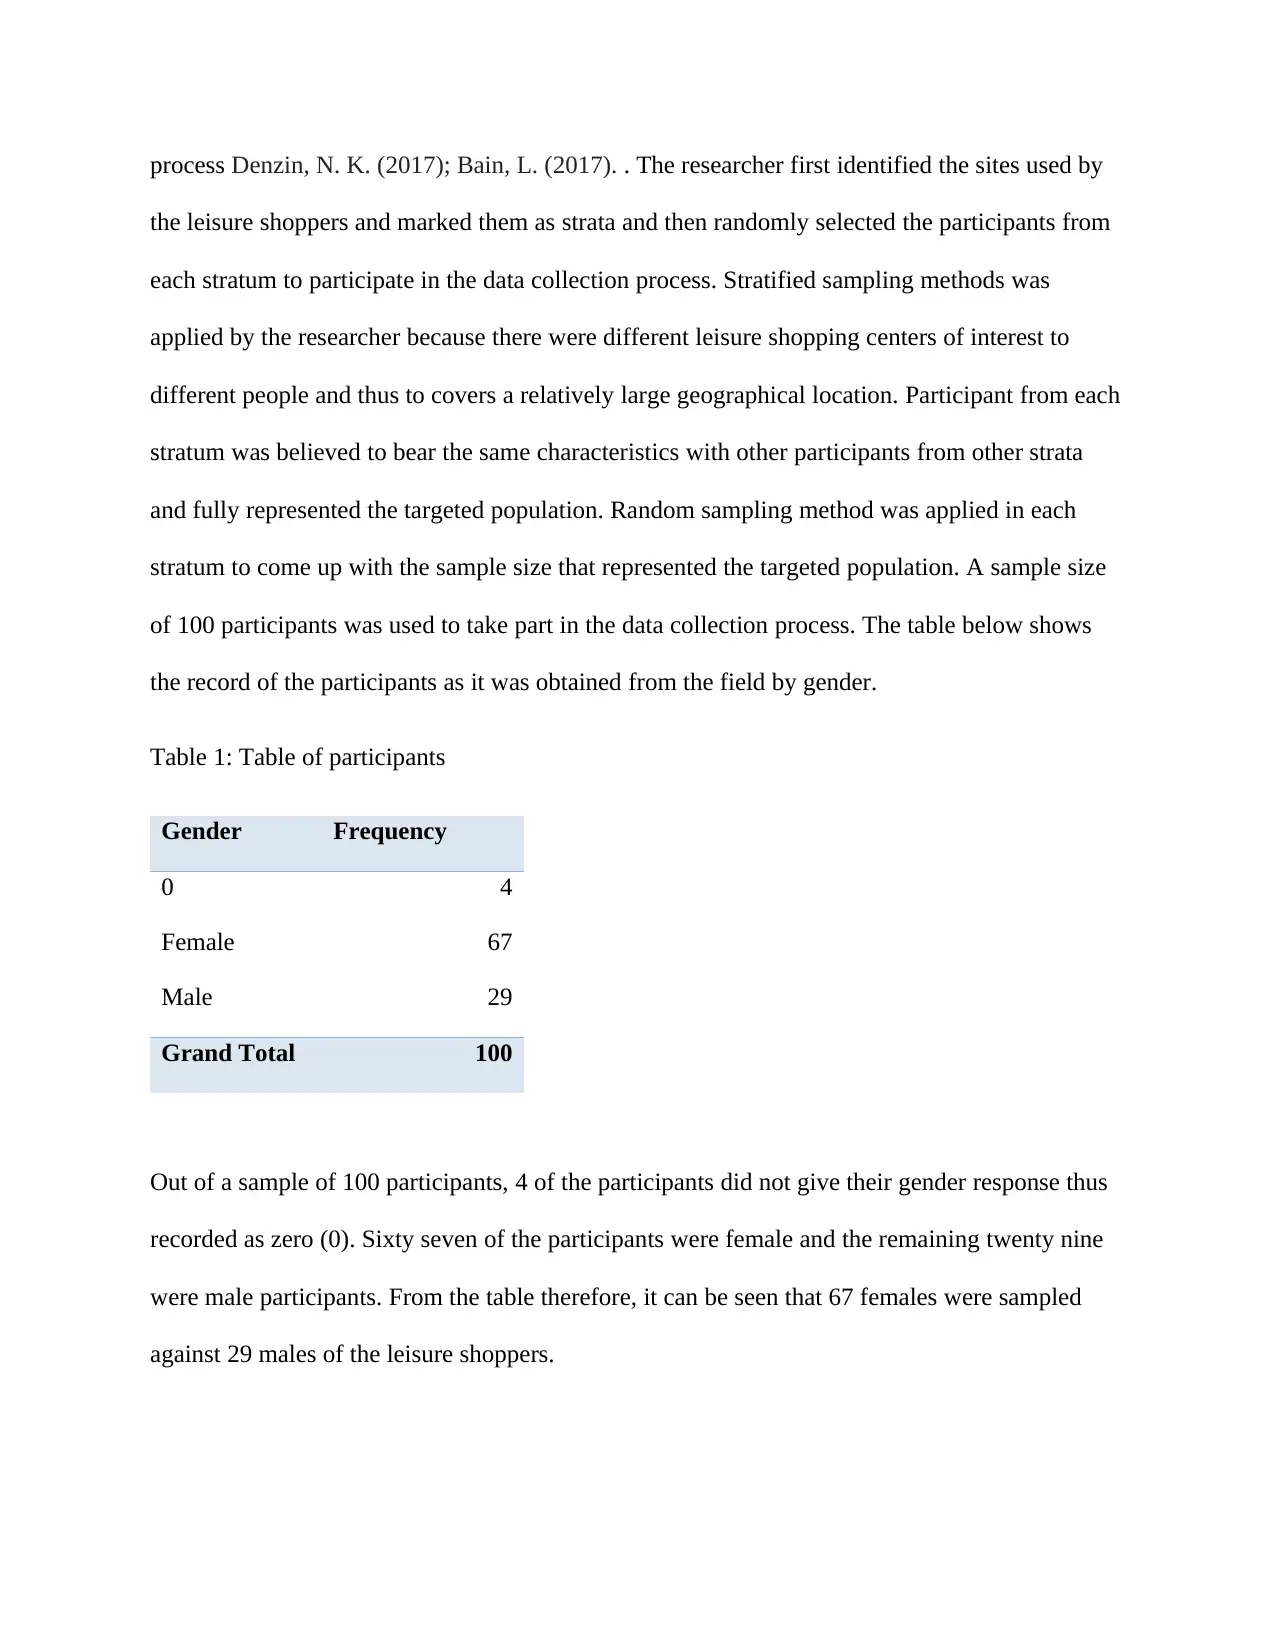
stratum to come up with the sample size that represented the targeted population. A sample size
of 100 participants was used to take part in the data collection process. The table below shows
the record of the participants as it was obtained from the field by gender.
Table 1: Table of participants
Gender Frequency
0 4
Female 67
Male 29
Grand Total 100
Out of a sample of 100 participants, 4 of the participants did not give their gender response thus
recorded as zero (0). Sixty seven of the participants were female and the remaining twenty nine
were male participants. From the table therefore, it can be seen that 67 females were sampled
against 29 males of the leisure shoppers.
the leisure shoppers and marked them as strata and then randomly selected the participants from
each stratum to participate in the data collection process. Stratified sampling methods was
applied by the researcher because there were different leisure shopping centers of interest to
different people and thus to covers a relatively large geographical location. Participant from each
stratum was believed to bear the same characteristics with other participants from other strata
and fully represented the targeted population. Random sampling method was applied in each
stratum to come up with the sample size that represented the targeted population. A sample size
of 100 participants was used to take part in the data collection process. The table below shows
the record of the participants as it was obtained from the field by gender.
Table 1: Table of participants
Gender Frequency
0 4
Female 67
Male 29
Grand Total 100
Out of a sample of 100 participants, 4 of the participants did not give their gender response thus
recorded as zero (0). Sixty seven of the participants were female and the remaining twenty nine
were male participants. From the table therefore, it can be seen that 67 females were sampled
against 29 males of the leisure shoppers.
⊘ This is a preview!⊘
Do you want full access?
Subscribe today to unlock all pages.
Trusted by 1+ million students worldwide
Results and discussion
Collated data were used in the research to generate the following results where the data was
categorized into demographic information and the objective data. Data was presented in tables
and graphs as below.
Demographic information
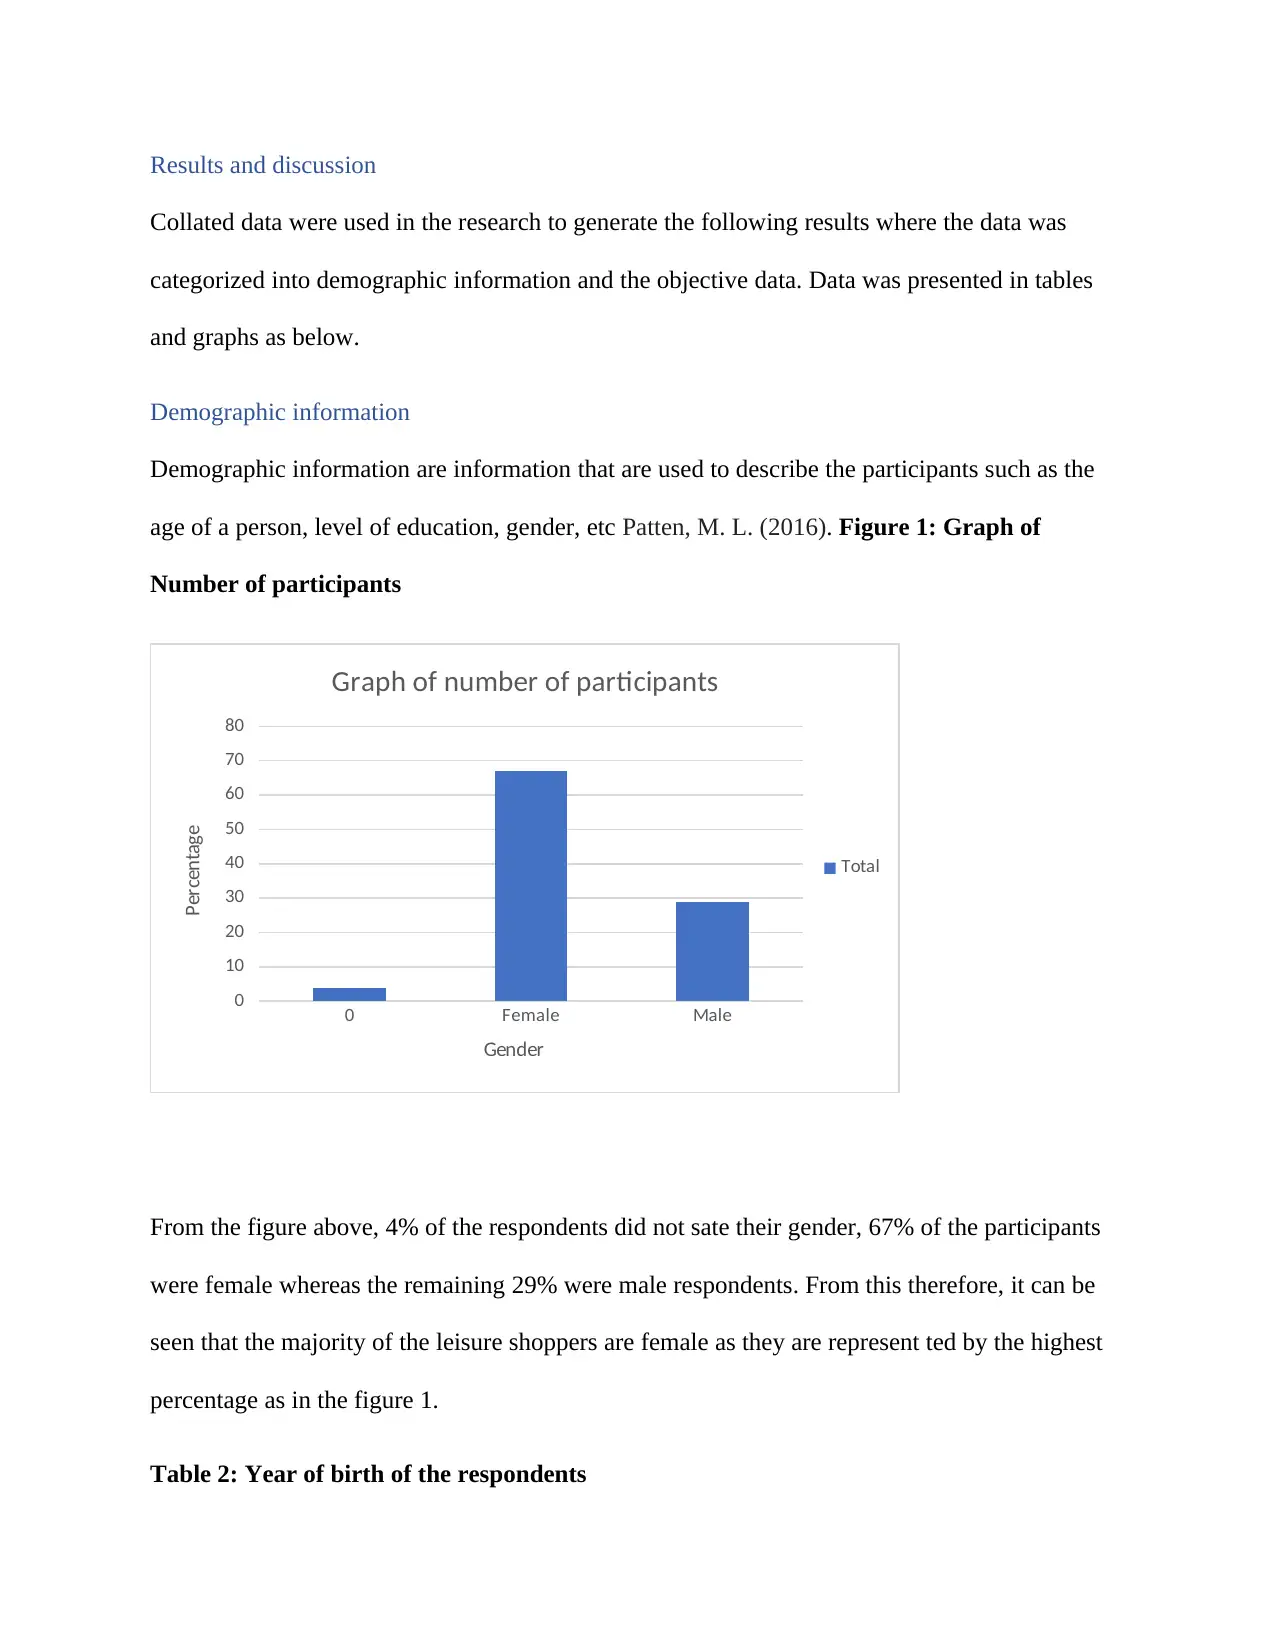
Demographic information are information that are used to describe the participants such as the
age of a person, level of education, gender, etc Patten, M. L. (2016). Figure 1: Graph of
Number of participants
0 Female Male
0
10
20
30
40
50
60
70
80
Graph of number of participants
Total
Gender
Percentage
From the figure above, 4% of the respondents did not sate their gender, 67% of the participants
were female whereas the remaining 29% were male respondents. From this therefore, it can be
seen that the majority of the leisure shoppers are female as they are represent ted by the highest
percentage as in the figure 1.
Table 2: Year of birth of the respondents
Collated data were used in the research to generate the following results where the data was
categorized into demographic information and the objective data. Data was presented in tables
and graphs as below.
Demographic information
Demographic information are information that are used to describe the participants such as the
age of a person, level of education, gender, etc Patten, M. L. (2016). Figure 1: Graph of
Number of participants
0 Female Male
0
10
20
30
40
50
60
70
80
Graph of number of participants
Total
Gender
Percentage
From the figure above, 4% of the respondents did not sate their gender, 67% of the participants
were female whereas the remaining 29% were male respondents. From this therefore, it can be
seen that the majority of the leisure shoppers are female as they are represent ted by the highest
percentage as in the figure 1.
Table 2: Year of birth of the respondents
Paraphrase This Document
Need a fresh take? Get an instant paraphrase of this document with our AI Paraphraser
Year of birth Frequency
0-9 6
1930-1939 6
1940-1949 14
1950-1959 19
1960-1969 13
1970-1979 19
1980-1989 19
1990-1999 4
Grand Total 100
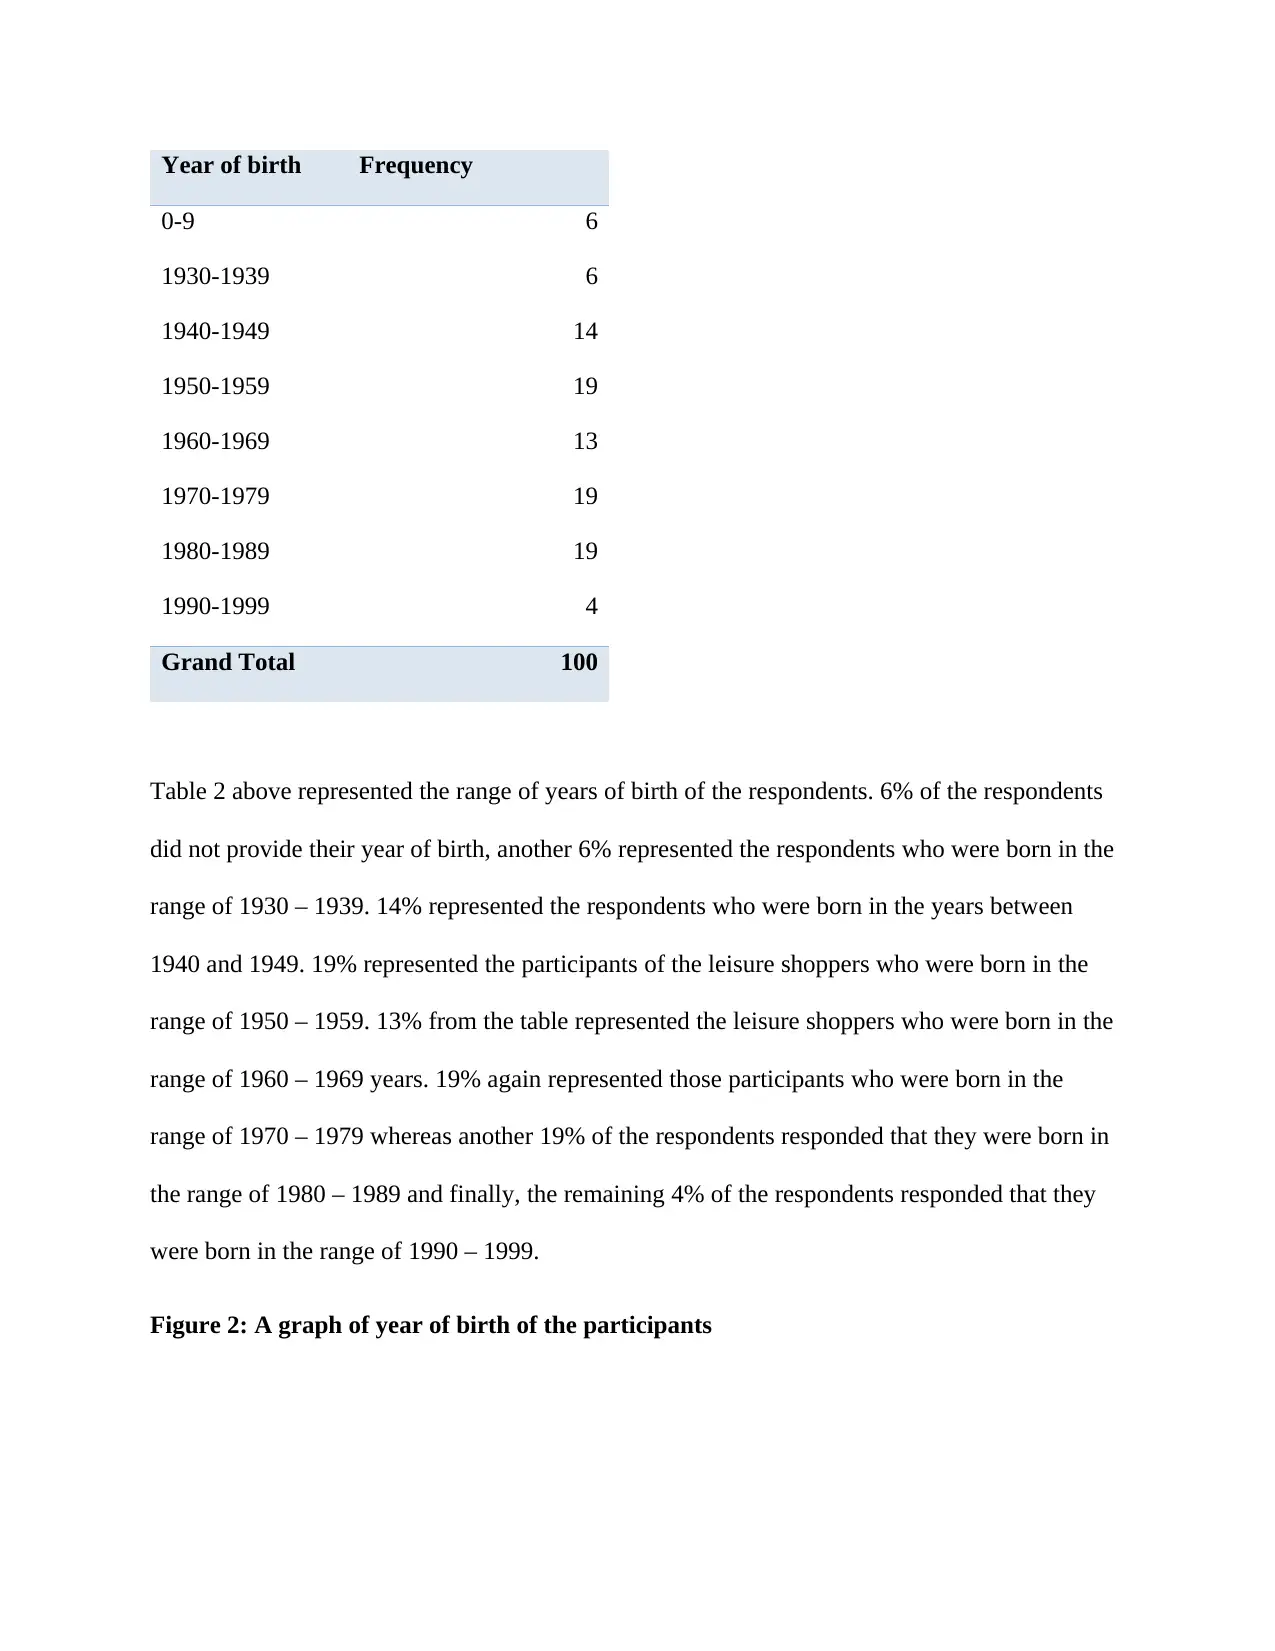
Table 2 above represented the range of years of birth of the respondents. 6% of the respondents
did not provide their year of birth, another 6% represented the respondents who were born in the
range of 1930 – 1939. 14% represented the respondents who were born in the years between
1940 and 1949. 19% represented the participants of the leisure shoppers who were born in the
range of 1950 – 1959. 13% from the table represented the leisure shoppers who were born in the
range of 1960 – 1969 years. 19% again represented those participants who were born in the
range of 1970 – 1979 whereas another 19% of the respondents responded that they were born in
the range of 1980 – 1989 and finally, the remaining 4% of the respondents responded that they
were born in the range of 1990 – 1999.
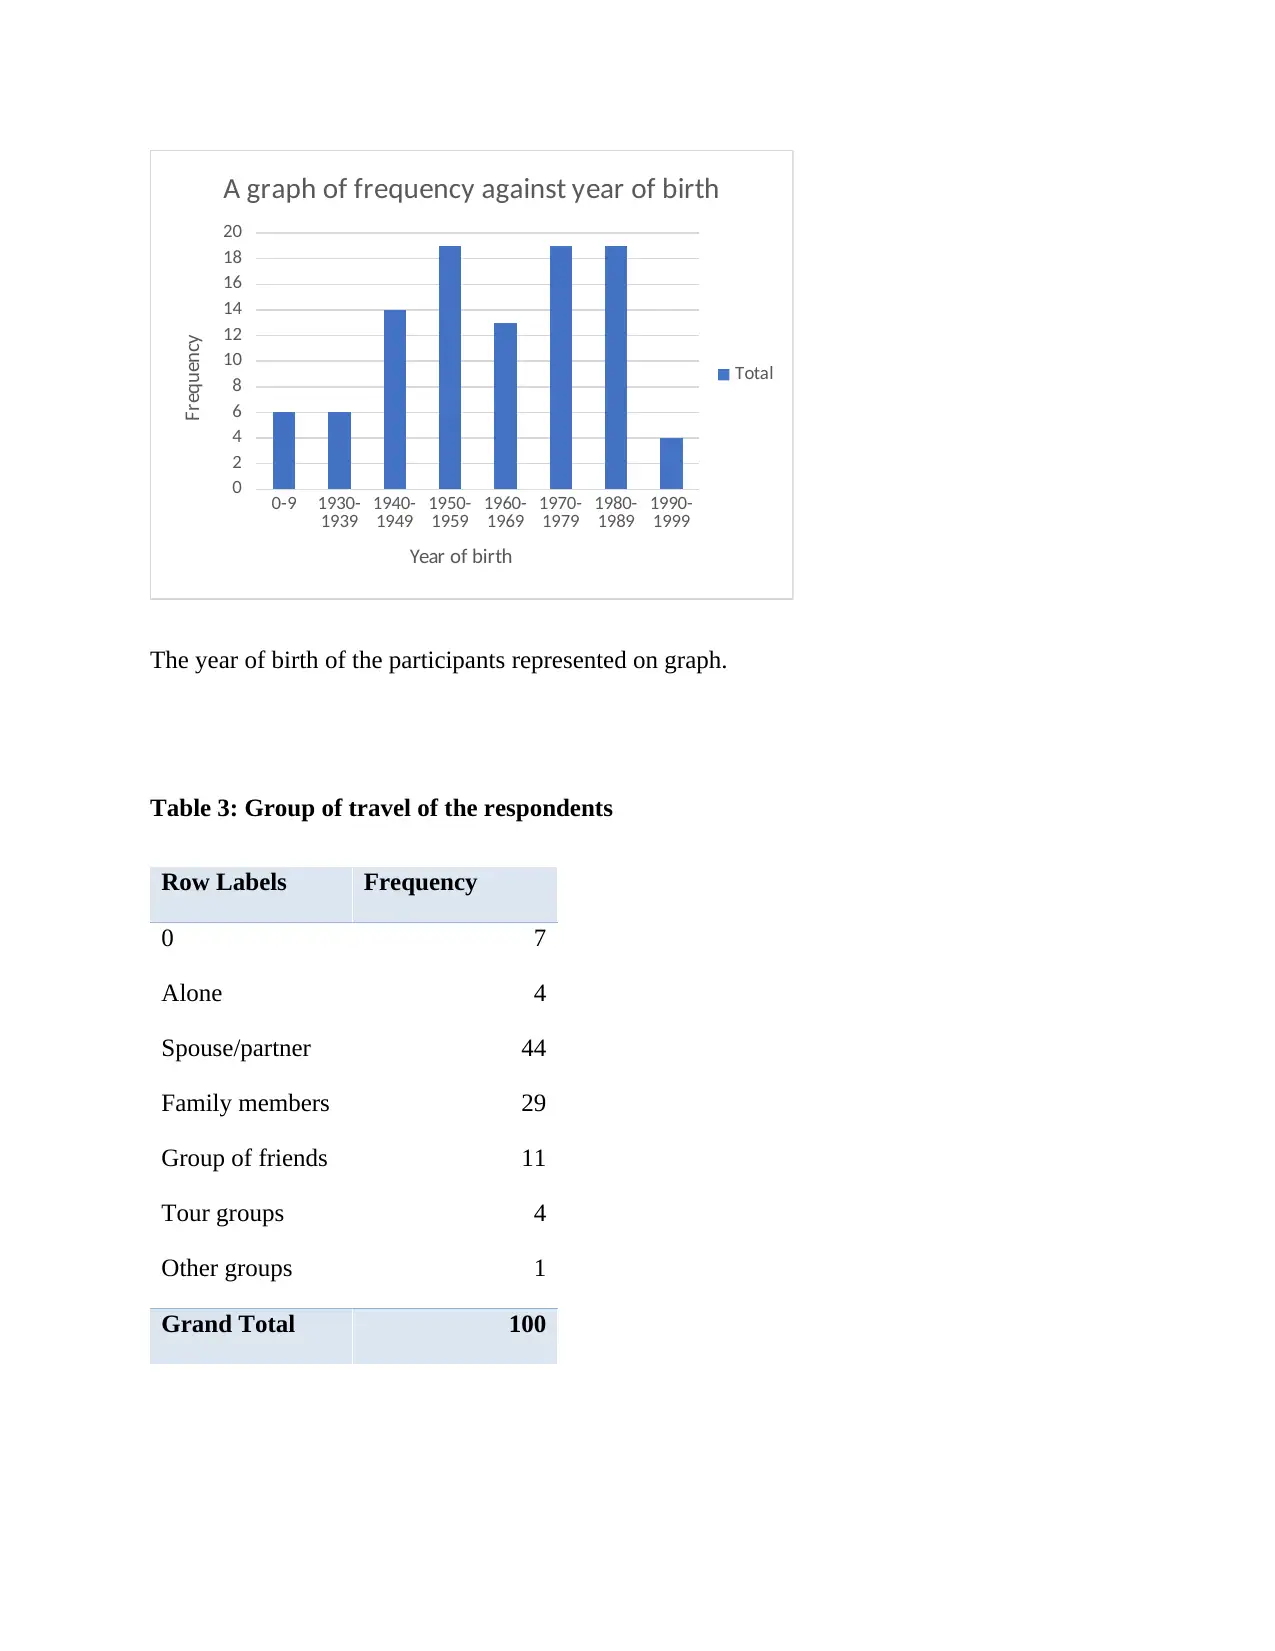
Figure 2: A graph of year of birth of the participants
0-9 6
1930-1939 6
1940-1949 14
1950-1959 19
1960-1969 13
1970-1979 19
1980-1989 19
1990-1999 4
Grand Total 100
Table 2 above represented the range of years of birth of the respondents. 6% of the respondents
did not provide their year of birth, another 6% represented the respondents who were born in the
range of 1930 – 1939. 14% represented the respondents who were born in the years between
1940 and 1949. 19% represented the participants of the leisure shoppers who were born in the
range of 1950 – 1959. 13% from the table represented the leisure shoppers who were born in the
range of 1960 – 1969 years. 19% again represented those participants who were born in the
range of 1970 – 1979 whereas another 19% of the respondents responded that they were born in
the range of 1980 – 1989 and finally, the remaining 4% of the respondents responded that they
were born in the range of 1990 – 1999.
Figure 2: A graph of year of birth of the participants
0-9 1930-
1939 1940-
1949 1950-
1959 1960-
1969 1970-
1979 1980-
1989 1990-
1999
0
2
4
6
8
10
12
14
16
18
20
A graph of frequency against year of birth
Total
Year of birth
Frequency
The year of birth of the participants represented on graph.
Table 3: Group of travel of the respondents
Row Labels Frequency
0 7
Alone 4
Spouse/partner 44
Family members 29
Group of friends 11
Tour groups 4
Other groups 1
Grand Total 100
⊘ This is a preview!⊘
Do you want full access?
Subscribe today to unlock all pages.
Trusted by 1+ million students worldwide
1 out of 25
Related Documents


Your All-in-One AI-Powered Toolkit for Academic Success.
+13062052269
info@desklib.com
Available 24*7 on WhatsApp / Email
![[object Object]](/_next/static/media/star-bottom.7253800d.svg)
Unlock your academic potential
Copyright © 2020–2026 A2Z Services. All Rights Reserved. Developed and managed by ZUCOL.