Financial Analysis of Lend Lease Group: 2015-2017 Performance
VerifiedAdded on 2021/05/27
|14
|3241
|20
Report
AI Summary
This report provides a comprehensive financial analysis of the Lend Lease Group for the years 2017, 2016, and 2015. The analysis focuses on the company's financial statements, including the balance sheet, income statement, statement of changes in owner’s equity, and cash flow statement. A detailed examination of the cash flow statement is presented, breaking down the operating, investing, and financing activities, with explanations for any significant changes. The report also covers the comprehensive income statement, clarifying the items included. Furthermore, the analysis includes a review of the company's income tax expenses, deferred tax liabilities, and any variations in these figures over the three-year period. Horizontal analysis is performed to compare the cash flows across the years, highlighting trends in cash receipts, payments, interest, dividends, and borrowing activities. The report also examines the components of other comprehensive income, categorizing them by items that may or may not be reclassified to the profit and loss account, and detailing the impact of fair value revaluation, hedging, and foreign currency translation.
RUNNING HEAD: CORPORATE ACCOUNTING
[Document title]
[Document title]
Paraphrase This Document
Need a fresh take? Get an instant paraphrase of this document with our AI Paraphraser
CORPORATE ACCOUNTING 1
Contents
LEND LEASE GROUP.............................................................................................................2
CASH FLOWS STATEMENT..................................................................................................2
(i)........................................................................................................................................2
(ii).......................................................................................................................................7
OTHER COMPREHENSIVE INCOME STATEMENT......................................................9
(iii) and (iv)........................................................................................................................9
(v).....................................................................................................................................10
ACCOUNTING FOR CORPORATE INCOME TAX........................................................10
(vi)....................................................................................................................................10
(vii)...................................................................................................................................11
(viii)..................................................................................................................................11
(ix)....................................................................................................................................12
(x).....................................................................................................................................12
(xi)....................................................................................................................................12
REFERENCES.....................................................................................................................13
CORPORATE ACCOUNTING 2
LEND LEASE GROUP
The Lend Lease Group is a leading property and infrastructure group which is based
in Sydney, Australia. The company was founded in 1973 by Dick Dusseldrop. The
company’s core objective is to create places which is best for the world. The company had
reported revenue of AUD 16,669.0 and the net profit was AUD 758.7 in 2017 (Lend Lease,
2017).
The purpose of this assignment is to perform complete analysis of Lend Lease Group
for past three years that is 2017, 2016 and 2015. The analysis is done from the statement of
financial (balance sheet, income statement, statement of changes in owner’s equity, cash flow
statement). The report includes cash flow statement analysis of three categories (operating,
investing and financing) with any changes in the figures and the reasons for such change.
Moreover, items covered under comprehensive income statement are completely explained.
The Company’s income tax expense, deferred tax / liabilities and any change in the numbers
from the past years are also commented.
CASH FLOWS STATEMENT
(i)
1. Cash flows from operating Activities
Cash receipts in the course of operations:
Cash receipts means the collection of money by the company from the
external parties such as customers, investors, bank etc. and it is recognised as
a rise to the cash account (Lend Lease, 2017; 2016). Thus in this case,
company has reported AUD 16254.6 million in 2017 financial year and AUD
16028.4 million in FY 2016. There was a rise in cash receipts in the course of
operations by AUD 226.4 million.
⊘ This is a preview!⊘
Do you want full access?
Subscribe today to unlock all pages.
Trusted by 1+ million students worldwide
CORPORATE ACCOUNTING 3
Cash payments in the course of operations:
Cash payments means the payment of money by the company for the purpose
of purchasing of inventories, payment made for operating expenses, payment
to employees and others etc. and it is recognised as a decrement to the cash
account. Thus in this case, company has reported AUD 15928.7 million in
2017 financial year and AUD 15154.9 million in FY 2016. There was a rise in
cash payments in the course of operations by AUD 773.8 million (Lend
Lease, 2017; 2016).
Interest received
Any interest received is recognised in cash flow statement only when the
interest income is converted to cash basis. The numbers are decreased when
there is increment in interest receivable or vice versa. In this case, AUD 9.9
million and AUD 12.8 million was reported in FY 2017 and 2016
respectively. This means that in current year interest has decreased by AUD
2.9 million (Lend Lease, 2017; 2016).
Interest Paid
Any decrease in interest payable are added or vice versa from accrual based
interest expenses in the cash from operations (Lend Lease, 2017; 2016). In
this case, company had reported AUD 120.4 million and AUD 134.8 million
was reported in FY 2017 and 2016 respectively. This means that in current
year interest paid has decreased by AUD 14.4 million.
Dividend received
Paraphrase This Document
Need a fresh take? Get an instant paraphrase of this document with our AI Paraphraser
CORPORATE ACCOUNTING 4
Any dividend received is recognised in cash from operations only when the
dividend income is converted to cash basis. The numbers are decreased when
there is increment in interest receivable or vice versa. In this case, AUD 75.4
million and AUD 90.0 million was reported in FY 2017 and 2016
respectively. This means that in current year interest has decreased by AUD
14.6 million (Lend Lease, 2017; 2016).
Income tax paid/received
Likewise, interest and operating expenses are adjusted in cash flow statement
the same adjustment is for income tax. In this case, any decrease in income
tax payable are added or vice versa from the income tax expenses shown in
Profit and loss statement. In this case, AUD 144.8 million is income tax paid
and AUD11.5 million is income tax received from operations was reported in
FY 2017 and 2016 respectively (Lend Lease, 2017; 2016).
Thus, after the complete description of every item recognised in cash flow from
operating activities it has been found that company had reported net cash provided by
operating activities is AUD 146.0 million reported in 2017 and AUD 863.0 million reported
in 2016 (Lend Lease, 2017; 2016).
2. Cash flows from investing Activities
Sale/redemption of investments
Sale / redemption of investments are covered under cash flow from investing
activities. This means how much the company had made money from the
investments thus in other words, this section is vital for growth. In this case,
CORPORATE ACCOUNTING 5
the company had reported AUD 164.9 million and AUD 330.5 million in
2017 and 2016 respectively (Lend Lease, 2017; 2016).
Acquisition of investments
This section covers the investments purchased by the company during the
accounting period. In this case, Lend Lease Group had reported AUD 257.3
million and AUD 563.2 million in FY 2017 and 2016 respectively. These
numbers indicate that the company acquired the investments less from the
previous year (Lend Lease, 2017; 2016).
Capital expenditure on investment properties
This item in cash from investing activities indicate the capital amount spent in
investment for example acquisition of land etc. (Lend Lease, 2017; 2016). In
this case, AUD 244.4 million and AUD 25.7 million spent in FY 2017 and
2016 respectively.
Net loans from associates and joint ventures
This item signifies that cash inflows from the associate and joint ventures in
form of net loans. In this case, AUD 5.7 million reported in FY 2017 whereas
AUD 38.6 million reported in FY 2016 (Lend Lease, 2017; 2016).
Disposal of consolidated entities
This item covers cash inflows from the sale of subsidiaries, joint ventures and
associates during the reporting year. In this case, company had disposed
consolidated entities worth of AUD 548.4 million and AUD 382.5 million in
2017 and 2016 respectively (Lend Lease, 2017; 2016).
Acquisition and Disposal of Plant, property and Equipment
Plant, property and Equipment are fixed assets of a company. The company
had acquired Plant, property and Equipment worth of AUD 136.4 million and
⊘ This is a preview!⊘
Do you want full access?
Subscribe today to unlock all pages.
Trusted by 1+ million students worldwide
CORPORATE ACCOUNTING 6
AUD 132.7 million in FY 2017 and 2016. Further the company had disposed
Plant, property and Equipment worth of AUD 13.1 million and AUD 16.7
million in FY 2017 and 2016 (Lend Lease, 2017; 2016).
Acquisition of intangible assets
Intangible assets are those assets which cannot be touched. The examples can
be know-how, patent right, trademark etc. In this case, company had acquired
intangible assets worth of AUD 23.9 million and AUD 46.1 million in FY
2017 and 2016 (Lend Lease, 2017; 2016).
Thus, after the complete description of every item recognised in cash flow from
investing activities it has been found that company had reported net cash provided by
investing activities is AUD 70.1 million reported in 2017 and AUD 0.6 milion reported in
2016.
3. Cash flows from financing Activities
Proceeds and repayment of borrowings
These are covered in this category of cash flow activity because the company
focuses on raising a capital and pays back to its investors. In this case,
reported proceeds from borrowings are AUD 2800.6 million and AUD 5327.6
million which indicate that the in 2017 there was decrement in borrowings
from last year by AUD 2527 million (Lend Lease, 2017; 2016). Further,
reported repayment of borrowings are AUD 2576.8 million and AUD 5626.0
million which indicate that the in 2017 there was decrement in repayment
from last year by AUD 3049.2 million (Lend Lease, 2017; 2016).
Dividends paid
Paraphrase This Document
Need a fresh take? Get an instant paraphrase of this document with our AI Paraphraser
CORPORATE ACCOUNTING 7
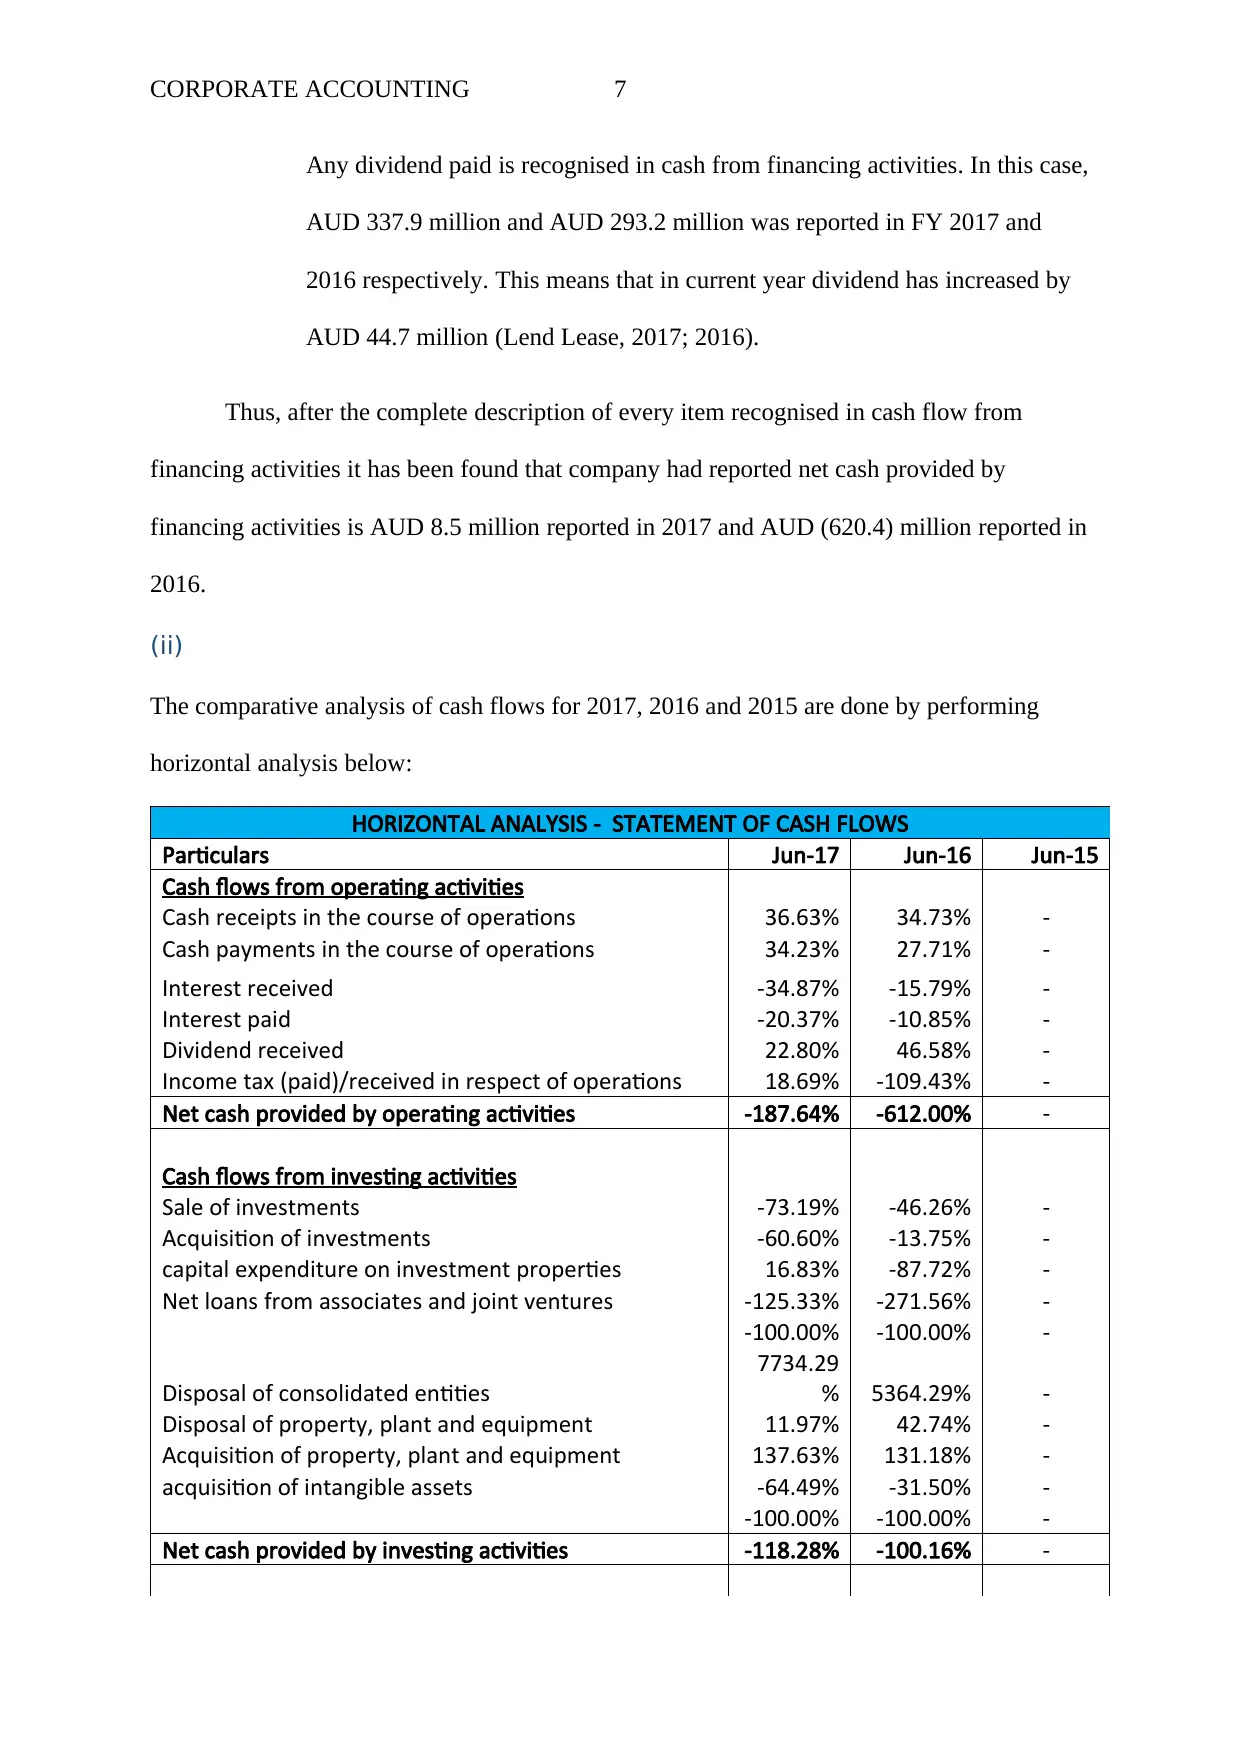
Any dividend paid is recognised in cash from financing activities. In this case,
AUD 337.9 million and AUD 293.2 million was reported in FY 2017 and
2016 respectively. This means that in current year dividend has increased by
AUD 44.7 million (Lend Lease, 2017; 2016).
Thus, after the complete description of every item recognised in cash flow from
financing activities it has been found that company had reported net cash provided by
financing activities is AUD 8.5 million reported in 2017 and AUD (620.4) million reported in
2016.
(ii)
The comparative analysis of cash flows for 2017, 2016 and 2015 are done by performing
horizontal analysis below:
HORIZONTAL ANALYSIS - STATEMENT OF CASH FLOWS
Particulars Jun-17 Jun-16 Jun-15
Cash flows from operating activities
Cash receipts in the course of operations 36.63% 34.73% -
Cash payments in the course of operations 34.23% 27.71% -
Interest received -34.87% -15.79% -
Interest paid -20.37% -10.85% -
Dividend received 22.80% 46.58% -
Income tax (paid)/received in respect of operations 18.69% -109.43% -
Net cash provided by operating activities -187.64% -612.00% -
Cash flows from investing activities
Sale of investments -73.19% -46.26% -
Acquisition of investments -60.60% -13.75% -
capital expenditure on investment properties 16.83% -87.72% -
Net loans from associates and joint ventures -125.33% -271.56% -
-100.00% -100.00% -
Disposal of consolidated entities
7734.29
% 5364.29% -
Disposal of property, plant and equipment 11.97% 42.74% -
Acquisition of property, plant and equipment 137.63% 131.18% -
acquisition of intangible assets -64.49% -31.50% -
-100.00% -100.00% -
Net cash provided by investing activities -118.28% -100.16% -
CORPORATE ACCOUNTING 8
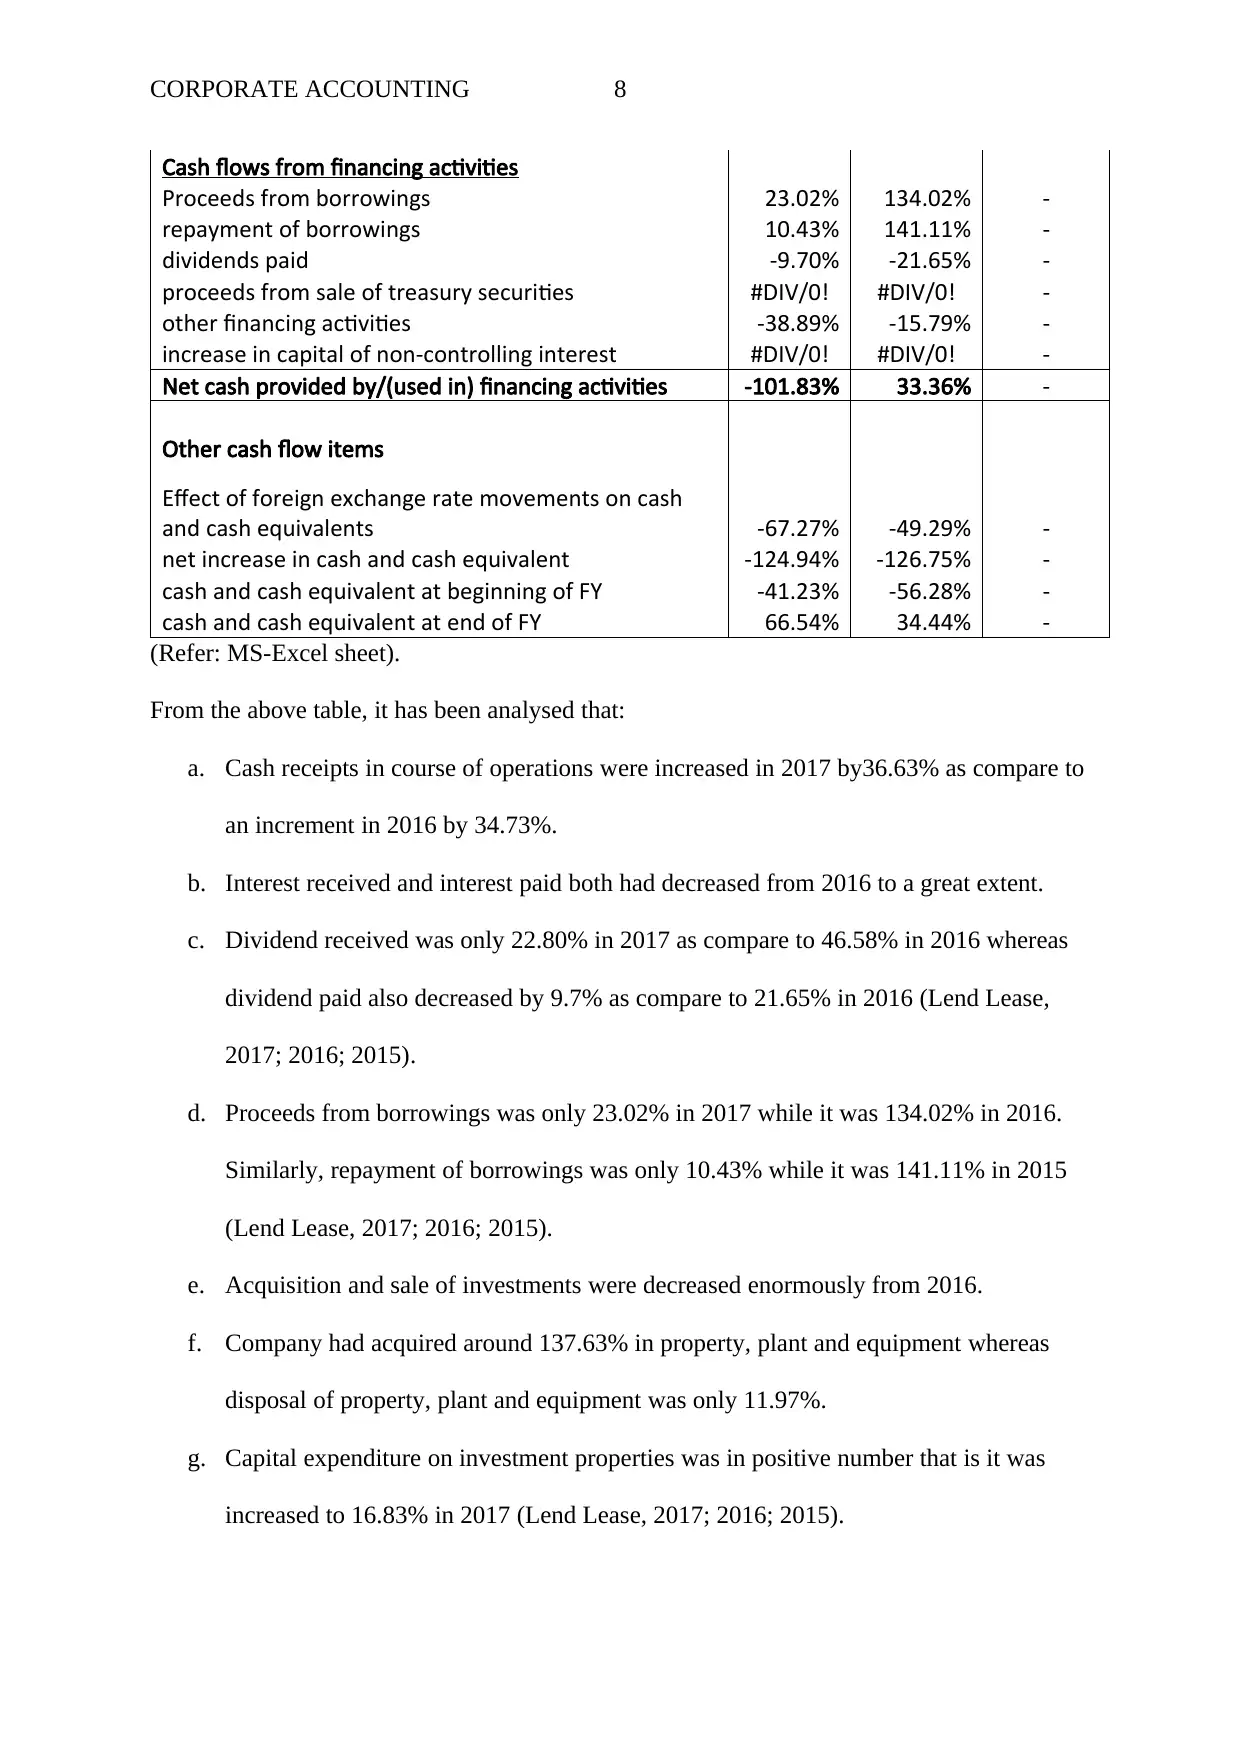
Cash flows from financing activities
Proceeds from borrowings 23.02% 134.02% -
repayment of borrowings 10.43% 141.11% -
dividends paid -9.70% -21.65% -
proceeds from sale of treasury securities #DIV/0! #DIV/0! -
other financing activities -38.89% -15.79% -
increase in capital of non-controlling interest #DIV/0! #DIV/0! -
Net cash provided by/(used in) financing activities -101.83% 33.36% -
Other cash flow items
Effect of foreign exchange rate movements on cash
and cash equivalents -67.27% -49.29% -
net increase in cash and cash equivalent -124.94% -126.75% -
cash and cash equivalent at beginning of FY -41.23% -56.28% -
cash and cash equivalent at end of FY 66.54% 34.44% -
(Refer: MS-Excel sheet).
From the above table, it has been analysed that:
a. Cash receipts in course of operations were increased in 2017 by36.63% as compare to
an increment in 2016 by 34.73%.
b. Interest received and interest paid both had decreased from 2016 to a great extent.
c. Dividend received was only 22.80% in 2017 as compare to 46.58% in 2016 whereas
dividend paid also decreased by 9.7% as compare to 21.65% in 2016 (Lend Lease,
2017; 2016; 2015).
d. Proceeds from borrowings was only 23.02% in 2017 while it was 134.02% in 2016.
Similarly, repayment of borrowings was only 10.43% while it was 141.11% in 2015
(Lend Lease, 2017; 2016; 2015).
e. Acquisition and sale of investments were decreased enormously from 2016.
f. Company had acquired around 137.63% in property, plant and equipment whereas
disposal of property, plant and equipment was only 11.97%.
g. Capital expenditure on investment properties was in positive number that is it was
increased to 16.83% in 2017 (Lend Lease, 2017; 2016; 2015).
⊘ This is a preview!⊘
Do you want full access?
Subscribe today to unlock all pages.
Trusted by 1+ million students worldwide
CORPORATE ACCOUNTING 9
OTHER COMPREHENSIVE INCOME STATEMENT
(iii) and (iv)
The statement of comprehensive income is classified into two categories:
a. Items that may be reclassified to P&L account:
Movement in fair value revaluation reserve
In this case, company had reported before tax fair value revaluation reserve
was AUD 12.1 million and after receiving tax benefit of AUD 12.1 million,
the movement in current year was zero while in 2016, the fair value
revaluation reserve was an outflow of AUD 1.7 million (Lend Lease, 2017;
2016).
Movement in Hedging reserve
In this case, company had reported before tax Hedging reserve was AUD 17.7
million and after receiving tax benefit of AUD 1.3 million, the inflow in
current year was AUD 19.0 million while in 2016, the hedging reserve was an
inflow of AUD 8.9 million (Lend Lease, 2017; 2016).
Movement in Foreign currency translation reserve
In this case, company had reported before tax expense of Foreign currency
translation reserve was AUD 58.6 million and after receiving tax benefit of
AUD 17.6 million, the net outflow in current year was AUD 41.0 million
while in 2016, the Foreign currency translation reserve was an inflow of AUD
16.0 million (Lend Lease, 2017; 2016).
Hence, the total items that may be reclassified to P&L account was an outflow of AUD 22.0
million.
b. Items that will not be reclassified to P&L account:
Paraphrase This Document
Need a fresh take? Get an instant paraphrase of this document with our AI Paraphraser
CORPORATE ACCOUNTING 10
Movements in non-controlling interest acquisition reserve
In this case, company had reported before tax Movements in non-controlling
interest acquisition reserve was AUD 2.8 million whereas in 2016, the amount
was AUD 0.5 million.
Movements in defined benefit plan re-measurements
In this case, company had reported before tax Movements in defined benefit
plan re-measurements was AUD (14.4) million and after receiving tax benefit
of AUD 2.8 million, the net outflow in current year was AUD 11.6 million
whereas in 2016, the amount was AUD 38.3 million.
Hence, the total items that will not be reclassified to P&L account was an outflow of AUD
8.8 million.
Thus, as a whole total comprehensive income after tax amounting to AUD 727.9 million.
These are attributable to Members of Lend Lease Corporation Limited of AUD 615.0 million
and to Unitholders of Lend Lease Trust of AUD 112.9 million (Lend Lease, 2017; 2016).
(v)
The statement of comprehensive income is prepared after the income statement which
includes profits and/or losses but may neglect to include changes in net assets due to transfer
of equity shareholdings, ownership change or other circumstances. In addition to this, another
reason of not including the items in Income statement is because these items are not regular
in nature to report and because of which users of financial report are mis-leaded.
ACCOUNTING FOR CORPORATE INCOME TAX
(vi)
The Income tax expense reported in Income statement in Financial Year 2017 was AUD
248.3 million (Lend Lease, 2017).
CORPORATE ACCOUNTING 11
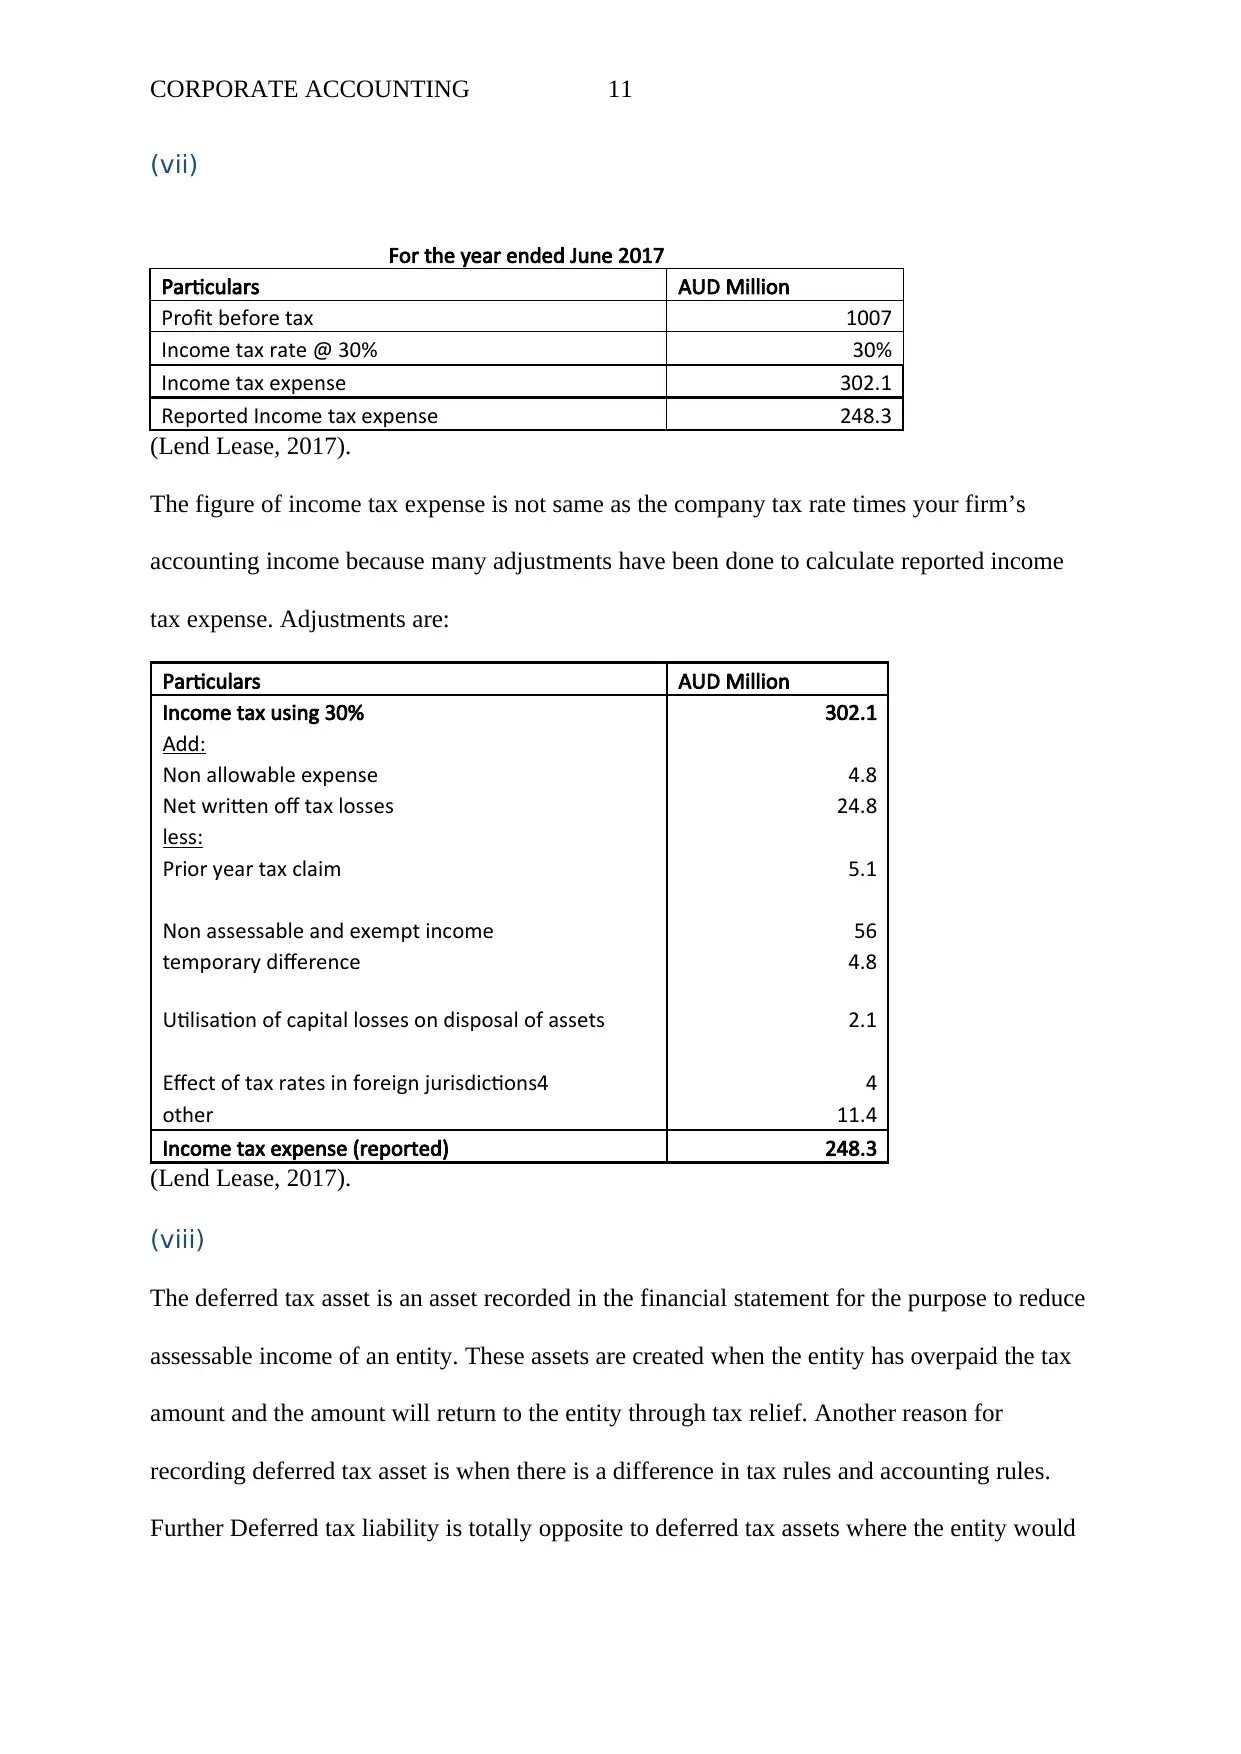
(vii)
For the year ended June 2017
Particulars AUD Million
Profit before tax 1007
Income tax rate @ 30% 30%
Income tax expense 302.1
Reported Income tax expense 248.3
(Lend Lease, 2017).
The figure of income tax expense is not same as the company tax rate times your firm’s
accounting income because many adjustments have been done to calculate reported income
tax expense. Adjustments are:
Particulars AUD Million
Income tax using 30% 302.1
Add:
Non allowable expense 4.8
Net written off tax losses 24.8
less:
Prior year tax claim 5.1
Non assessable and exempt income 56
temporary difference 4.8
Utilisation of capital losses on disposal of assets 2.1
Effect of tax rates in foreign jurisdictions4 4
other 11.4
Income tax expense (reported) 248.3
(Lend Lease, 2017).
(viii)
The deferred tax asset is an asset recorded in the financial statement for the purpose to reduce
assessable income of an entity. These assets are created when the entity has overpaid the tax
amount and the amount will return to the entity through tax relief. Another reason for
recording deferred tax asset is when there is a difference in tax rules and accounting rules.
Further Deferred tax liability is totally opposite to deferred tax assets where the entity would
⊘ This is a preview!⊘
Do you want full access?
Subscribe today to unlock all pages.
Trusted by 1+ million students worldwide
1 out of 14
Related Documents


Your All-in-One AI-Powered Toolkit for Academic Success.
+13062052269
info@desklib.com
Available 24*7 on WhatsApp / Email
![[object Object]](/_next/static/media/star-bottom.7253800d.svg)
Unlock your academic potential
Copyright © 2020–2026 A2Z Services. All Rights Reserved. Developed and managed by ZUCOL.