Lendlease Group Financial Analysis & Benchmarking Report
VerifiedAdded on 2022/08/21
|18
|4296
|14
Report
AI Summary
This report offers a comprehensive financial analysis and benchmarking of Lendlease Group Limited, an ASX 100 company in the Australian real estate market. The analysis investigates the benefits and drawbacks of diversification and expansion by comparing Lendlease with Stockland Group, CIMIC, and Downer Group. The study employs techniques like Discounted Cash Flow (DCF), Private Equity ratios, Return on Equity (ROE), and Return on Assets (ROA) to evaluate financial performance. The report highlights the importance of focused strategies in competitive markets and suggests thorough market investigations and long-term planning for expansion projects. The findings indicate that while diversification may be beneficial, detailed market valuations and risk assessments are crucial before investment decisions. The report also includes adjustments to financial statements and a decomposed ROA analysis to provide a clearer picture of the company's fiscal performance and returns over time.
LENDLEASE GROUP
FINANCIAL ANALYSIS &
BENCHMARKING
1
LENDLEASE GROUP
FINANCIAL ANALYSIS &
BENCHMARKING
BRENDAN LLOYD – STUDENT 13683575
BMBA70-870 ACCOUNTING FOR MANAGERS
PROF KEITH DUNCAN
FINANCIAL ANALYSIS &
BENCHMARKING
1
LENDLEASE GROUP
FINANCIAL ANALYSIS &
BENCHMARKING
BRENDAN LLOYD – STUDENT 13683575
BMBA70-870 ACCOUNTING FOR MANAGERS
PROF KEITH DUNCAN
Paraphrase This Document
Need a fresh take? Get an instant paraphrase of this document with our AI Paraphraser
LENDLEASE GROUP
FINANCIAL ANALYSIS &
BENCHMARKING
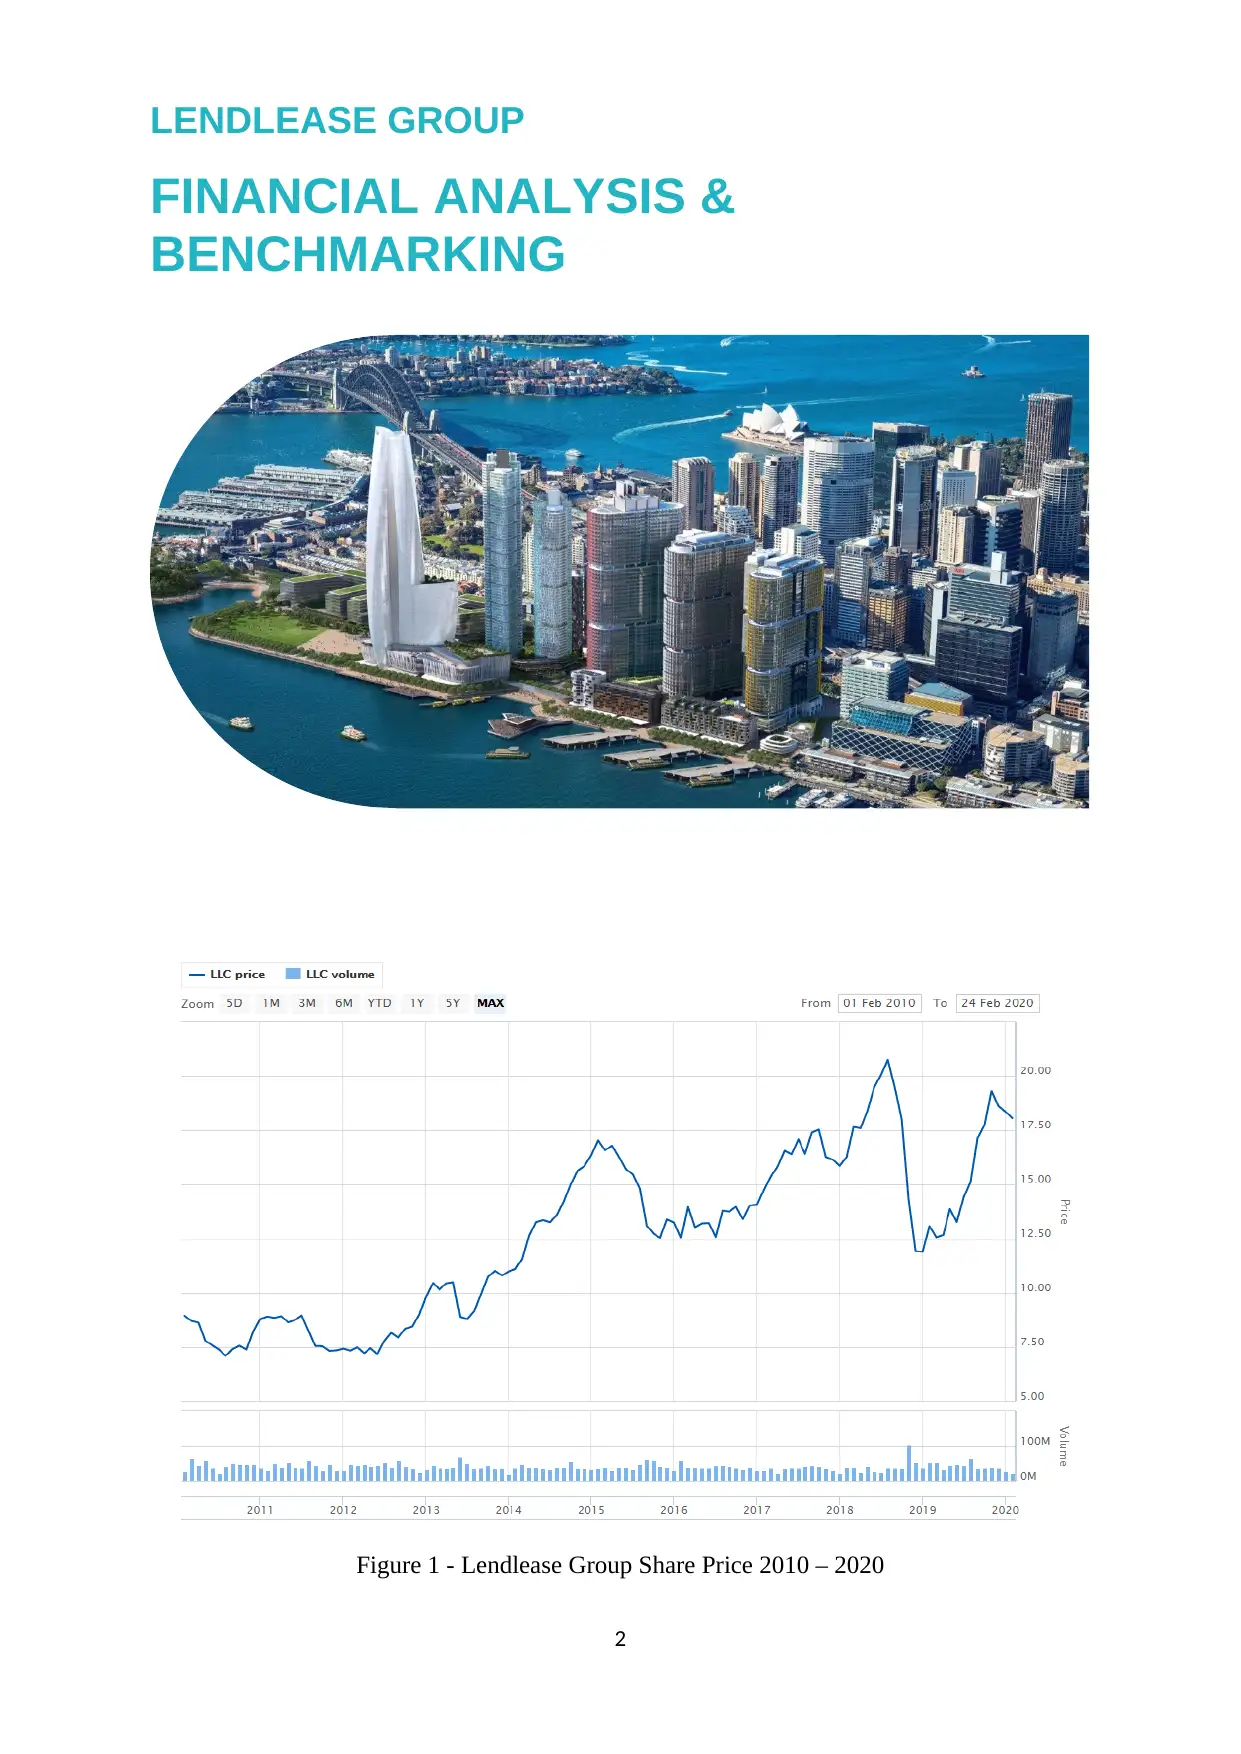
Figure 1 - Lendlease Group Share Price 2010 – 2020
2
FINANCIAL ANALYSIS &
BENCHMARKING
Figure 1 - Lendlease Group Share Price 2010 – 2020
2
LENDLEASE GROUP
FINANCIAL ANALYSIS &
BENCHMARKING
Executive Summary
This report provides an in-depth analysis of the financial benefits and drawbacks that
arise as a result of diversification from the principal business activity and expansion by bench
marking Lendlease Group Limited against three other companies namely, the Stockland
Group, CIMIC and the Downer Group. These three companies have their roots in Australia
but have significant international presence and share quite a significant number of industries
with Lendlease. The techniques used to carry out the analysis include Discount cash flow
analysis (DCF), Private Equity ratio, Return on Equity (ROE) and Return on Assets (ROA)
trade-off frameworks among others. All the illustrations and info graphics can be found
within the report document. The results obtained from the analysis carried out act as clear
indicators that evolving markets that boast of huge, global competitor numbers are the main
reason why companies such as Lendlease Group Limited should come up with a way in
which they can create or direct laser-like focus on their formative niche, instead of constantly
trying to come up with cutting-edge techniques of diversifying their business operations
towards larger and high risk industries. The report finds that despite the fact that the
diversification of a company from its principal business activity may prove to be a wise
investment choice in the long run, business firms need to carry out in-depth market valuations
and risk analysis before any investment decision is made. The recommendations that are
discussed in the report include:
Carrying out in-depth market investigations before embarking on any
expansion projects.
Investments that involve expansion and diversification should only be
implemented as long term projects and not as short term projects.
If a firm chooses to carry out an expansive short term investment, then
the timing of the aforementioned investment should be very accurate to ensure that
maximum profits are reaped from the aforementioned investment.
The recommendations made on this report are based on the results of the analysis that
were fruitfully carried out accompanied with an in-depth study and analysis of the
3
⊘ This is a preview!⊘
Do you want full access?
Subscribe today to unlock all pages.
Trusted by 1+ million students worldwide
LENDLEASE GROUP
FINANCIAL ANALYSIS &
BENCHMARKING
behavioural patterns of Lendlease Group, Stockland Group, CIMIC and the Downer Group
against their historical performances.
Introduction and Objectives
Lendlease Group is an ASX 100 company which is famous for property development
in the Australian real estate market. Lendlease Group Company draws heavily on corporate
and social responsibity within its workplaces and projects. As a result of the active corporate
social responsibility, Lendlease Group has been recognised on several occasions for their
innovative appetite, inclusivity, broad mindedness and the ability to be able to generate
alternate & sustainable methods of work (Parker, 2018). The Lendlease Group undertake
building and development works as their core business activity. However, within a span of
the last ten years, the Group has moved towards diversification and sustainability in the
“booming” Australian roads, rail and tunnels sector, with acquisitions of key companies that
have civil engineering capabilities thus forming the Group’s engineering business. Obviously,
by diversifying, Lendlease Group’s goal was to increase their profit margins (Tarrant and
Hooper, 2018). However, according to media statements, as per the company’s Annual
Reports, although solid growth and a foothold in the sector’s pipeline seemed to have been
achieved, Lendlease Group was unable to realize their long term profit margins. In the
beginning of Lendlease Group’s diversification efforts the Company was able to portray a
strong sense of growth in their core business and continued to show signs of a highly robust
revenue base, profit margin increases and shareholder confidence. However, in 2018,
Lendlease Group’s lack seemed to have changed when the Company started to incur losses
amounting to several millions therefore forcing the company’s management board to sell both
their engineering and services businesses so as to focus on their core-business which is
Building and development (Gale, 2019).
This report seeks to carry out an in-depth analysis of the benefits and drawbacks of
diversification and expansion from a business firm’s core business activity in today’s market.
Lendlease Group limited has been benchmarked against the Stockland Group, CIMIC and
Downer Group – three Australian companies with international presences in industries shared
4
Paraphrase This Document
Need a fresh take? Get an instant paraphrase of this document with our AI Paraphraser
LENDLEASE GROUP
FINANCIAL ANALYSIS &
BENCHMARKING
with Lendlease. The three companies under which Lendlease Group is being benchmarked
against have all in one way or another, analysed their own markets and have been observed to
be very decisive in their investment decisions either in the context of diversification of their
core business activity or in their decisions to expand to new markets.
Overview
CIMIC, Stockland Group and Downer Group are undoubtedly the greatest industry
competitors of the Lendlease Group across the real estate development, infrastructure
development and construction industries. This shared relationship is the key factor that
informed the decision to use the three companies as benchmarks for the purpose of this
report. The CIMIC Group boasts of significant international presence in several business
fields ranging from engineering, infrastructural development, mining and resource
excavation, property development, telecommunications and environmental services. In the
recent past, CIMIC Group halted all its business operations in the Middle East pipeline, a
move which led to a ‘one time’ 1 billion dollars restructuring impact on the company. As a
result of the restructuring efforts, the CIMIC Group is left with businesses in Australia,
Southeast Asia and New Zealand (Duffield, 2017). Between 2010 and 2019, the CIMIC
Group reported average gross revenue of 15billion dollars thus, compared to Lendlease,
CIMIC Group can be said to be the more superior competitor (Dumay and Hossain, 2019).
However, despite the superior outlook, an in-depth analysis of CIMIC Group financial
performance tends to portray scattered results more so, across ROA and ROE performance
indicators as shall be illustrated and discussed in later sections of the report.
On the other hand, the Downer Group is yet another ASX 100 Company which has in
the past, ventured into the mining and resource excavation, infrastructural development and
the roads, rail and renewable service businesses. Most recently, the Downer Group’s
management board re-evaluated their risk profile and subsequently, made a decision to
withdraw the company from the renewables business sector owing to the extreme revels of
risk in the aforementioned sector (Davis, 2017). The risk levels were clearly brought out by
the fact that the company experienced numerous losses on quite a number of projects in the
5
LENDLEASE GROUP
FINANCIAL ANALYSIS &
BENCHMARKING
renewables sector. As such, the company opted to re-focus their resources and strength on the
mining and road construction business sectors. Currently, the Downer Group have ownership
of 88% of Spotless, a move that enabled the company to place themselves within the
capability parameters that will enable them to carry out several income generating activities
ranging from procurement, design to general maintenance and service in the mining and road
construction industries (Seymour, 2016).
The Stockland Corporation Limited which is part of our benchmark selections is an
Australian based property development company. Unlike the previous companies that we
have looked at, Stockland Corporation Limited is seemingly quite at ease in their operative
niche and has continuously provided solid returns to their shareholders. Stockland
Corporation Limited core business activity lies in the operation and maintenance of
businesses in shopping centres, housing estates, industrial estates and retirement villages.
The Stockland Corporation limited has been able to maintain the aforementioned success
levels by placing uninterrupted lacer focus-like attention on improving their general
performance within their industry (Westermann and Kortt, 2018).
Adjustments to the Financial Statements
Adjusting the entries in the financial reports allows the accountant to communicate with a
clearer picture of the company’s financial report. This easily done by matching entries of
revenues with those of expenses to ensure that the company does not operate on loses, this
includes adding bills of electricity, rent and other expenses to the overall company cost report
even before their due payment date. Observing the fiscal data in the Lendlease case, the
report removed Engineering and Services from the years they have been defined within
Bloomberg 2018 and 2019, with some further assumptive adjustments being made based on
trended revenue upsurge of 3.1% per annum and averaged 5.1% EBIT taken from previous
years’ reports.
6
⊘ This is a preview!⊘
Do you want full access?
Subscribe today to unlock all pages.
Trusted by 1+ million students worldwide
LENDLEASE GROUP
FINANCIAL ANALYSIS &
BENCHMARKING
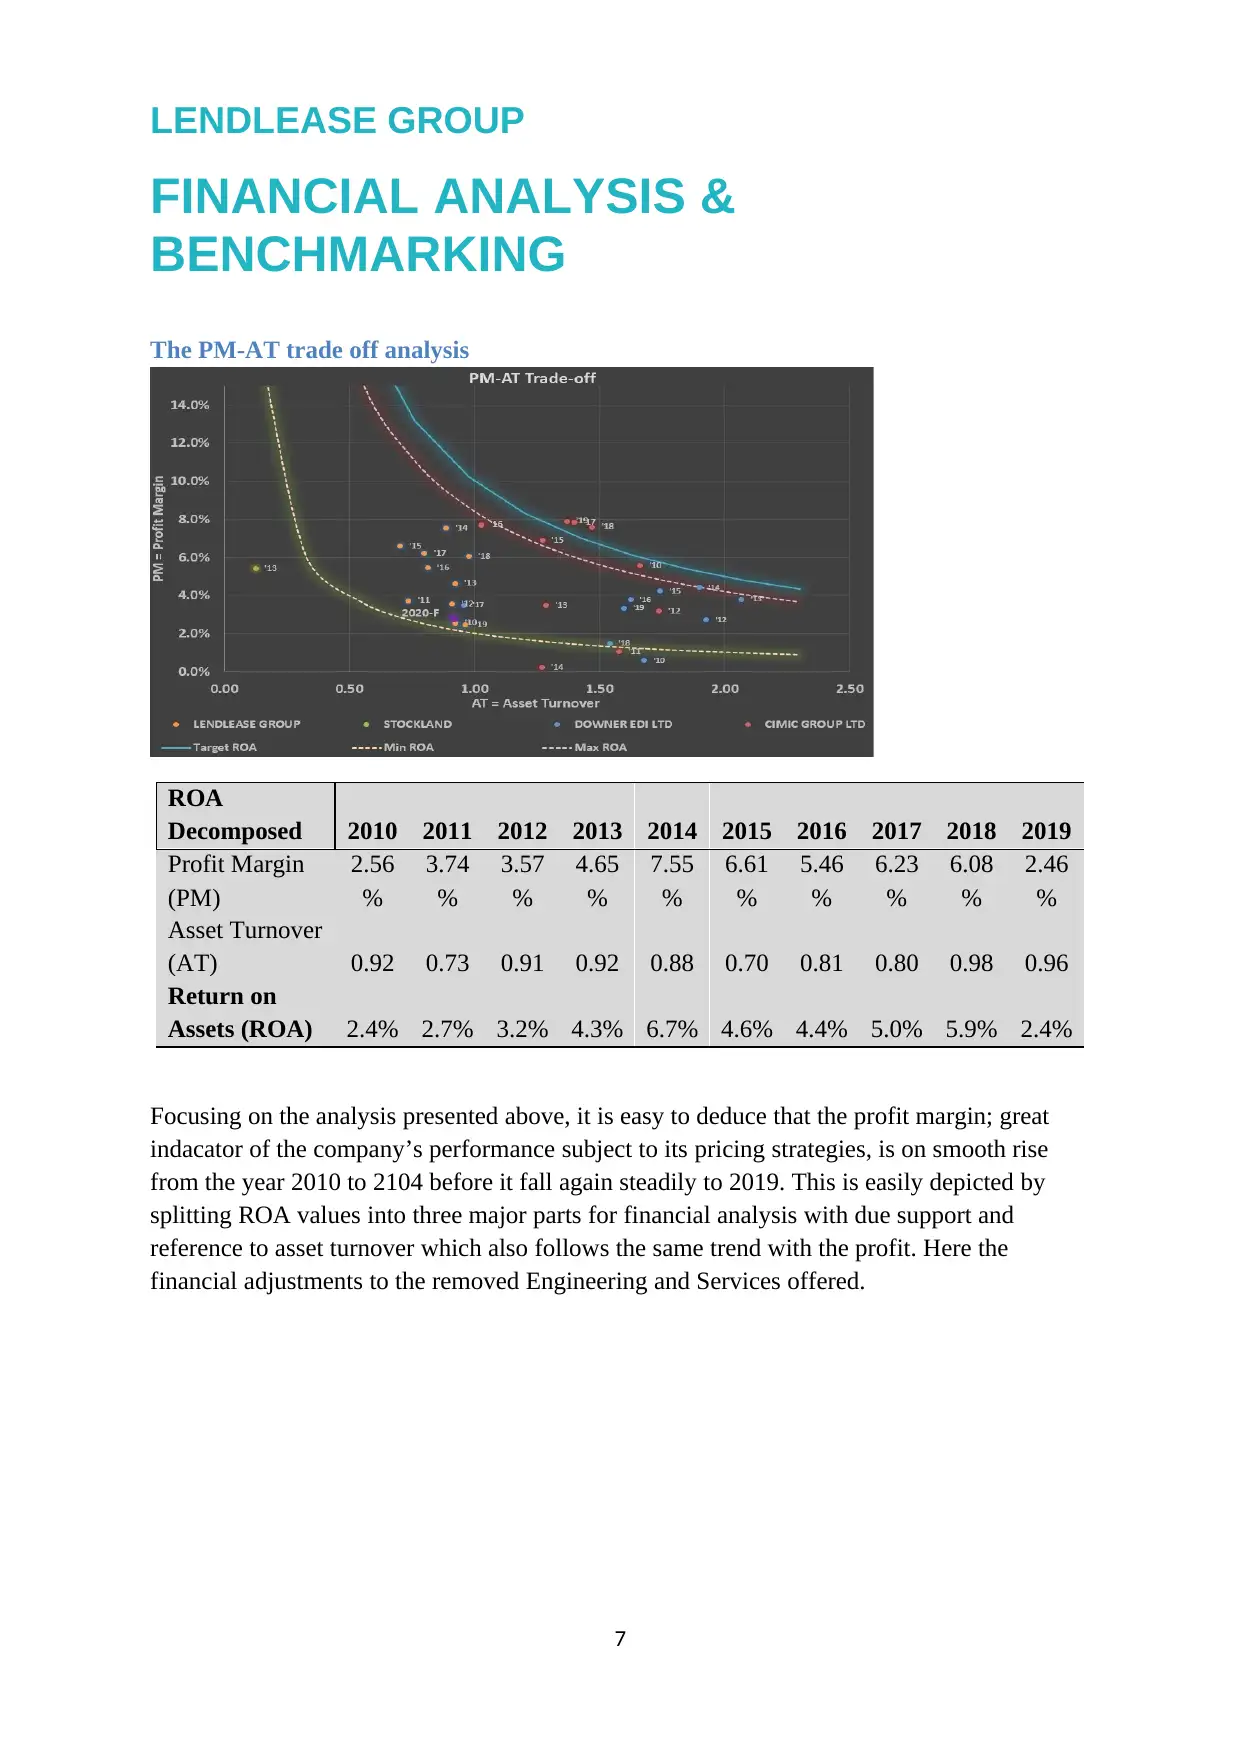
The PM-AT trade off analysis
ROA
Decomposed 2010 2011 2012 2013 2014 2015 2016 2017 2018 2019
Profit Margin
(PM)
2.56
%
3.74
%
3.57
%
4.65
%
7.55
%
6.61
%
5.46
%
6.23
%
6.08
%
2.46
%
Asset Turnover
(AT) 0.92 0.73 0.91 0.92 0.88 0.70 0.81 0.80 0.98 0.96
Return on
Assets (ROA) 2.4% 2.7% 3.2% 4.3% 6.7% 4.6% 4.4% 5.0% 5.9% 2.4%
Focusing on the analysis presented above, it is easy to deduce that the profit margin; great
indacator of the company’s performance subject to its pricing strategies, is on smooth rise
from the year 2010 to 2104 before it fall again steadily to 2019. This is easily depicted by
splitting ROA values into three major parts for financial analysis with due support and
reference to asset turnover which also follows the same trend with the profit. Here the
financial adjustments to the removed Engineering and Services offered.
7
FINANCIAL ANALYSIS &
BENCHMARKING
The PM-AT trade off analysis
ROA
Decomposed 2010 2011 2012 2013 2014 2015 2016 2017 2018 2019
Profit Margin
(PM)
2.56
%
3.74
%
3.57
%
4.65
%
7.55
%
6.61
%
5.46
%
6.23
%
6.08
%
2.46
%
Asset Turnover
(AT) 0.92 0.73 0.91 0.92 0.88 0.70 0.81 0.80 0.98 0.96
Return on
Assets (ROA) 2.4% 2.7% 3.2% 4.3% 6.7% 4.6% 4.4% 5.0% 5.9% 2.4%
Focusing on the analysis presented above, it is easy to deduce that the profit margin; great
indacator of the company’s performance subject to its pricing strategies, is on smooth rise
from the year 2010 to 2104 before it fall again steadily to 2019. This is easily depicted by
splitting ROA values into three major parts for financial analysis with due support and
reference to asset turnover which also follows the same trend with the profit. Here the
financial adjustments to the removed Engineering and Services offered.
7
Paraphrase This Document
Need a fresh take? Get an instant paraphrase of this document with our AI Paraphraser
LENDLEASE GROUP
FINANCIAL ANALYSIS &
BENCHMARKING
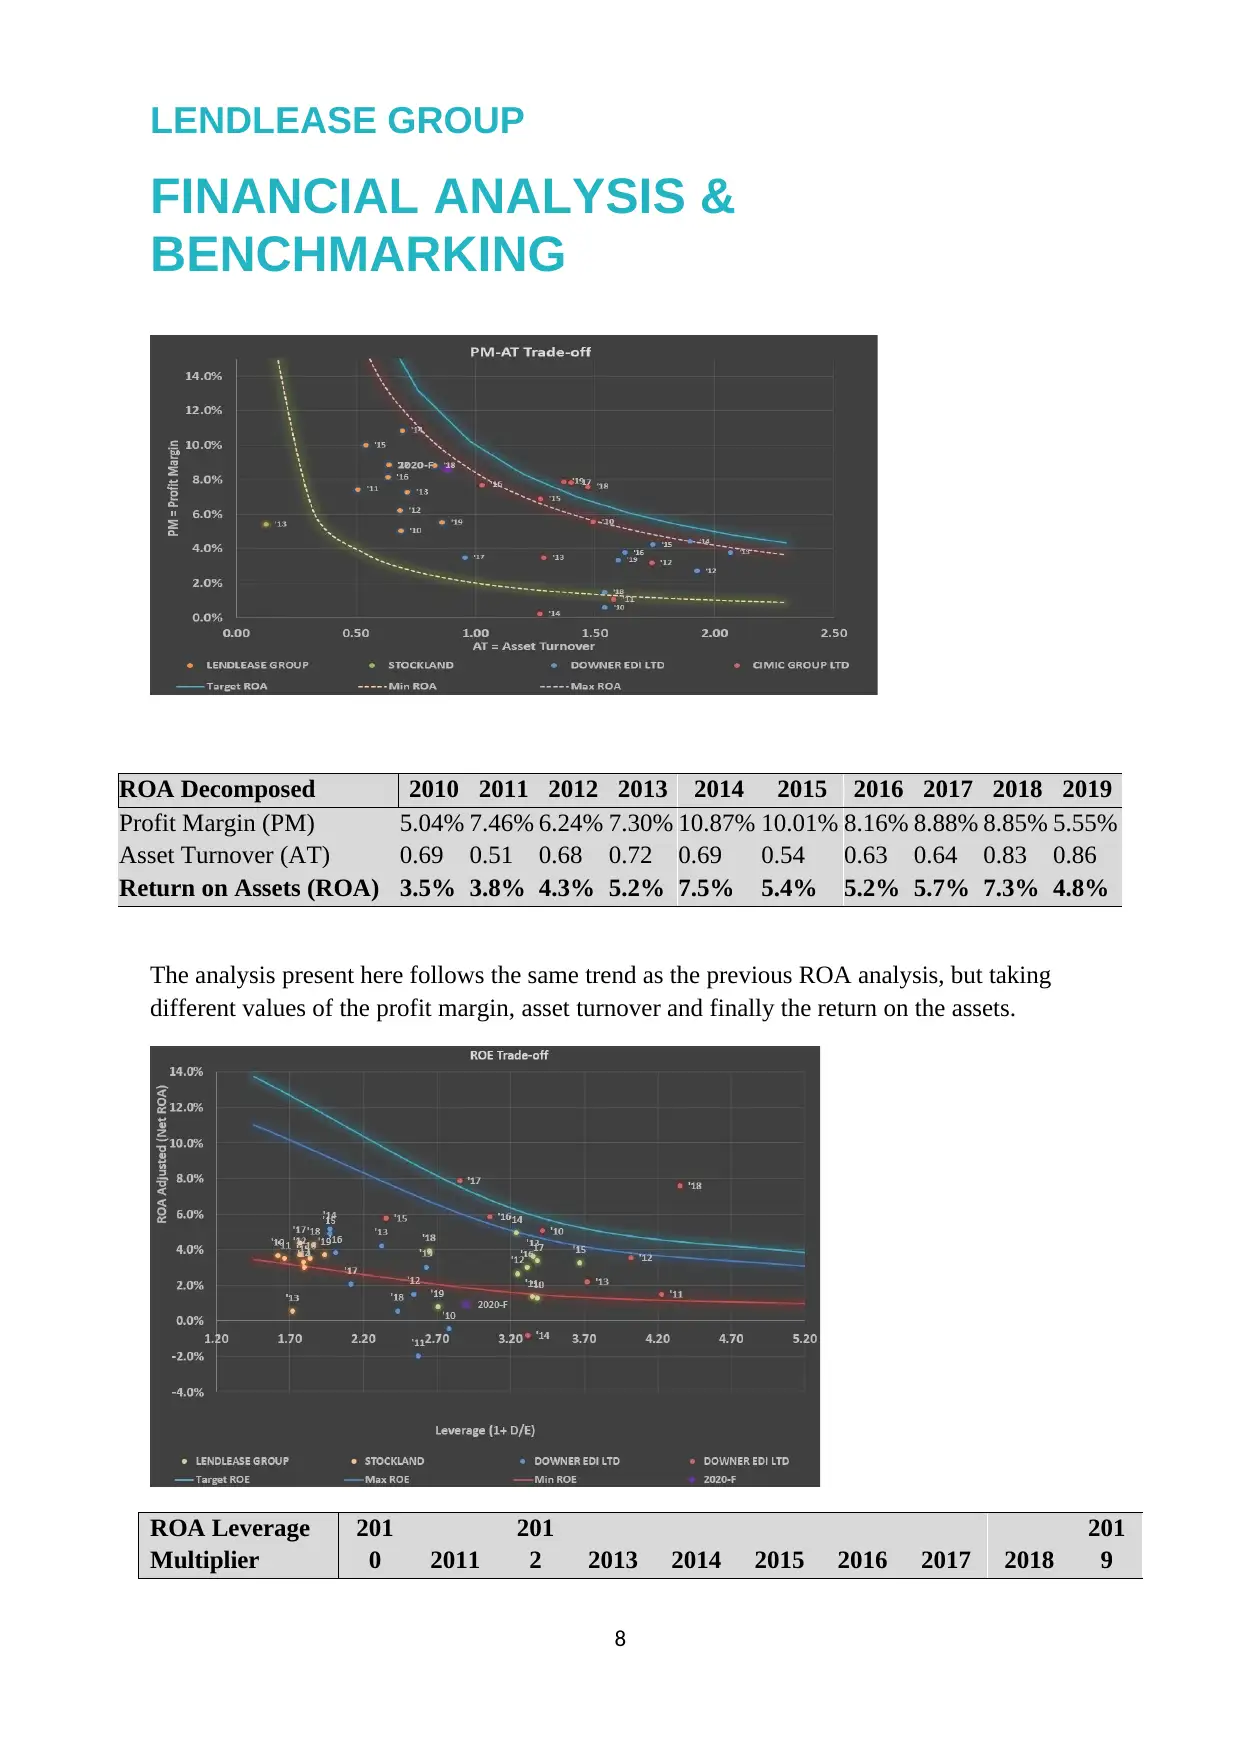
ROA Decomposed 2010 2011 2012 2013 2014 2015 2016 2017 2018 2019
Profit Margin (PM) 5.04% 7.46% 6.24% 7.30% 10.87% 10.01% 8.16% 8.88% 8.85% 5.55%
Asset Turnover (AT) 0.69 0.51 0.68 0.72 0.69 0.54 0.63 0.64 0.83 0.86
Return on Assets (ROA) 3.5% 3.8% 4.3% 5.2% 7.5% 5.4% 5.2% 5.7% 7.3% 4.8%
The analysis present here follows the same trend as the previous ROA analysis, but taking
different values of the profit margin, asset turnover and finally the return on the assets.
ROA Leverage
Multiplier
201
0 2011
201
2 2013 2014 2015 2016 2017 2018
201
9
8
FINANCIAL ANALYSIS &
BENCHMARKING
ROA Decomposed 2010 2011 2012 2013 2014 2015 2016 2017 2018 2019
Profit Margin (PM) 5.04% 7.46% 6.24% 7.30% 10.87% 10.01% 8.16% 8.88% 8.85% 5.55%
Asset Turnover (AT) 0.69 0.51 0.68 0.72 0.69 0.54 0.63 0.64 0.83 0.86
Return on Assets (ROA) 3.5% 3.8% 4.3% 5.2% 7.5% 5.4% 5.2% 5.7% 7.3% 4.8%
The analysis present here follows the same trend as the previous ROA analysis, but taking
different values of the profit margin, asset turnover and finally the return on the assets.
ROA Leverage
Multiplier
201
0 2011
201
2 2013 2014 2015 2016 2017 2018
201
9
8
LENDLEASE GROUP
FINANCIAL ANALYSIS &
BENCHMARKING
ROA
2.4
% 2.7%
3.2
% 4.3% 6.7% 4.6% 4.4% 5.0% 5.9%
2.4
%
Net ROA
(Adjusted ROA)
1.3
% 1.4%
2.7
% 3.7% 5.0% 3.3% 3.0% 3.4% 3.9%
0.8
%
(1+Debt/Equity) 3.38 3.34 3.25 3.35 3.24 3.67 3.31 3.38 2.64 2.70
ROE
4.4
% 4.6%
8.7
%
12.2
%
16.0
%
12.1
%
10.1
%
11.5
%
10.4
%
2.2
%
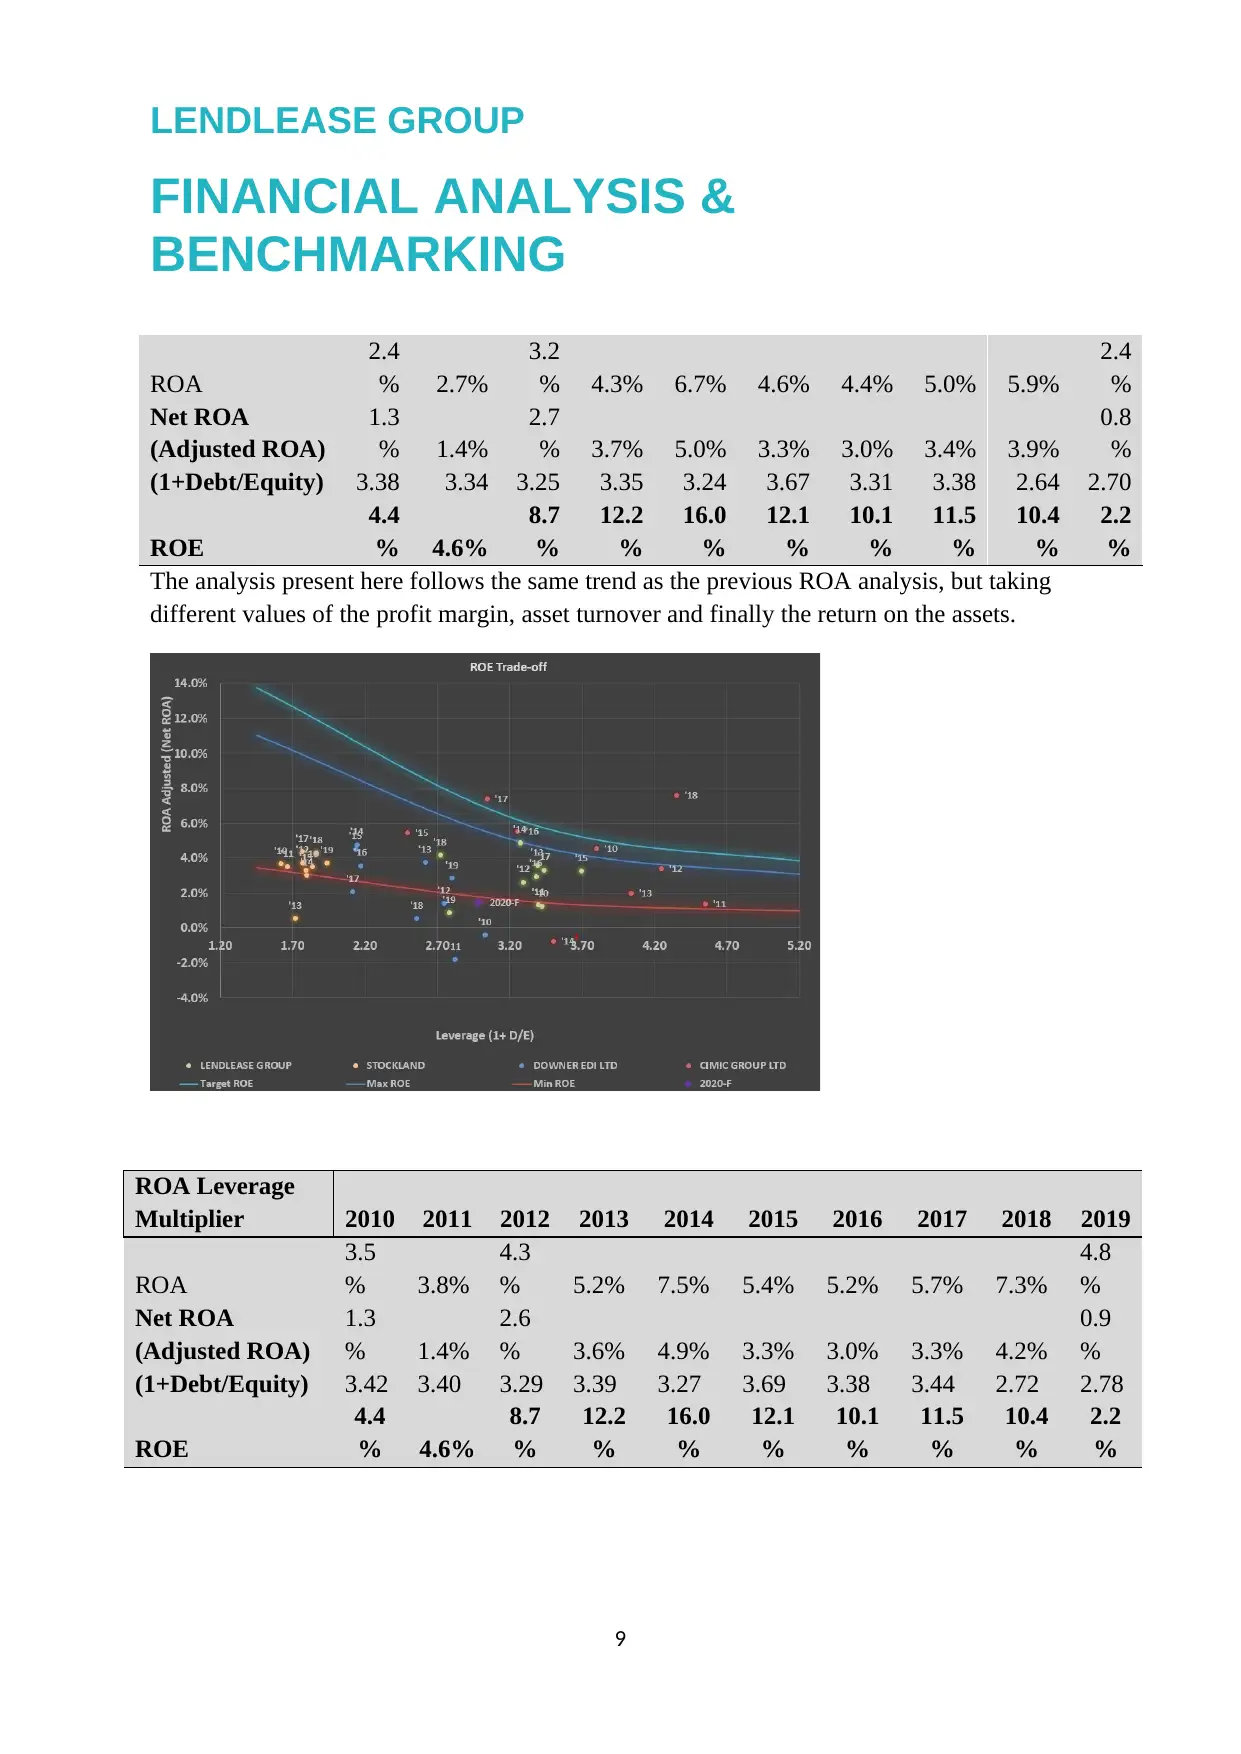
The analysis present here follows the same trend as the previous ROA analysis, but taking
different values of the profit margin, asset turnover and finally the return on the assets.
ROA Leverage
Multiplier 2010 2011 2012 2013 2014 2015 2016 2017 2018 2019
ROA
3.5
% 3.8%
4.3
% 5.2% 7.5% 5.4% 5.2% 5.7% 7.3%
4.8
%
Net ROA
(Adjusted ROA)
1.3
% 1.4%
2.6
% 3.6% 4.9% 3.3% 3.0% 3.3% 4.2%
0.9
%
(1+Debt/Equity) 3.42 3.40 3.29 3.39 3.27 3.69 3.38 3.44 2.72 2.78
ROE
4.4
% 4.6%
8.7
%
12.2
%
16.0
%
12.1
%
10.1
%
11.5
%
10.4
%
2.2
%
9
FINANCIAL ANALYSIS &
BENCHMARKING
ROA
2.4
% 2.7%
3.2
% 4.3% 6.7% 4.6% 4.4% 5.0% 5.9%
2.4
%
Net ROA
(Adjusted ROA)
1.3
% 1.4%
2.7
% 3.7% 5.0% 3.3% 3.0% 3.4% 3.9%
0.8
%
(1+Debt/Equity) 3.38 3.34 3.25 3.35 3.24 3.67 3.31 3.38 2.64 2.70
ROE
4.4
% 4.6%
8.7
%
12.2
%
16.0
%
12.1
%
10.1
%
11.5
%
10.4
%
2.2
%
The analysis present here follows the same trend as the previous ROA analysis, but taking
different values of the profit margin, asset turnover and finally the return on the assets.
ROA Leverage
Multiplier 2010 2011 2012 2013 2014 2015 2016 2017 2018 2019
ROA
3.5
% 3.8%
4.3
% 5.2% 7.5% 5.4% 5.2% 5.7% 7.3%
4.8
%
Net ROA
(Adjusted ROA)
1.3
% 1.4%
2.6
% 3.6% 4.9% 3.3% 3.0% 3.3% 4.2%
0.9
%
(1+Debt/Equity) 3.42 3.40 3.29 3.39 3.27 3.69 3.38 3.44 2.72 2.78
ROE
4.4
% 4.6%
8.7
%
12.2
%
16.0
%
12.1
%
10.1
%
11.5
%
10.4
%
2.2
%
9
⊘ This is a preview!⊘
Do you want full access?
Subscribe today to unlock all pages.
Trusted by 1+ million students worldwide
LENDLEASE GROUP
FINANCIAL ANALYSIS &
BENCHMARKING
ROA discussion
The results presented above marks improvement, with the most definitive change coming
from an increase in Profit Margin from 4.89% to 7.84% pre and post-adjustment,
respectively. It should be noted that the removal of Engineering and Services’ assets,
averaging just over 10% of the Group’s total assets, Asset Turnover has increased from 0.68
pre, and 0.86 post-adjustment. This report agrees with Lendlease’s decision to remove the
Engineering and Services businesses from the Group’s portfolio, aligning itself more closely
to its core values. Although the market indicates the Board did not have the information on
the pending failures of the Engineering roads and tunnels projects, a bath may have been
setup to soak up all losses within the one share market movement, giving a firm footing for
the company to rebuild their value and continue growth of their Building business.
It is Imperative to note that the division of ROE and ROA into three major parts hastens the
understanding of a company’s fiscal performance and their returns on equity over time
whereas as the profit margin increases due to increase in sale the overall company’s equity
also increases which is also the same case with the asset turnover which its increase results in
more sales per asset owned, resulting in a higher overall return on equity. The financial
leverage leads to an upturn in return on equity, since using more debt financing brings on
higher interest payments, which are tax deductible, which makes it necessary to include
adjustments to the Financial Statements so as to create a clearer picture of the company’s
fiscal skeleton.
Financial Performance
Trends in sales, EBIT and assets
Lendlease has, over the past ten years, seen constant growth in revenue, assets, EBIT and
shareholder value, as the group has continued to perform well within their core business and
diversified in the infrastructure industries, however the growth seems to have caught the
company napping, given the half billion dollar writedown. Prior to 2019, as depicted in the
the PM AT framework with integrated analyses, the EBIT across the group ranged between
2.55% and 7.56% with an average over the 9yrs seeing 5.16%.
10
Paraphrase This Document
Need a fresh take? Get an instant paraphrase of this document with our AI Paraphraser
LENDLEASE GROUP
FINANCIAL ANALYSIS &
BENCHMARKING
2010 2011 2012 2013 2014 2015 2016 2017 2018 2019
-
2,000.0
4,000.0
6,000.0
8,000.0
10,000.0
12,000.0
14,000.0
16,000.0
18,000.0
Lendlease Revenue vs EBIT vs Assets
Operating (Sales) Revenue EBIT Total Current Assets Free Cashflow
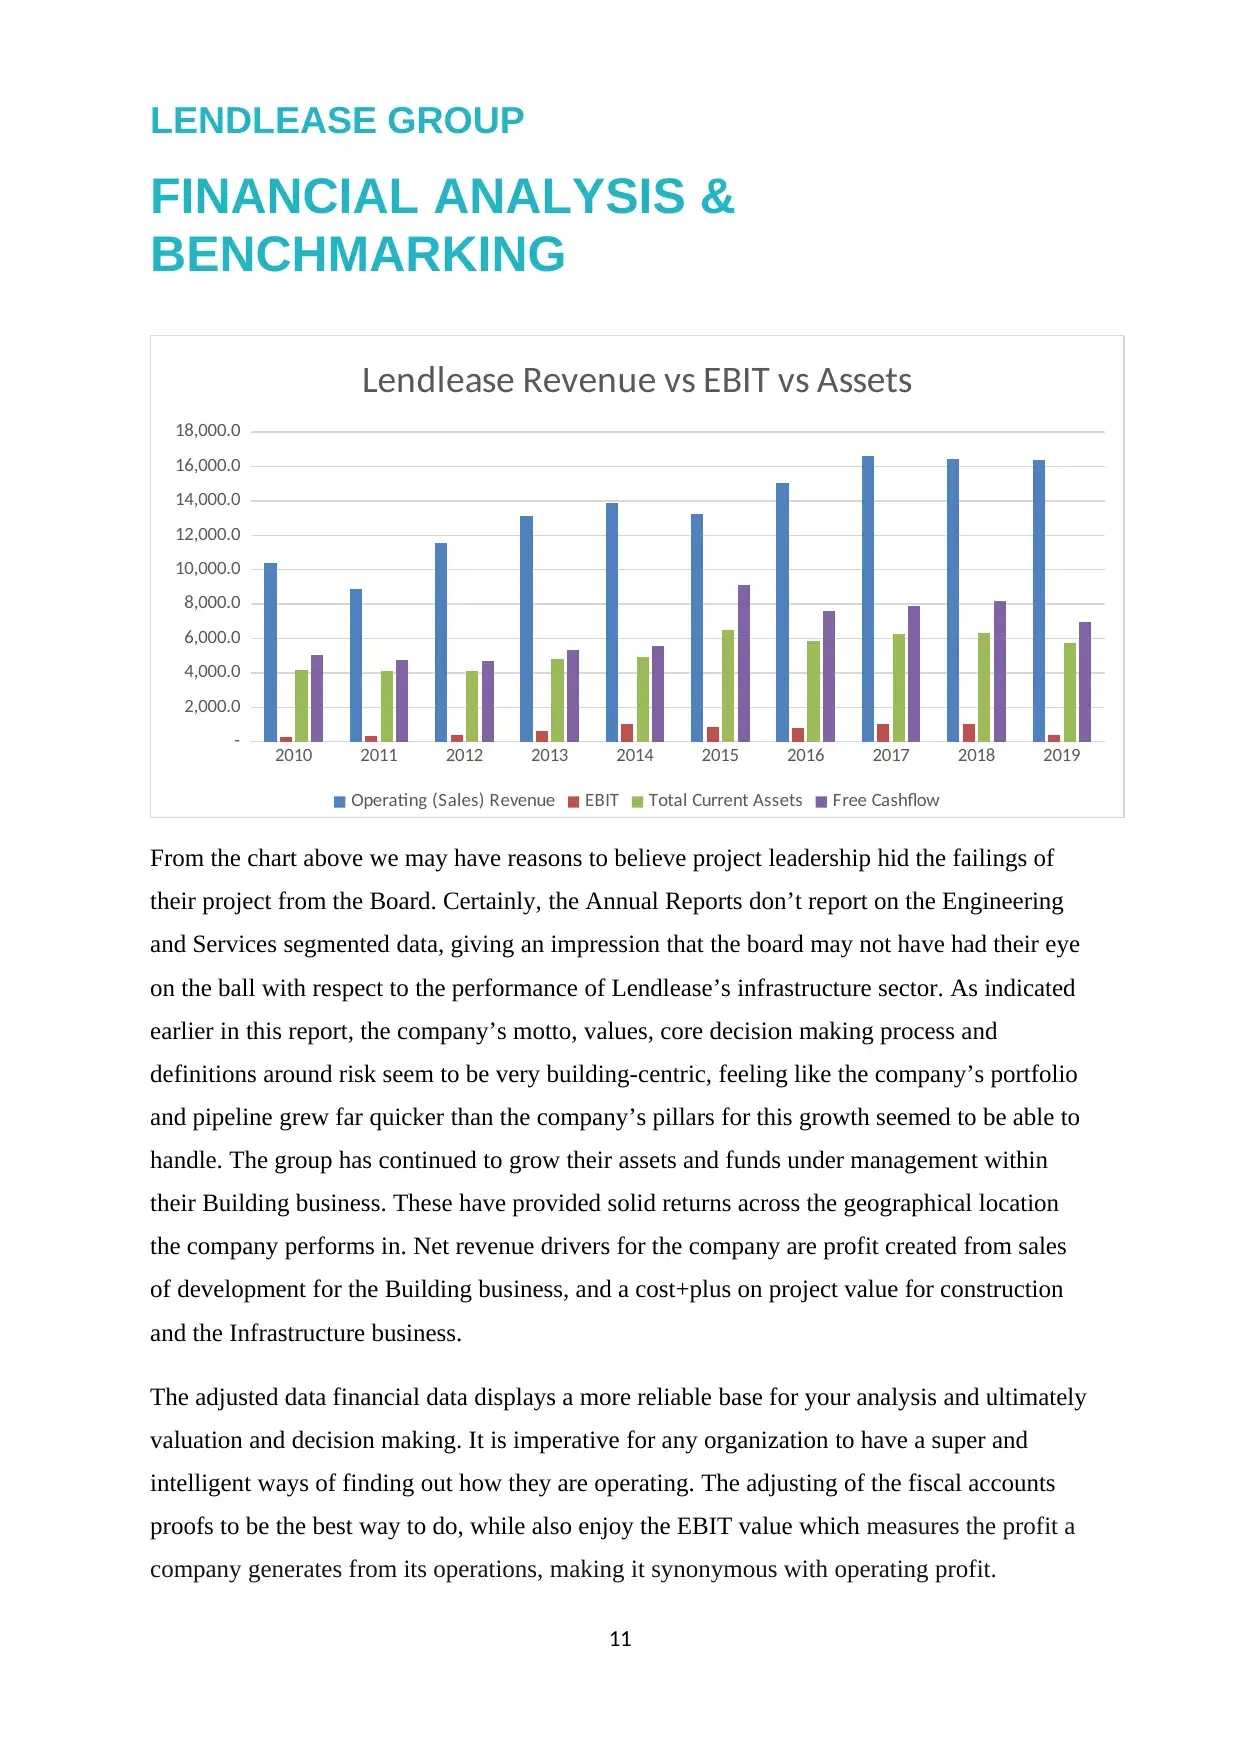
From the chart above we may have reasons to believe project leadership hid the failings of
their project from the Board. Certainly, the Annual Reports don’t report on the Engineering
and Services segmented data, giving an impression that the board may not have had their eye
on the ball with respect to the performance of Lendlease’s infrastructure sector. As indicated
earlier in this report, the company’s motto, values, core decision making process and
definitions around risk seem to be very building-centric, feeling like the company’s portfolio
and pipeline grew far quicker than the company’s pillars for this growth seemed to be able to
handle. The group has continued to grow their assets and funds under management within
their Building business. These have provided solid returns across the geographical location
the company performs in. Net revenue drivers for the company are profit created from sales
of development for the Building business, and a cost+plus on project value for construction
and the Infrastructure business.
The adjusted data financial data displays a more reliable base for your analysis and ultimately
valuation and decision making. It is imperative for any organization to have a super and
intelligent ways of finding out how they are operating. The adjusting of the fiscal accounts
proofs to be the best way to do, while also enjoy the EBIT value which measures the profit a
company generates from its operations, making it synonymous with operating profit.
11
FINANCIAL ANALYSIS &
BENCHMARKING
2010 2011 2012 2013 2014 2015 2016 2017 2018 2019
-
2,000.0
4,000.0
6,000.0
8,000.0
10,000.0
12,000.0
14,000.0
16,000.0
18,000.0
Lendlease Revenue vs EBIT vs Assets
Operating (Sales) Revenue EBIT Total Current Assets Free Cashflow
From the chart above we may have reasons to believe project leadership hid the failings of
their project from the Board. Certainly, the Annual Reports don’t report on the Engineering
and Services segmented data, giving an impression that the board may not have had their eye
on the ball with respect to the performance of Lendlease’s infrastructure sector. As indicated
earlier in this report, the company’s motto, values, core decision making process and
definitions around risk seem to be very building-centric, feeling like the company’s portfolio
and pipeline grew far quicker than the company’s pillars for this growth seemed to be able to
handle. The group has continued to grow their assets and funds under management within
their Building business. These have provided solid returns across the geographical location
the company performs in. Net revenue drivers for the company are profit created from sales
of development for the Building business, and a cost+plus on project value for construction
and the Infrastructure business.
The adjusted data financial data displays a more reliable base for your analysis and ultimately
valuation and decision making. It is imperative for any organization to have a super and
intelligent ways of finding out how they are operating. The adjusting of the fiscal accounts
proofs to be the best way to do, while also enjoy the EBIT value which measures the profit a
company generates from its operations, making it synonymous with operating profit.
11
LENDLEASE GROUP
FINANCIAL ANALYSIS &
BENCHMARKING
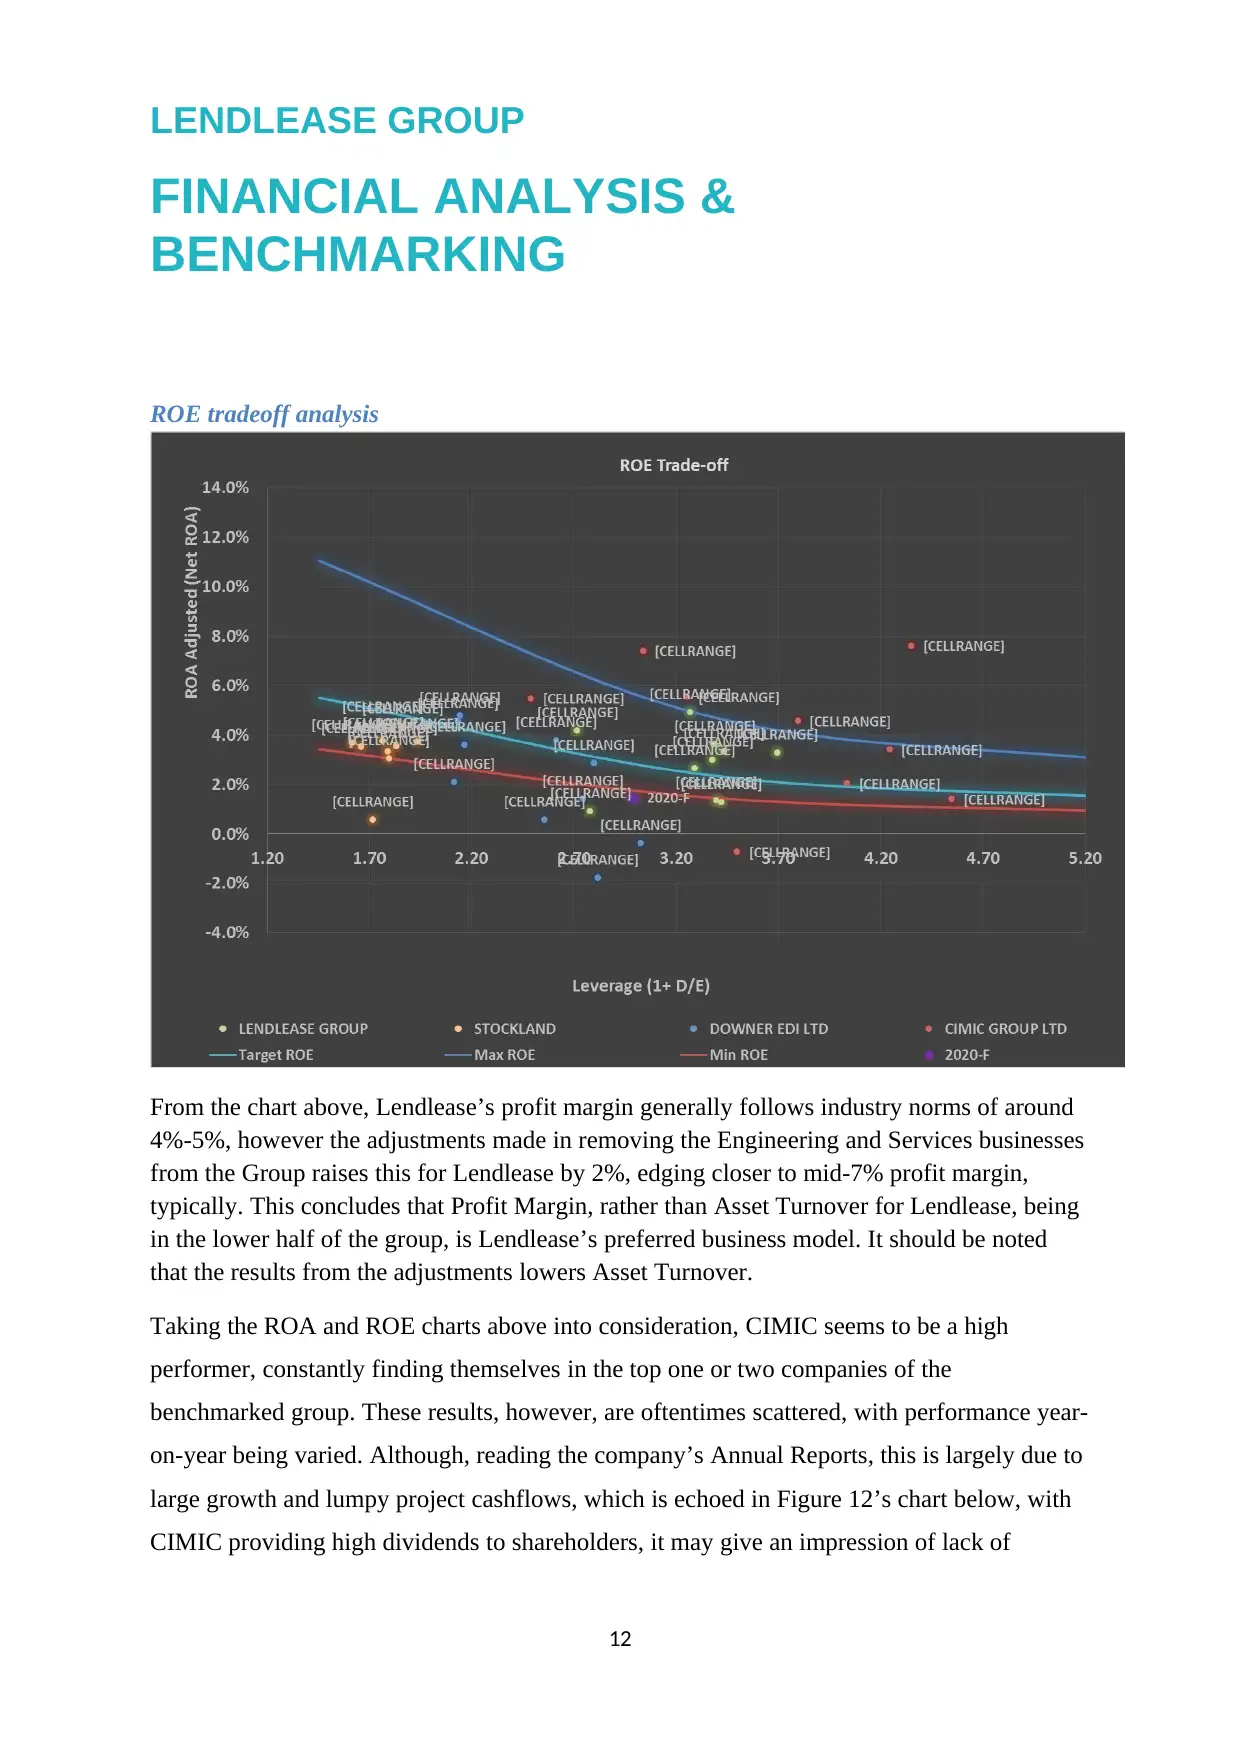
ROE tradeoff analysis
From the chart above, Lendlease’s profit margin generally follows industry norms of around
4%-5%, however the adjustments made in removing the Engineering and Services businesses
from the Group raises this for Lendlease by 2%, edging closer to mid-7% profit margin,
typically. This concludes that Profit Margin, rather than Asset Turnover for Lendlease, being
in the lower half of the group, is Lendlease’s preferred business model. It should be noted
that the results from the adjustments lowers Asset Turnover.
Taking the ROA and ROE charts above into consideration, CIMIC seems to be a high
performer, constantly finding themselves in the top one or two companies of the
benchmarked group. These results, however, are oftentimes scattered, with performance year-
on-year being varied. Although, reading the company’s Annual Reports, this is largely due to
large growth and lumpy project cashflows, which is echoed in Figure 12’s chart below, with
CIMIC providing high dividends to shareholders, it may give an impression of lack of
12
FINANCIAL ANALYSIS &
BENCHMARKING
ROE tradeoff analysis
From the chart above, Lendlease’s profit margin generally follows industry norms of around
4%-5%, however the adjustments made in removing the Engineering and Services businesses
from the Group raises this for Lendlease by 2%, edging closer to mid-7% profit margin,
typically. This concludes that Profit Margin, rather than Asset Turnover for Lendlease, being
in the lower half of the group, is Lendlease’s preferred business model. It should be noted
that the results from the adjustments lowers Asset Turnover.
Taking the ROA and ROE charts above into consideration, CIMIC seems to be a high
performer, constantly finding themselves in the top one or two companies of the
benchmarked group. These results, however, are oftentimes scattered, with performance year-
on-year being varied. Although, reading the company’s Annual Reports, this is largely due to
large growth and lumpy project cashflows, which is echoed in Figure 12’s chart below, with
CIMIC providing high dividends to shareholders, it may give an impression of lack of
12
⊘ This is a preview!⊘
Do you want full access?
Subscribe today to unlock all pages.
Trusted by 1+ million students worldwide
1 out of 18
Your All-in-One AI-Powered Toolkit for Academic Success.
+13062052269
info@desklib.com
Available 24*7 on WhatsApp / Email
![[object Object]](/_next/static/media/star-bottom.7253800d.svg)
Unlock your academic potential
Copyright © 2020–2026 A2Z Services. All Rights Reserved. Developed and managed by ZUCOL.