University Analysis: Financial Performance of Leon's Furniture Limited
VerifiedAdded on 2022/09/14
|9
|1273
|15
Report
AI Summary
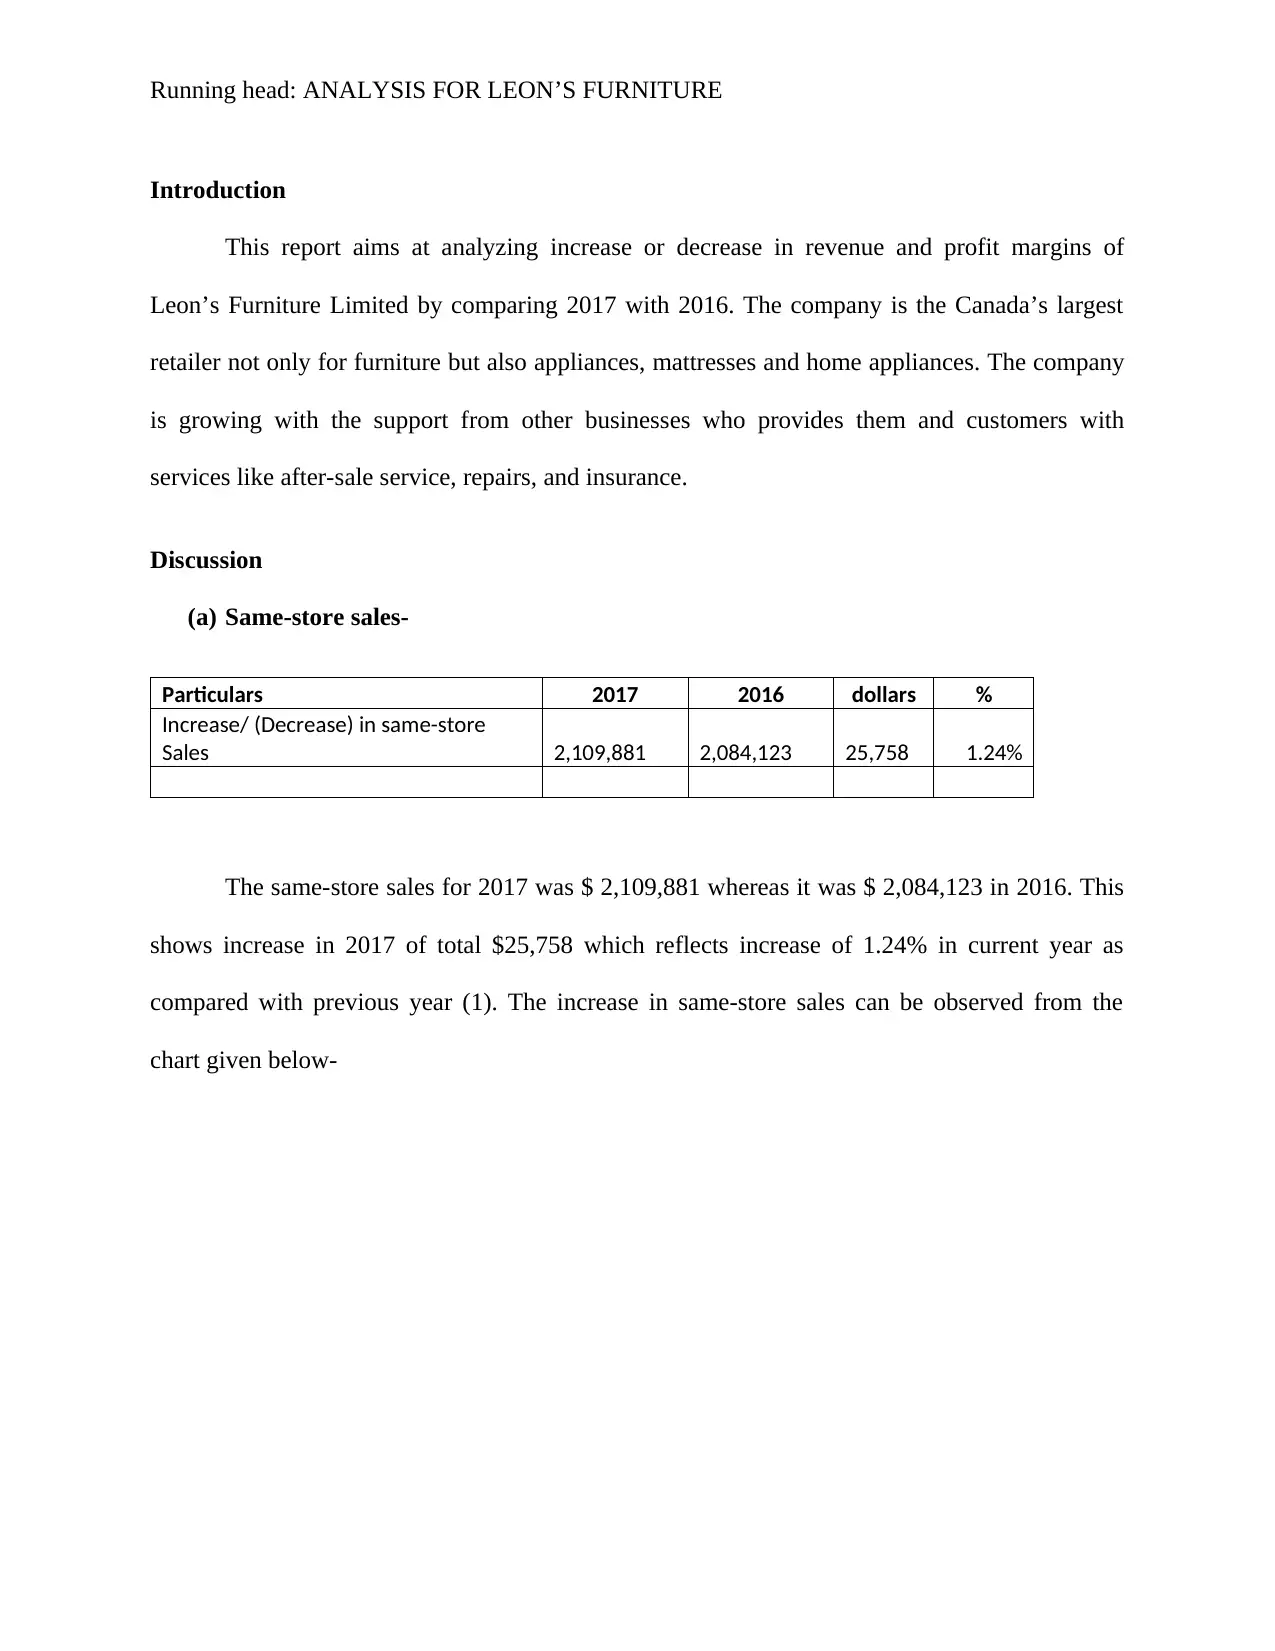
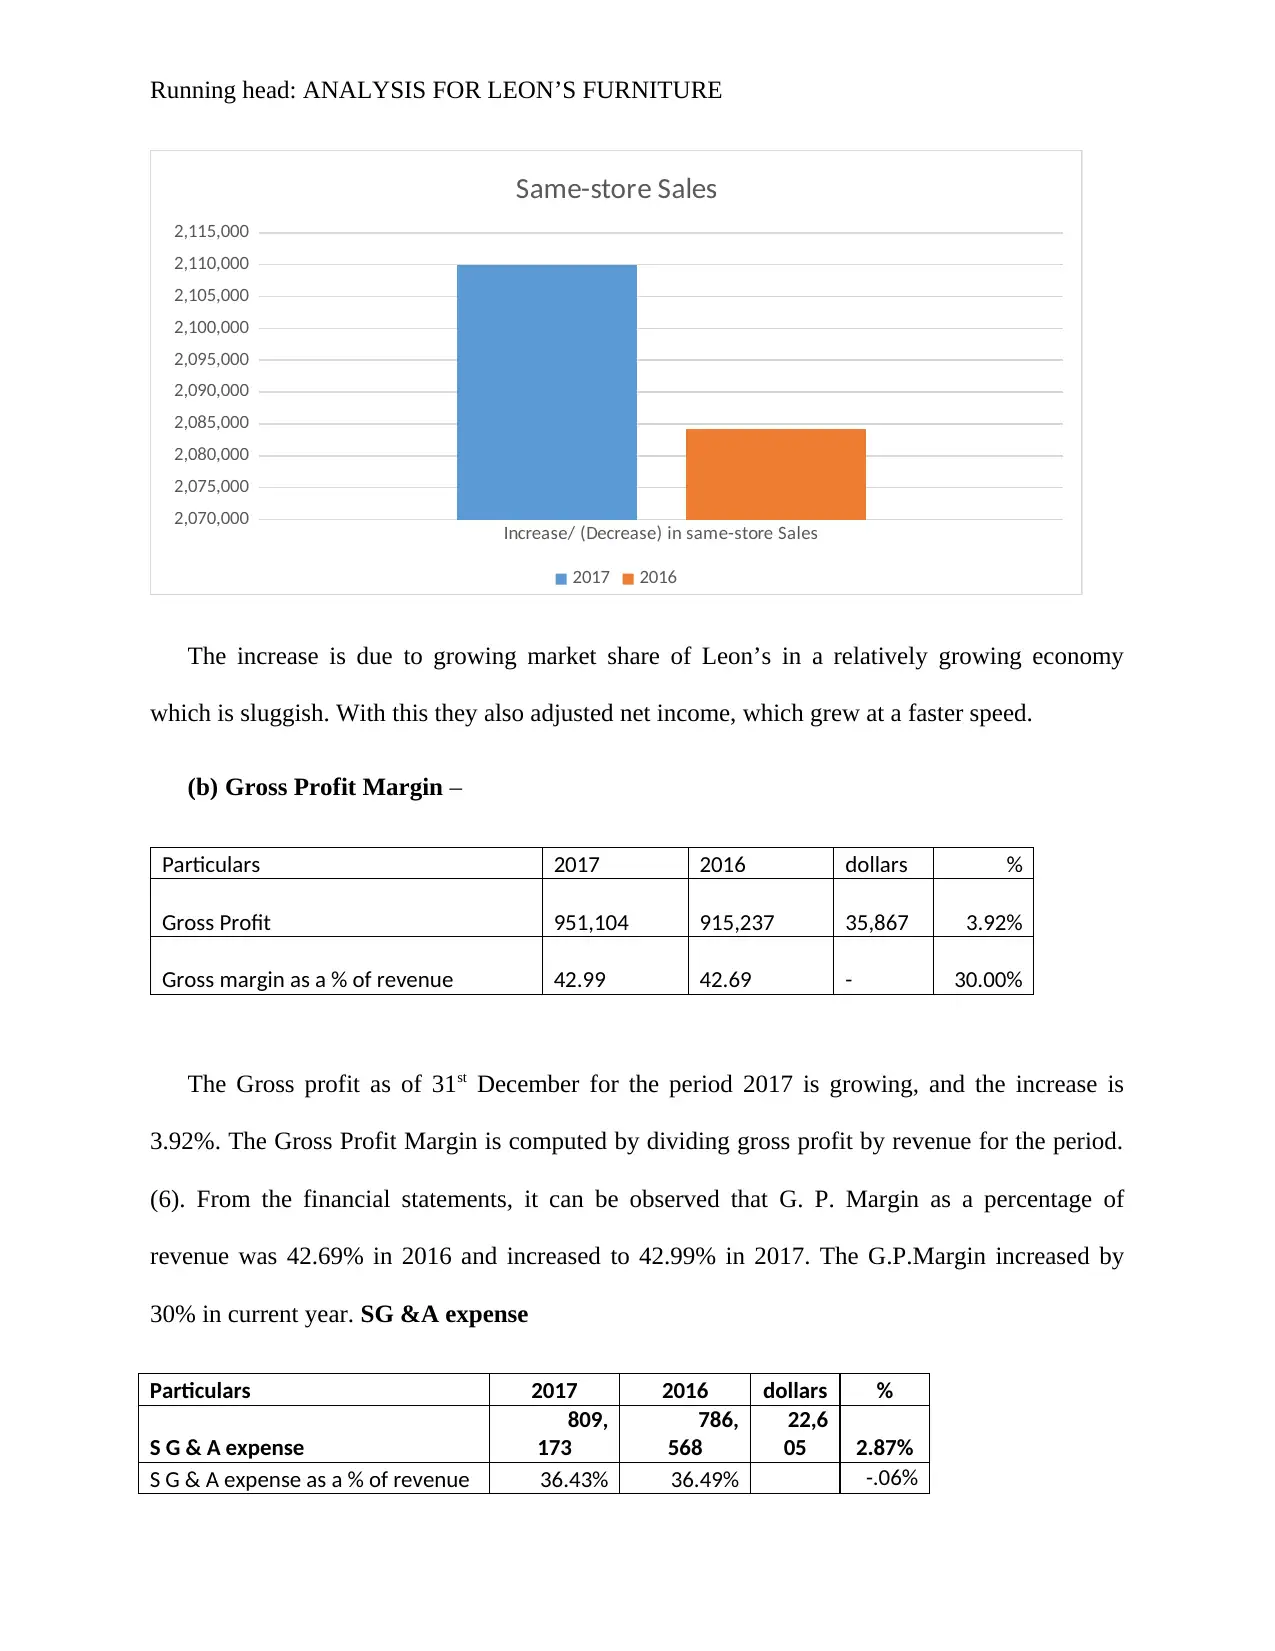
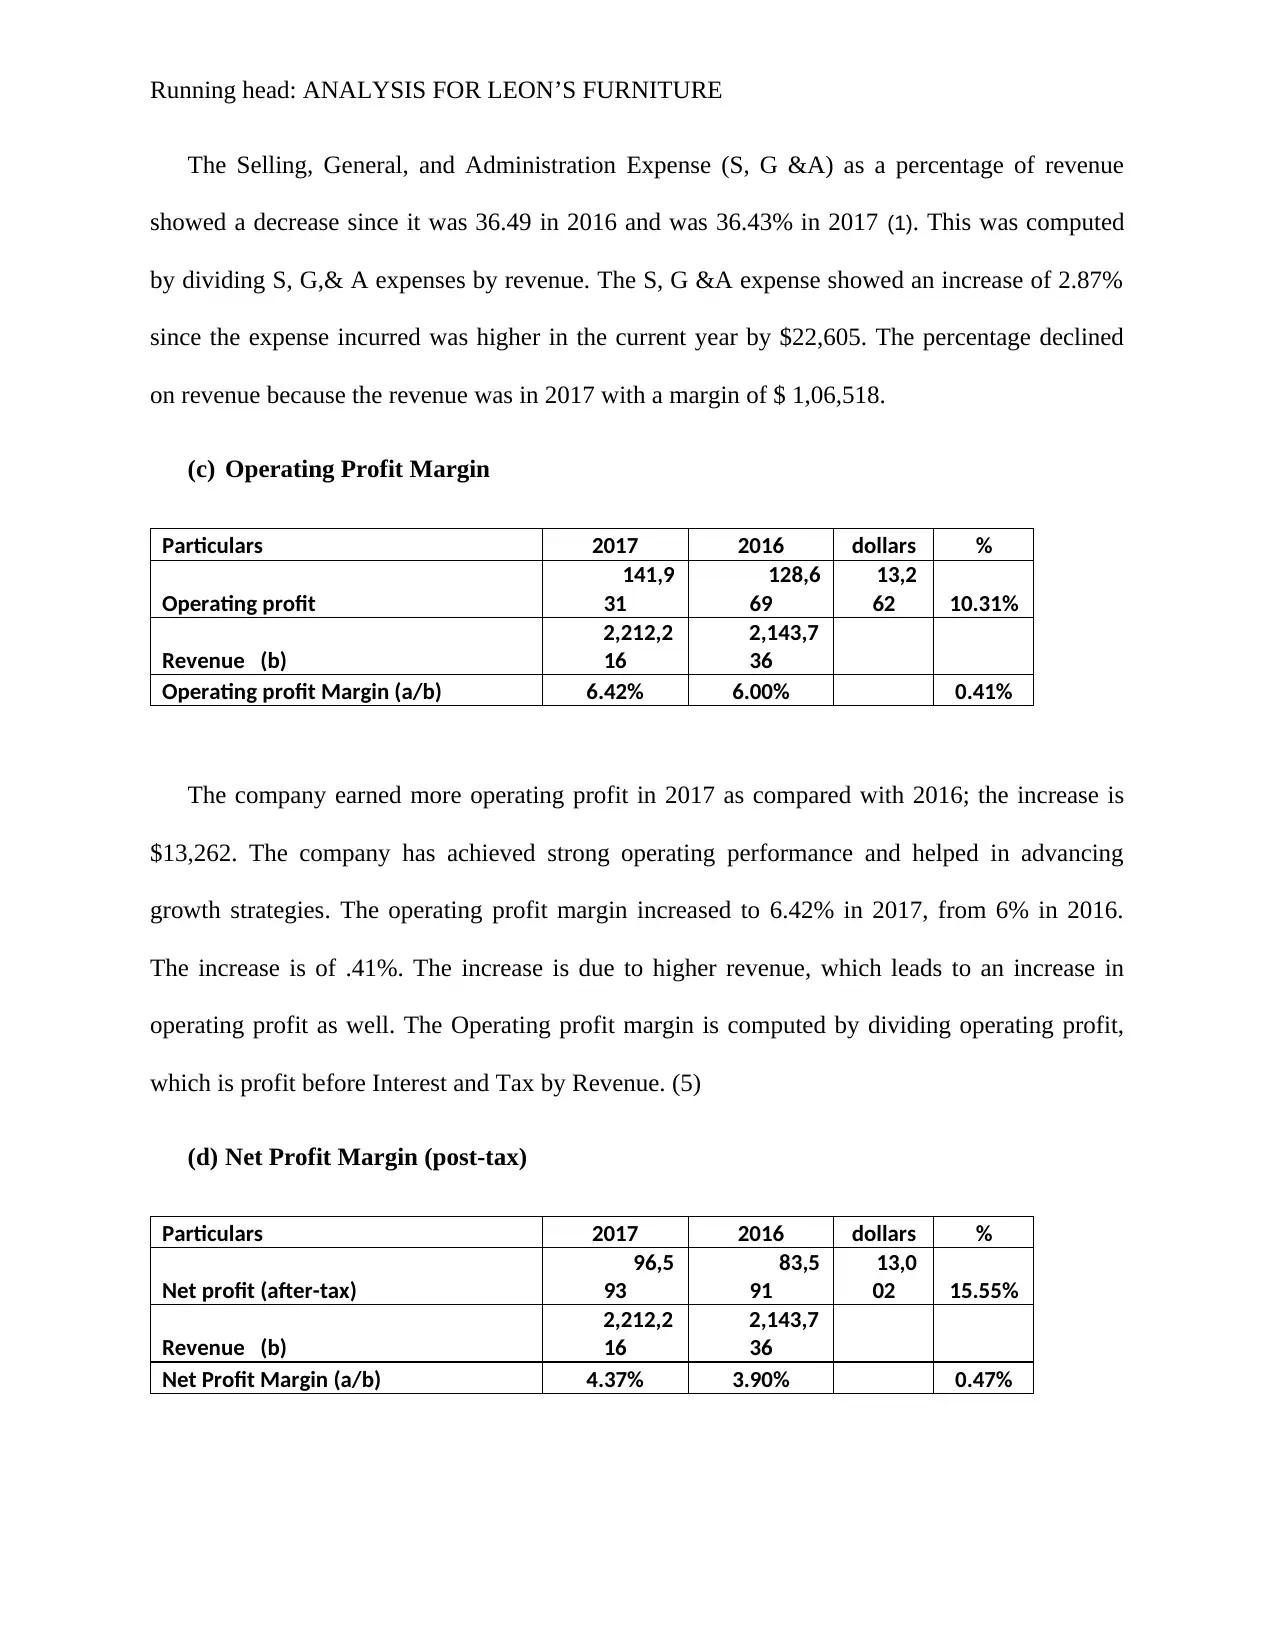
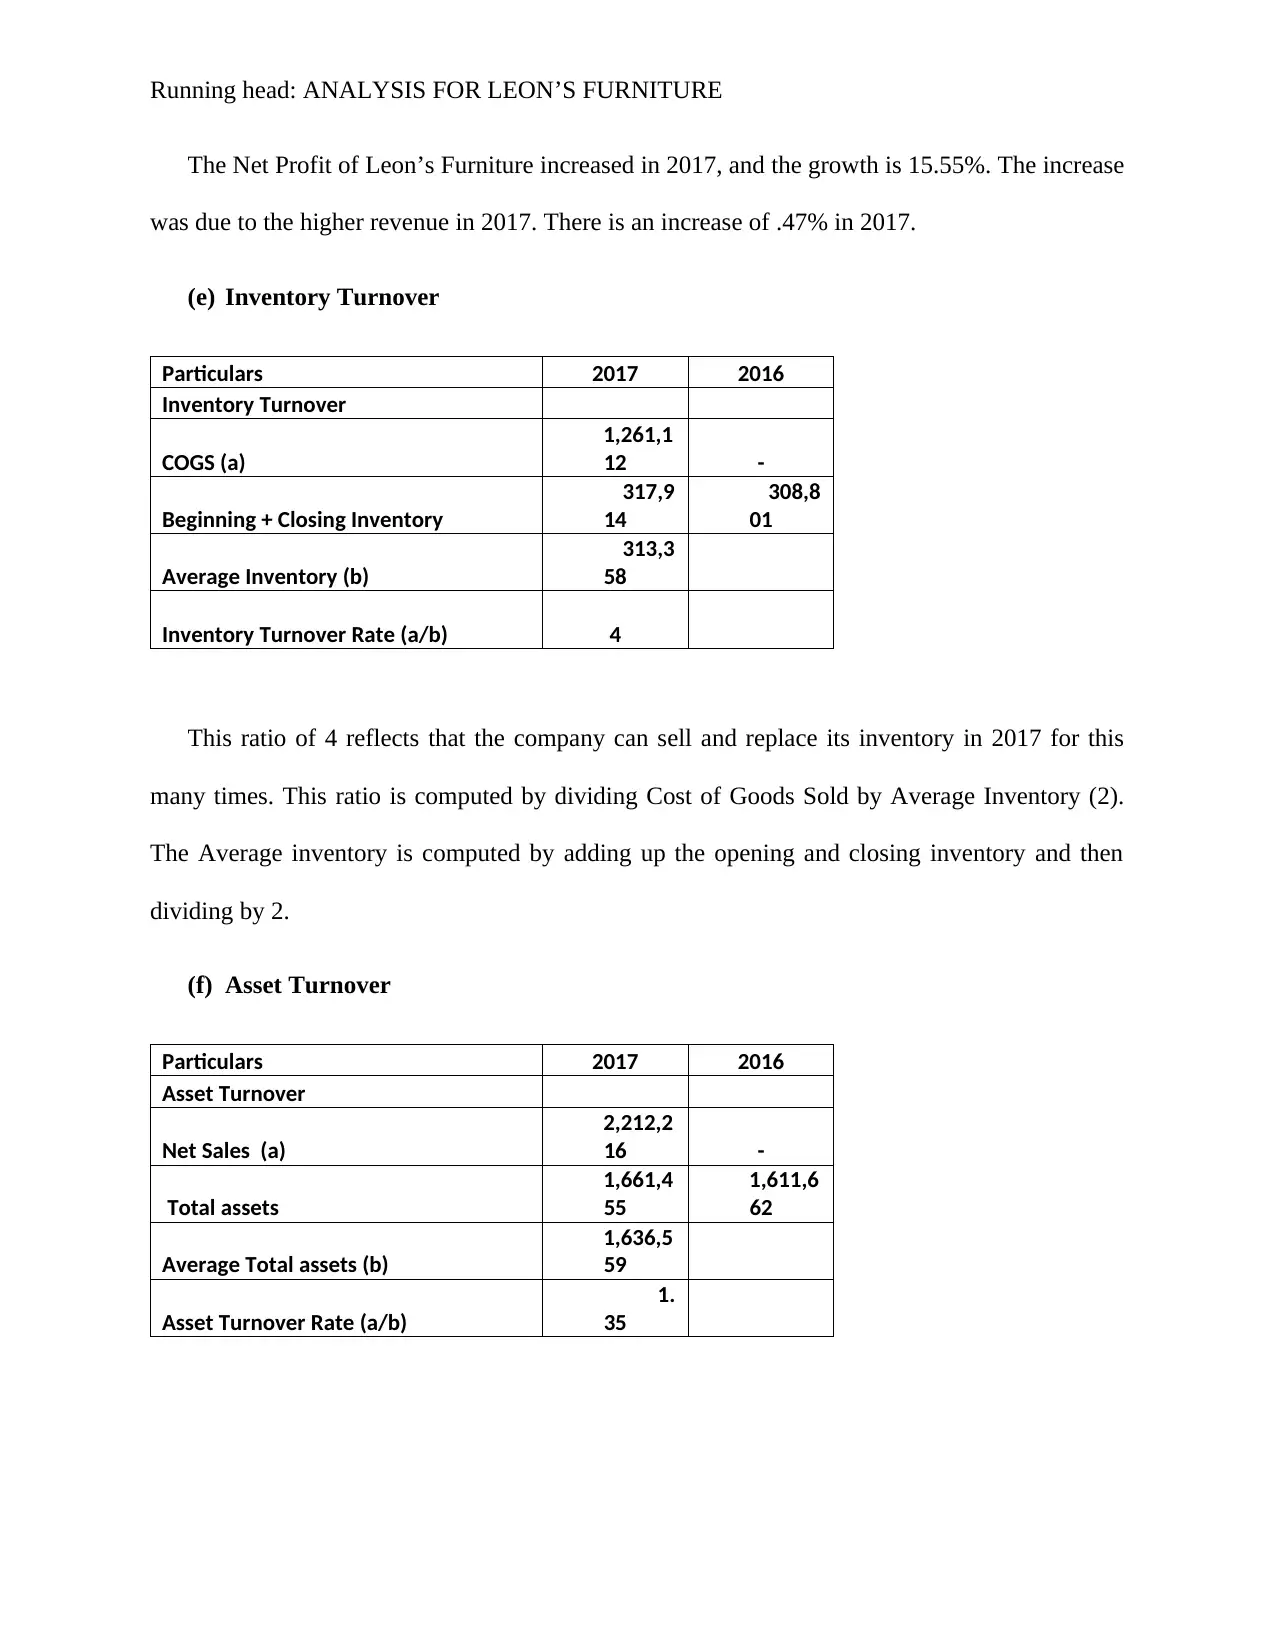
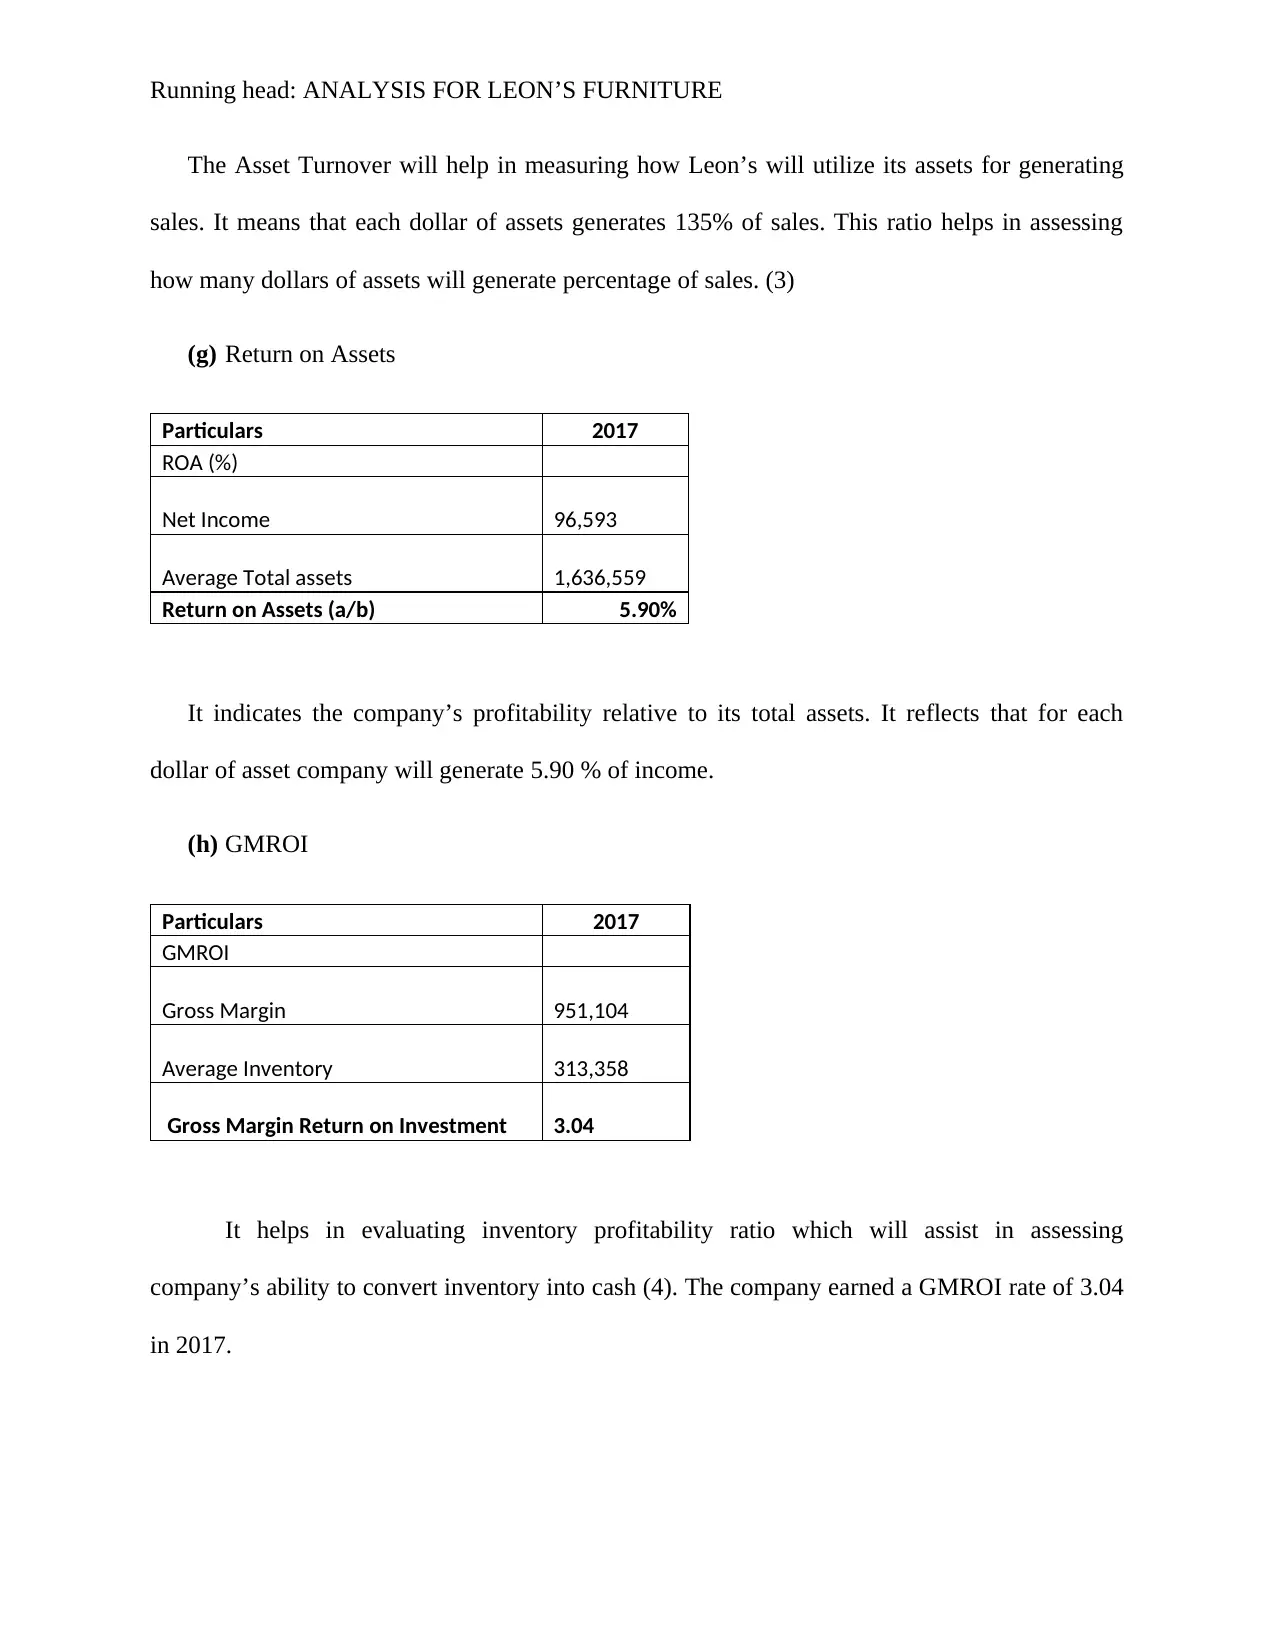
This report presents a financial analysis of Leon's Furniture Limited for the year 2017. The analysis compares the company's performance with the previous year and utilizes financial ratios to evaluate profitability and efficiency. Key metrics examined include same-store sales, gross profit margin, SG&A expense, operating profit margin, and net profit margin. The report also calculates and interprets inventory turnover, asset turnover, return on assets (ROA), and GMROI to assess the company's financial health and performance relative to its assets and inventory management. The findings indicate growth in revenue and profit margins, supported by detailed calculations and comparisons to the prior year's data, providing insights into Leon's Furniture's financial strategies and overall market position within the retail sector.

Running head: ANALYSIS FOR LEON’S FURNITURE
ANALYSIS FOR LEON’S FURNITURE
Name of the Student
Name of the University
Author note
ANALYSIS FOR LEON’S FURNITURE
Name of the Student
Name of the University
Author note
Paraphrase This Document
Need a fresh take? Get an instant paraphrase of this document with our AI Paraphraser

Running head: ANALYSIS FOR LEON’S FURNITURE
Executive Summary
This paper aims at analyzing the financial performance of Leon’s Furniture Limited for the
period 2017. The analysis is conducted by comparing the performance with previous year and by
conducting financial ratios. These ratios will help in evaluating profitability and measuring the
company’s efficiency.

Running head: ANALYSIS FOR LEON’S FURNITURE
Table of Contents
Introduction......................................................................................................................................4
Discussion........................................................................................................................................4
Conclusion.......................................................................................................................................8
References........................................................................................................................................9
⊘ This is a preview!⊘
Do you want full access?
Subscribe today to unlock all pages.

Trusted by 1+ million students worldwide

Running head: ANALYSIS FOR LEON’S FURNITURE
Introduction
This report aims at analyzing increase or decrease in revenue and profit margins of
Leon’s Furniture Limited by comparing 2017 with 2016. The company is the Canada’s largest
retailer not only for furniture but also appliances, mattresses and home appliances. The company
is growing with the support from other businesses who provides them and customers with
services like after-sale service, repairs, and insurance.
Discussion
(a) Same-store sales-
Particulars 2017 2016 dollars %
Increase/ (Decrease) in same-store
Sales 2,109,881 2,084,123 25,758 1.24%
The same-store sales for 2017 was $ 2,109,881 whereas it was $ 2,084,123 in 2016. This
shows increase in 2017 of total $25,758 which reflects increase of 1.24% in current year as
compared with previous year (1). The increase in same-store sales can be observed from the
chart given below-
Paraphrase This Document
Need a fresh take? Get an instant paraphrase of this document with our AI Paraphraser

Running head: ANALYSIS FOR LEON’S FURNITURE
Increase/ (Decrease) in same-store Sales
2,070,000
2,075,000
2,080,000
2,085,000
2,090,000
2,095,000
2,100,000
2,105,000
2,110,000
2,115,000
Same-store Sales
2017 2016
The increase is due to growing market share of Leon’s in a relatively growing economy
which is sluggish. With this they also adjusted net income, which grew at a faster speed.
(b) Gross Profit Margin –
Particulars 2017 2016 dollars %
Gross Profit 951,104 915,237 35,867 3.92%
Gross margin as a % of revenue 42.99 42.69 - 30.00%
The Gross profit as of 31st December for the period 2017 is growing, and the increase is
3.92%. The Gross Profit Margin is computed by dividing gross profit by revenue for the period.
(6). From the financial statements, it can be observed that G. P. Margin as a percentage of
revenue was 42.69% in 2016 and increased to 42.99% in 2017. The G.P.Margin increased by
30% in current year. SG &A expense
Particulars 2017 2016 dollars %
S G & A expense
809,
173
786,
568
22,6
05 2.87%
S G & A expense as a % of revenue 36.43% 36.49% -.06%

Running head: ANALYSIS FOR LEON’S FURNITURE
The Selling, General, and Administration Expense (S, G &A) as a percentage of revenue
showed a decrease since it was 36.49 in 2016 and was 36.43% in 2017 (1). This was computed
by dividing S, G,& A expenses by revenue. The S, G &A expense showed an increase of 2.87%
since the expense incurred was higher in the current year by $22,605. The percentage declined
on revenue because the revenue was in 2017 with a margin of $ 1,06,518.
(c) Operating Profit Margin
Particulars 2017 2016 dollars %
Operating profit
141,9
31
128,6
69
13,2
62 10.31%
Revenue (b)
2,212,2
16
2,143,7
36
Operating profit Margin (a/b) 6.42% 6.00% 0.41%
The company earned more operating profit in 2017 as compared with 2016; the increase is
$13,262. The company has achieved strong operating performance and helped in advancing
growth strategies. The operating profit margin increased to 6.42% in 2017, from 6% in 2016.
The increase is of .41%. The increase is due to higher revenue, which leads to an increase in
operating profit as well. The Operating profit margin is computed by dividing operating profit,
which is profit before Interest and Tax by Revenue. (5)
(d) Net Profit Margin (post-tax)
Particulars 2017 2016 dollars %
Net profit (after-tax)
96,5
93
83,5
91
13,0
02 15.55%
Revenue (b)
2,212,2
16
2,143,7
36
Net Profit Margin (a/b) 4.37% 3.90% 0.47%
⊘ This is a preview!⊘
Do you want full access?
Subscribe today to unlock all pages.

Trusted by 1+ million students worldwide

Running head: ANALYSIS FOR LEON’S FURNITURE
The Net Profit of Leon’s Furniture increased in 2017, and the growth is 15.55%. The increase
was due to the higher revenue in 2017. There is an increase of .47% in 2017.
(e) Inventory Turnover
Particulars 2017 2016
Inventory Turnover
COGS (a)
1,261,1
12 -
Beginning + Closing Inventory
317,9
14
308,8
01
Average Inventory (b)
313,3
58
Inventory Turnover Rate (a/b) 4
This ratio of 4 reflects that the company can sell and replace its inventory in 2017 for this
many times. This ratio is computed by dividing Cost of Goods Sold by Average Inventory (2).
The Average inventory is computed by adding up the opening and closing inventory and then
dividing by 2.
(f) Asset Turnover
Particulars 2017 2016
Asset Turnover
Net Sales (a)
2,212,2
16 -
Total assets
1,661,4
55
1,611,6
62
Average Total assets (b)
1,636,5
59
Asset Turnover Rate (a/b)
1.
35
Paraphrase This Document
Need a fresh take? Get an instant paraphrase of this document with our AI Paraphraser

Running head: ANALYSIS FOR LEON’S FURNITURE
The Asset Turnover will help in measuring how Leon’s will utilize its assets for generating
sales. It means that each dollar of assets generates 135% of sales. This ratio helps in assessing
how many dollars of assets will generate percentage of sales. (3)
(g) Return on Assets
Particulars 2017
ROA (%)
Net Income 96,593
Average Total assets 1,636,559
Return on Assets (a/b) 5.90%
It indicates the company’s profitability relative to its total assets. It reflects that for each
dollar of asset company will generate 5.90 % of income.
(h) GMROI
Particulars 2017
GMROI
Gross Margin 951,104
Average Inventory 313,358
Gross Margin Return on Investment 3.04
It helps in evaluating inventory profitability ratio which will assist in assessing
company’s ability to convert inventory into cash (4). The company earned a GMROI rate of 3.04
in 2017.

Running head: ANALYSIS FOR LEON’S FURNITURE
Conclusion
Therefore it is to be concluded that the financial of the company has shown growth in
2017. The revenue of the company along with its profit margin has shown growth.
References
1. Leon's. Leon's [Internet]. Leon's. 2020 [cited 5 April 2020]. Available from: https://www.leons.ca/
2. Sunjoko MI, Arilyn EJ. Effects of inventory turnover, total asset turnover, fixed asset turnover,
current ratio and average collection period on profitability. Jurnal Bisnis dan Akuntansi.
2016;18(1):79-83.
3. Mahmudin M, Lau EA, Tandirerung B. THE EFFECT OF CURRENT RATIO (CR), DEBT TO
EQUITY RATIO (DER), TOTAL ASSET TURNOVER (TAT) AND FIRMS SIZE (FS) TO RETURN
ON EQUITY (ROE) IN MINING COMPANIES LISTED ON THE INDONESIA STOCK
EXCHANGE IN 2013-2018. Research Journal of Accounting and Business Management. 2019
Dec 31;3(2):297-312.
4. Zentes J, Morschett D, Schramm-Klein H. Monitoring Operational and Financial Performance.
InStrategic Retail Management 2017 (pp. 441-461). Springer Gabler, Wiesbaden.
5. Langemeier M, Yeager E. Operating Profit Margin Benchmarks. farmdoc daily. 2018 Aug 24;8.
6. Poonawala SH, Nagar N. Gross profit manipulation through classification shifting. Journal of
Business Research. 2019 Jan 1;94:81-8.
7. Chowdhury M. Performance Measures through Financial Ratio Analysis of (Doctoral dissertation,
Daffodil International University).
⊘ This is a preview!⊘
Do you want full access?
Subscribe today to unlock all pages.

Trusted by 1+ million students worldwide
1 out of 9
Related Documents
Your All-in-One AI-Powered Toolkit for Academic Success.
+13062052269
info@desklib.com
Available 24*7 on WhatsApp / Email
Unlock your academic potential
Copyright © 2020–2025 A2Z Services. All Rights Reserved. Developed and managed by ZUCOL.


