Level 7 Strategic Financial Management Project Report - Unit 05
VerifiedAdded on 2023/01/18
|30
|9029
|22
Project
AI Summary
This project report, prepared for a Level 7 Strategic Financial Management course, delves into various aspects of financial management. It begins with a memo analyzing a company's financial performance using ratio analysis, focusing on profitability, asset efficiency, liquidity, capital structure, and market ratios. The report then explores sources of funding, differentiating between short-term and long-term options, and evaluating their pros and cons. The analysis includes bank overdrafts, customer advances, treasury bills, commercial paper, and loans, among others. Furthermore, the report investigates cost evaluation and accounting tools, emphasizing their importance in decision-making. It provides recommendations for improving costing and pricing systems, and proposes organizational decisions based on financial statement analysis. The project also includes an appendix with detailed financial data and calculations, supporting the recommendations made throughout the report. Overall, the report offers a comprehensive overview of strategic financial management principles and practices, with a focus on practical application.
Running Head: Strategic Financial Management
1
Project Report: Strategic Financial Management
1
Project Report: Strategic Financial Management
Paraphrase This Document
Need a fresh take? Get an instant paraphrase of this document with our AI Paraphraser
Strategic Financial Management 2
Contents
Task 1: Memo...................................................................................................................3
Task 2................................................................................................................................5
Introduction...................................................................................................................5
Source of funding.........................................................................................................5
Recommendation and conclusion.................................................................................8
Task 3................................................................................................................................9
Introduction...................................................................................................................9
Cost verified from financial statement.........................................................................9
Importance of cost accounting....................................................................................10
Tools of costing design and costing system...............................................................10
Recommendation........................................................................................................11
References.......................................................................................................................13
Appendix.........................................................................................................................15
Question 1...................................................................................................................15
Question 2...................................................................................................................18
Question 3...................................................................................................................20
Strategic Financial Management 3
Task 1: Memo
To client,
42, south down lane, UAE
Dear Sir,
Hope you are doing well!
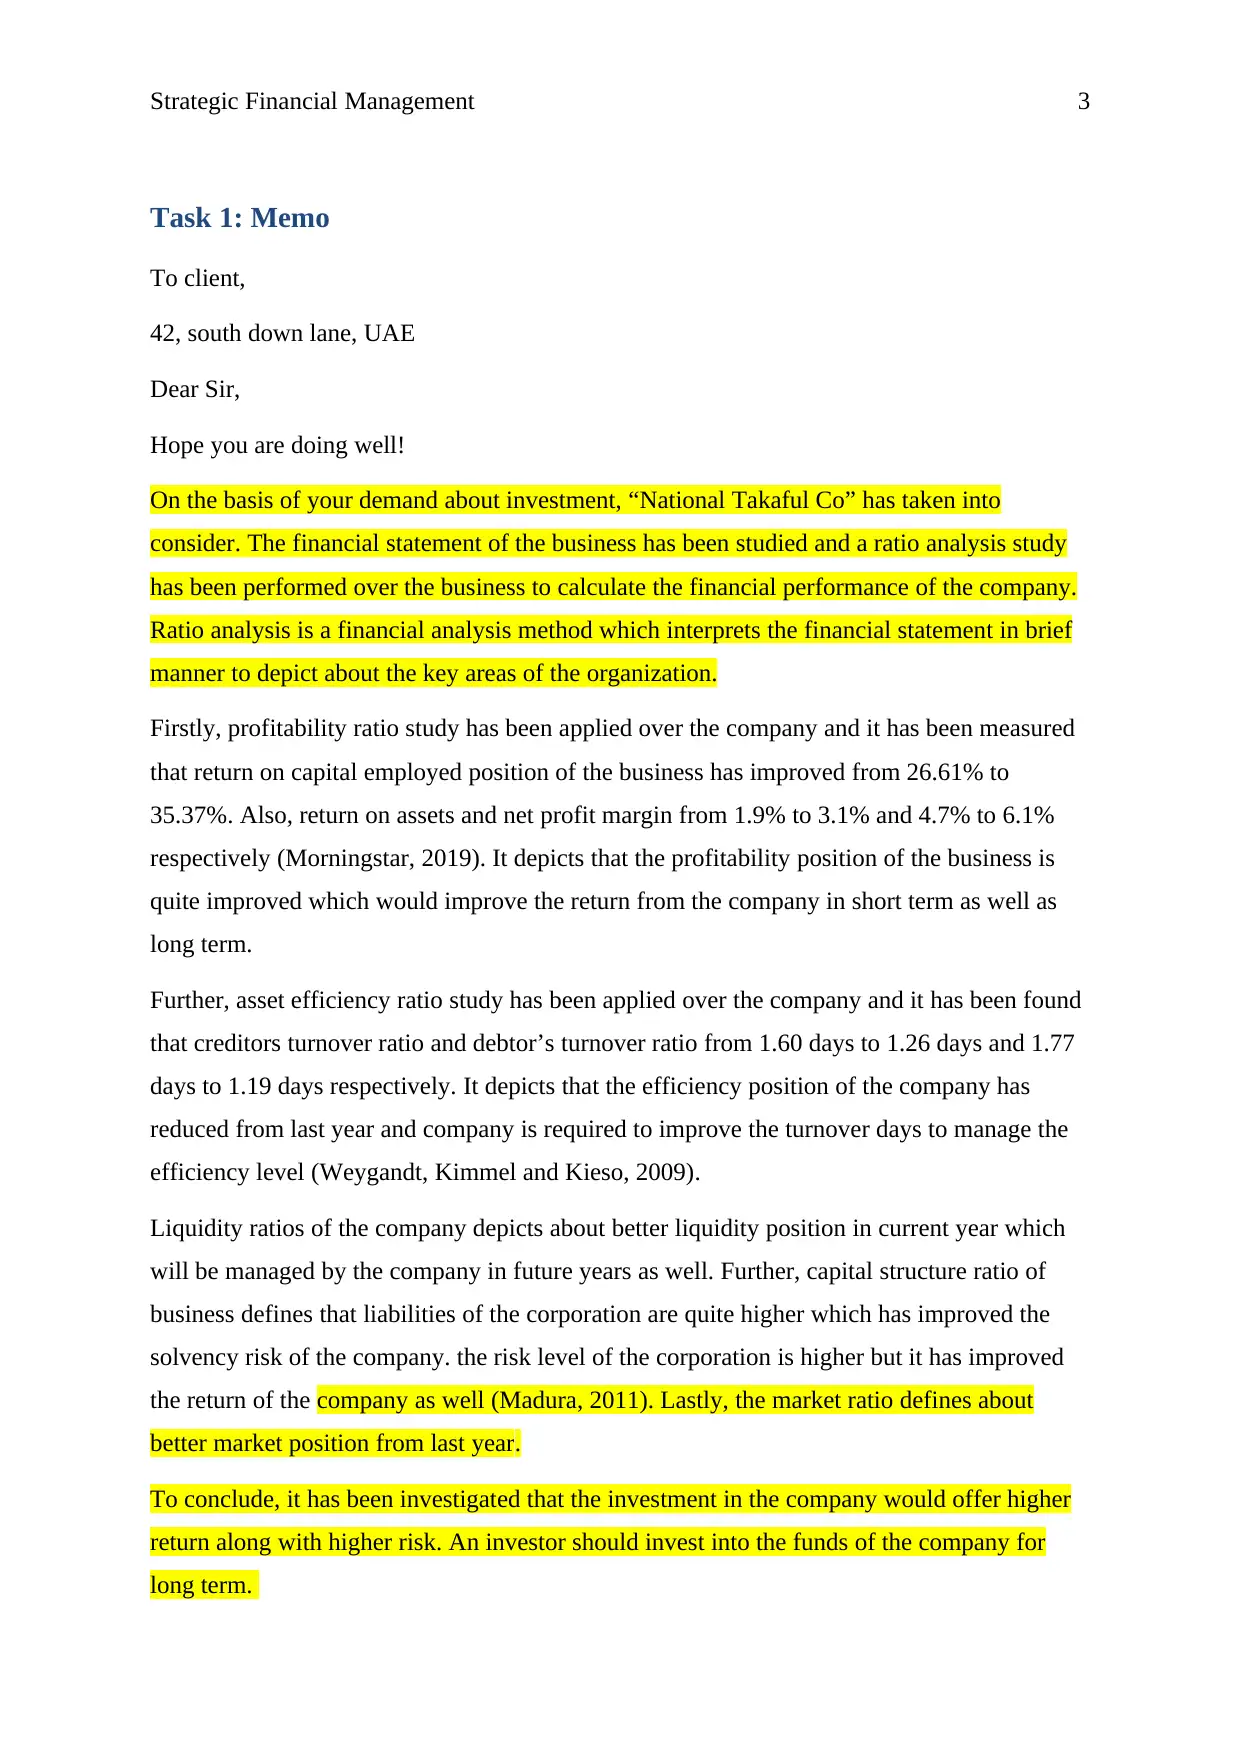
On the basis of your demand about investment, “National Takaful Co” has taken into
consider. The financial statement of the business has been studied and a ratio analysis study
has been performed over the business to calculate the financial performance of the company.
Ratio analysis is a financial analysis method which interprets the financial statement in brief
manner to depict about the key areas of the organization.
Firstly, profitability ratio study has been applied over the company and it has been measured
that return on capital employed position of the business has improved from 26.61% to
35.37%. Also, return on assets and net profit margin from 1.9% to 3.1% and 4.7% to 6.1%
respectively (Morningstar, 2019). It depicts that the profitability position of the business is
quite improved which would improve the return from the company in short term as well as
long term.
Further, asset efficiency ratio study has been applied over the company and it has been found
that creditors turnover ratio and debtor’s turnover ratio from 1.60 days to 1.26 days and 1.77
days to 1.19 days respectively. It depicts that the efficiency position of the company has
reduced from last year and company is required to improve the turnover days to manage the
efficiency level (Weygandt, Kimmel and Kieso, 2009).
Liquidity ratios of the company depicts about better liquidity position in current year which
will be managed by the company in future years as well. Further, capital structure ratio of
business defines that liabilities of the corporation are quite higher which has improved the
solvency risk of the company. the risk level of the corporation is higher but it has improved
the return of the company as well (Madura, 2011). Lastly, the market ratio defines about
better market position from last year.
To conclude, it has been investigated that the investment in the company would offer higher
return along with higher risk. An investor should invest into the funds of the company for
long term.
Task 1: Memo
To client,
42, south down lane, UAE
Dear Sir,
Hope you are doing well!
On the basis of your demand about investment, “National Takaful Co” has taken into
consider. The financial statement of the business has been studied and a ratio analysis study
has been performed over the business to calculate the financial performance of the company.
Ratio analysis is a financial analysis method which interprets the financial statement in brief
manner to depict about the key areas of the organization.
Firstly, profitability ratio study has been applied over the company and it has been measured
that return on capital employed position of the business has improved from 26.61% to
35.37%. Also, return on assets and net profit margin from 1.9% to 3.1% and 4.7% to 6.1%
respectively (Morningstar, 2019). It depicts that the profitability position of the business is
quite improved which would improve the return from the company in short term as well as
long term.
Further, asset efficiency ratio study has been applied over the company and it has been found
that creditors turnover ratio and debtor’s turnover ratio from 1.60 days to 1.26 days and 1.77
days to 1.19 days respectively. It depicts that the efficiency position of the company has
reduced from last year and company is required to improve the turnover days to manage the
efficiency level (Weygandt, Kimmel and Kieso, 2009).
Liquidity ratios of the company depicts about better liquidity position in current year which
will be managed by the company in future years as well. Further, capital structure ratio of
business defines that liabilities of the corporation are quite higher which has improved the
solvency risk of the company. the risk level of the corporation is higher but it has improved
the return of the company as well (Madura, 2011). Lastly, the market ratio defines about
better market position from last year.
To conclude, it has been investigated that the investment in the company would offer higher
return along with higher risk. An investor should invest into the funds of the company for
long term.
⊘ This is a preview!⊘
Do you want full access?
Subscribe today to unlock all pages.
Trusted by 1+ million students worldwide

Strategic Financial Management 4
Paraphrase This Document
Need a fresh take? Get an instant paraphrase of this document with our AI Paraphraser
Strategic Financial Management 5
Task 2:
Introduction:
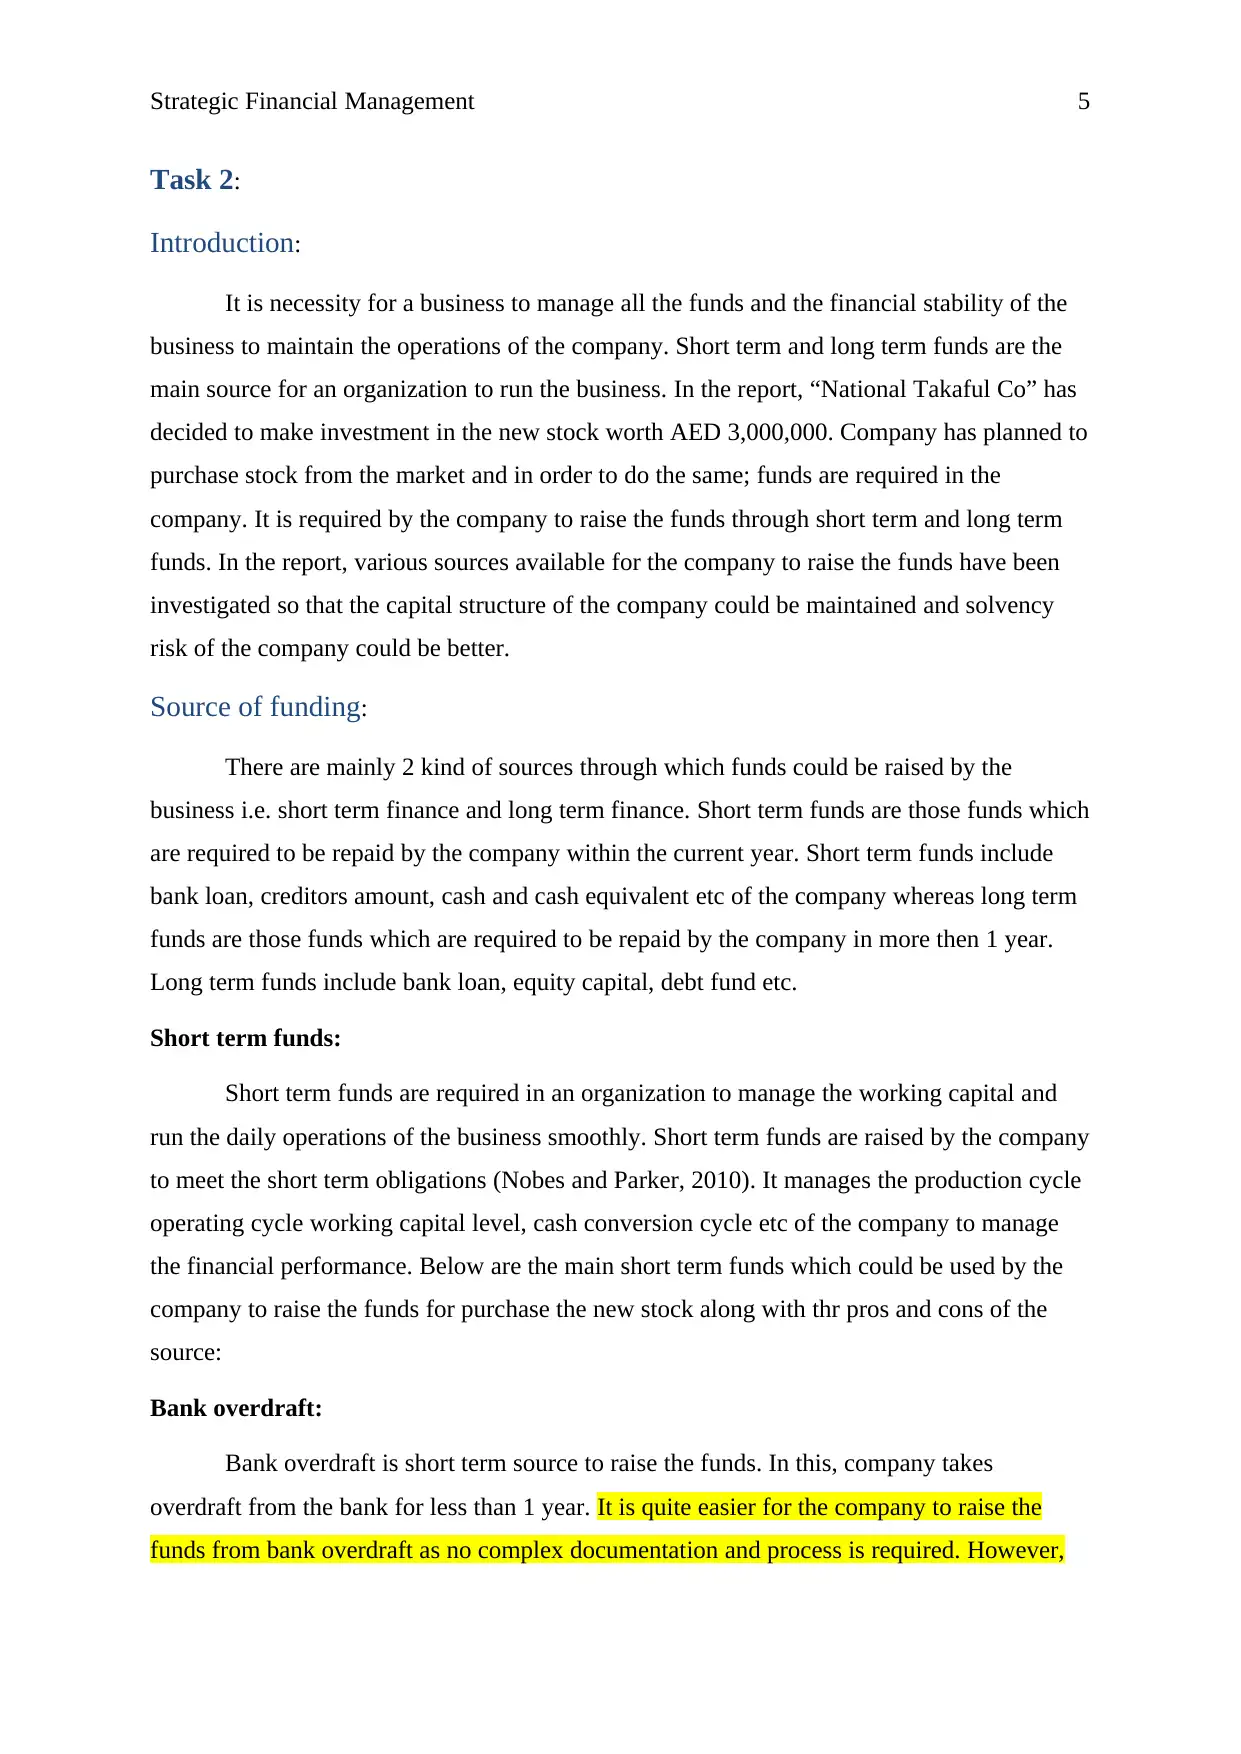
It is necessity for a business to manage all the funds and the financial stability of the
business to maintain the operations of the company. Short term and long term funds are the
main source for an organization to run the business. In the report, “National Takaful Co” has
decided to make investment in the new stock worth AED 3,000,000. Company has planned to
purchase stock from the market and in order to do the same; funds are required in the
company. It is required by the company to raise the funds through short term and long term
funds. In the report, various sources available for the company to raise the funds have been
investigated so that the capital structure of the company could be maintained and solvency
risk of the company could be better.
Source of funding:
There are mainly 2 kind of sources through which funds could be raised by the
business i.e. short term finance and long term finance. Short term funds are those funds which
are required to be repaid by the company within the current year. Short term funds include
bank loan, creditors amount, cash and cash equivalent etc of the company whereas long term
funds are those funds which are required to be repaid by the company in more then 1 year.
Long term funds include bank loan, equity capital, debt fund etc.
Short term funds:
Short term funds are required in an organization to manage the working capital and
run the daily operations of the business smoothly. Short term funds are raised by the company
to meet the short term obligations (Nobes and Parker, 2010). It manages the production cycle
operating cycle working capital level, cash conversion cycle etc of the company to manage
the financial performance. Below are the main short term funds which could be used by the
company to raise the funds for purchase the new stock along with thr pros and cons of the
source:
Bank overdraft:
Bank overdraft is short term source to raise the funds. In this, company takes
overdraft from the bank for less than 1 year. It is quite easier for the company to raise the
funds from bank overdraft as no complex documentation and process is required. However,
Task 2:
Introduction:
It is necessity for a business to manage all the funds and the financial stability of the
business to maintain the operations of the company. Short term and long term funds are the
main source for an organization to run the business. In the report, “National Takaful Co” has
decided to make investment in the new stock worth AED 3,000,000. Company has planned to
purchase stock from the market and in order to do the same; funds are required in the
company. It is required by the company to raise the funds through short term and long term
funds. In the report, various sources available for the company to raise the funds have been
investigated so that the capital structure of the company could be maintained and solvency
risk of the company could be better.
Source of funding:
There are mainly 2 kind of sources through which funds could be raised by the
business i.e. short term finance and long term finance. Short term funds are those funds which
are required to be repaid by the company within the current year. Short term funds include
bank loan, creditors amount, cash and cash equivalent etc of the company whereas long term
funds are those funds which are required to be repaid by the company in more then 1 year.
Long term funds include bank loan, equity capital, debt fund etc.
Short term funds:
Short term funds are required in an organization to manage the working capital and
run the daily operations of the business smoothly. Short term funds are raised by the company
to meet the short term obligations (Nobes and Parker, 2010). It manages the production cycle
operating cycle working capital level, cash conversion cycle etc of the company to manage
the financial performance. Below are the main short term funds which could be used by the
company to raise the funds for purchase the new stock along with thr pros and cons of the
source:
Bank overdraft:
Bank overdraft is short term source to raise the funds. In this, company takes
overdraft from the bank for less than 1 year. It is quite easier for the company to raise the
funds from bank overdraft as no complex documentation and process is required. However,
Strategic Financial Management 6
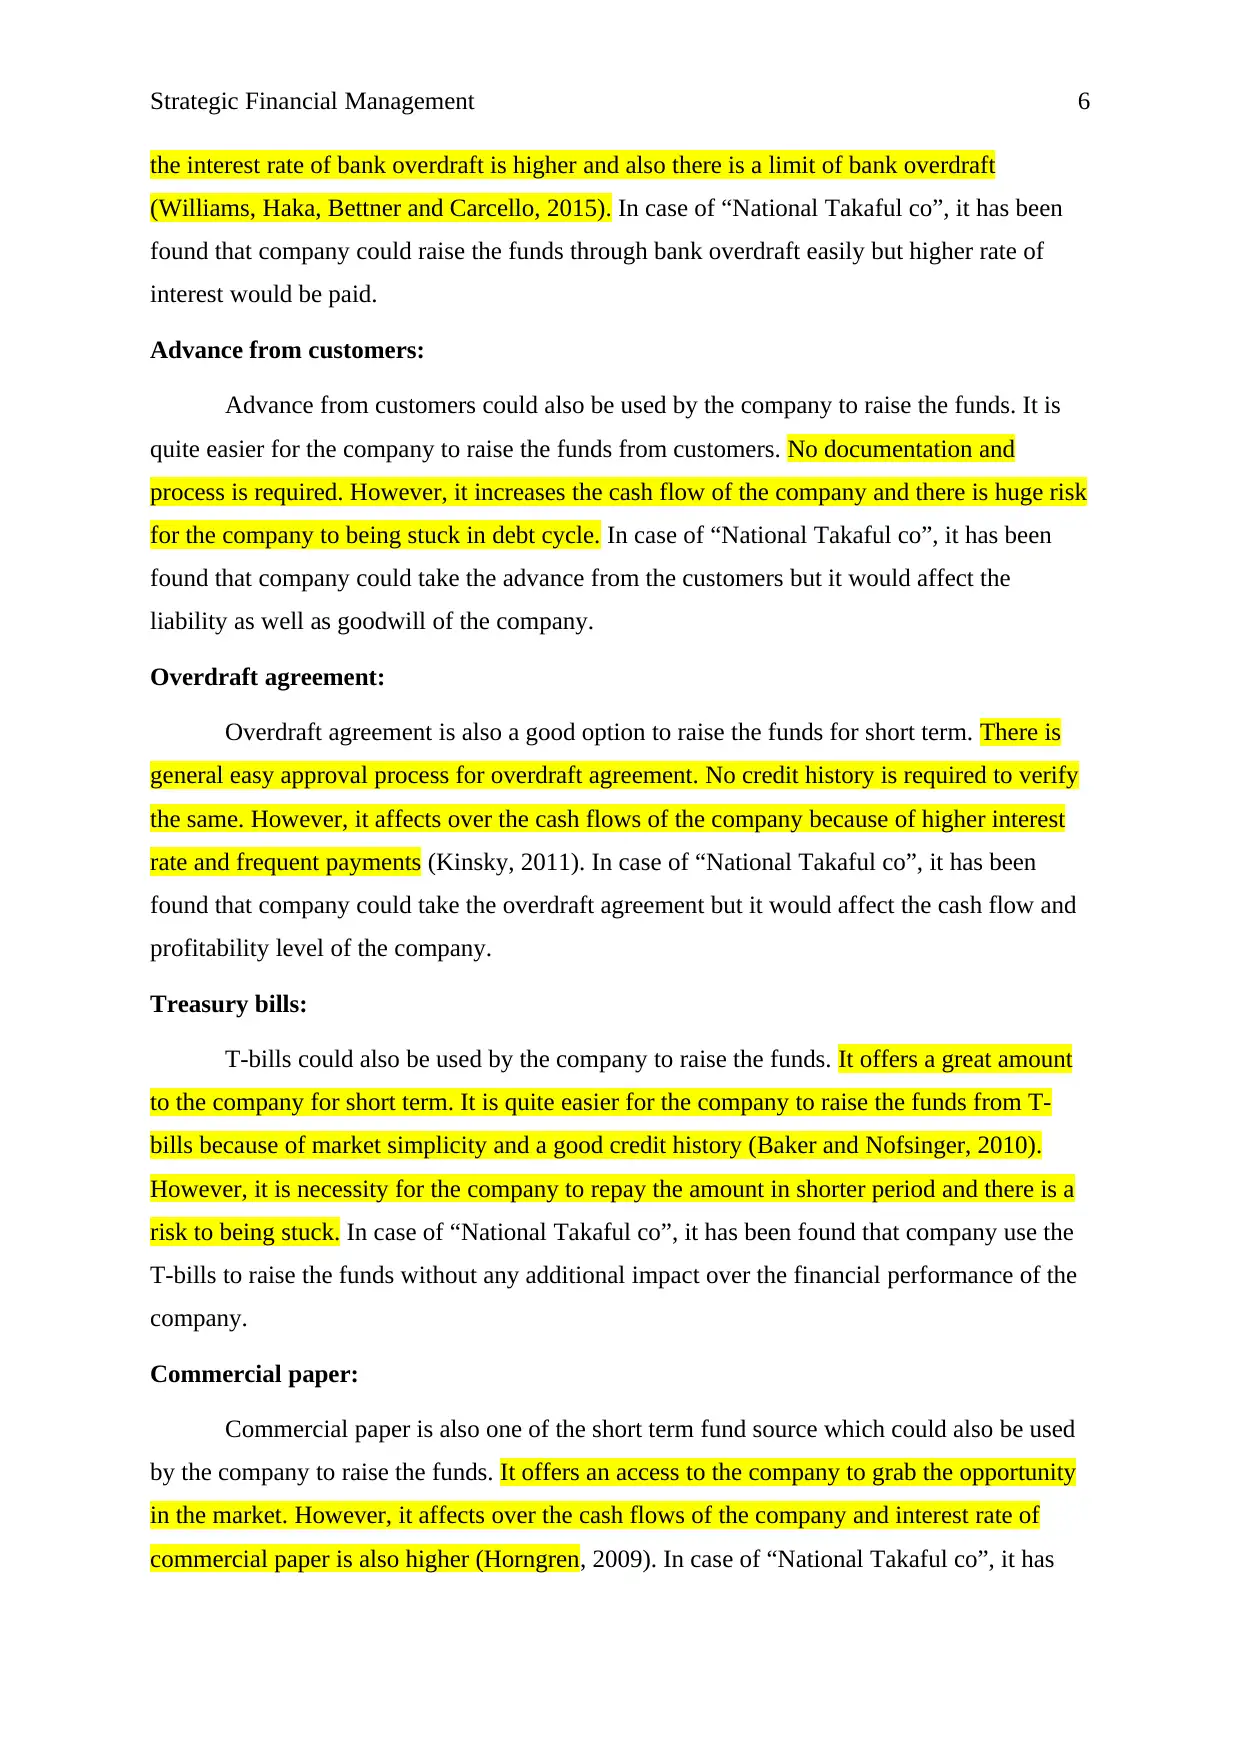
the interest rate of bank overdraft is higher and also there is a limit of bank overdraft
(Williams, Haka, Bettner and Carcello, 2015). In case of “National Takaful co”, it has been
found that company could raise the funds through bank overdraft easily but higher rate of
interest would be paid.
Advance from customers:
Advance from customers could also be used by the company to raise the funds. It is
quite easier for the company to raise the funds from customers. No documentation and
process is required. However, it increases the cash flow of the company and there is huge risk
for the company to being stuck in debt cycle. In case of “National Takaful co”, it has been
found that company could take the advance from the customers but it would affect the
liability as well as goodwill of the company.
Overdraft agreement:
Overdraft agreement is also a good option to raise the funds for short term. There is
general easy approval process for overdraft agreement. No credit history is required to verify
the same. However, it affects over the cash flows of the company because of higher interest
rate and frequent payments (Kinsky, 2011). In case of “National Takaful co”, it has been
found that company could take the overdraft agreement but it would affect the cash flow and
profitability level of the company.
Treasury bills:
T-bills could also be used by the company to raise the funds. It offers a great amount
to the company for short term. It is quite easier for the company to raise the funds from T-
bills because of market simplicity and a good credit history (Baker and Nofsinger, 2010).
However, it is necessity for the company to repay the amount in shorter period and there is a
risk to being stuck. In case of “National Takaful co”, it has been found that company use the
T-bills to raise the funds without any additional impact over the financial performance of the
company.
Commercial paper:
Commercial paper is also one of the short term fund source which could also be used
by the company to raise the funds. It offers an access to the company to grab the opportunity
in the market. However, it affects over the cash flows of the company and interest rate of
commercial paper is also higher (Horngren, 2009). In case of “National Takaful co”, it has
⊘ This is a preview!⊘
Do you want full access?
Subscribe today to unlock all pages.
Trusted by 1+ million students worldwide
Strategic Financial Management 7
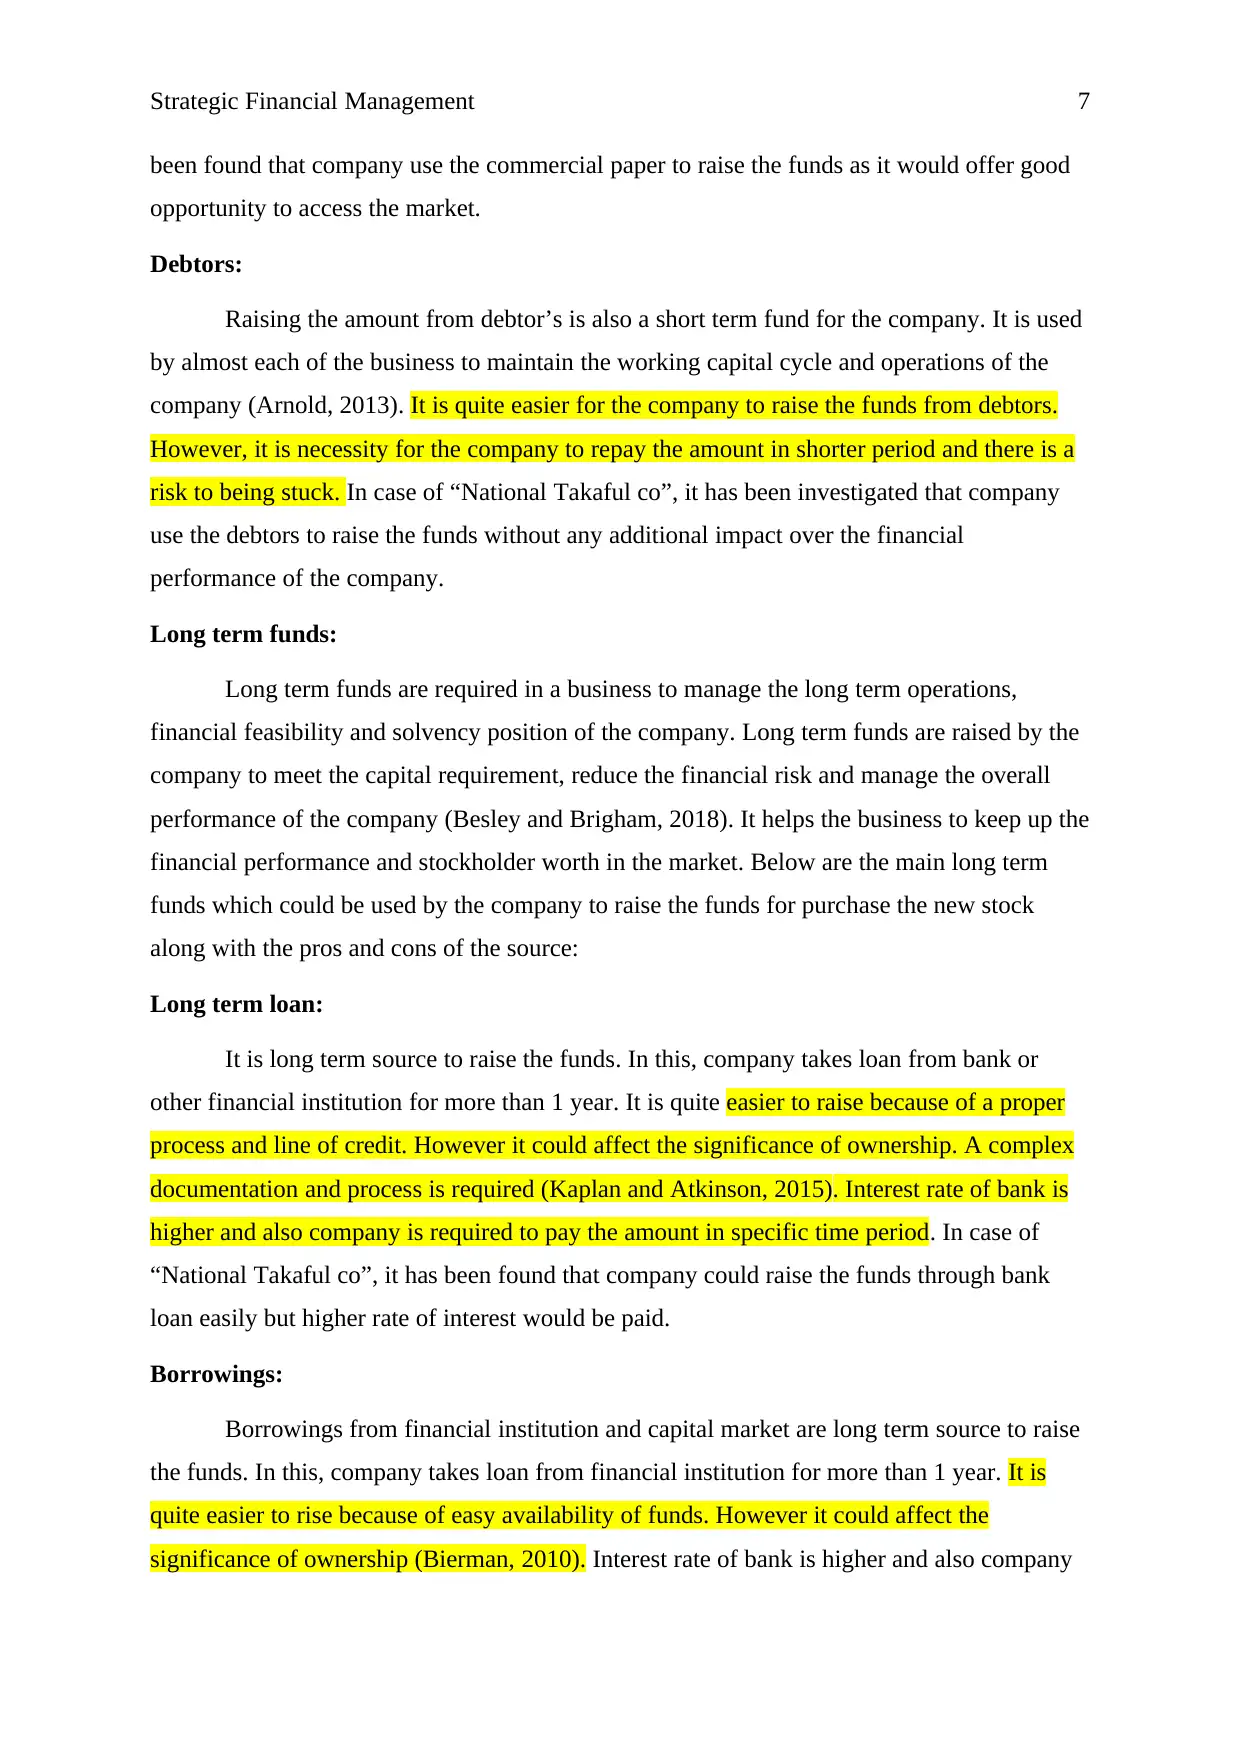
been found that company use the commercial paper to raise the funds as it would offer good
opportunity to access the market.
Debtors:
Raising the amount from debtor’s is also a short term fund for the company. It is used
by almost each of the business to maintain the working capital cycle and operations of the
company (Arnold, 2013). It is quite easier for the company to raise the funds from debtors.
However, it is necessity for the company to repay the amount in shorter period and there is a
risk to being stuck. In case of “National Takaful co”, it has been investigated that company
use the debtors to raise the funds without any additional impact over the financial
performance of the company.
Long term funds:
Long term funds are required in a business to manage the long term operations,
financial feasibility and solvency position of the company. Long term funds are raised by the
company to meet the capital requirement, reduce the financial risk and manage the overall
performance of the company (Besley and Brigham, 2018). It helps the business to keep up the
financial performance and stockholder worth in the market. Below are the main long term
funds which could be used by the company to raise the funds for purchase the new stock
along with the pros and cons of the source:
Long term loan:
It is long term source to raise the funds. In this, company takes loan from bank or
other financial institution for more than 1 year. It is quite easier to raise because of a proper
process and line of credit. However it could affect the significance of ownership. A complex
documentation and process is required (Kaplan and Atkinson, 2015). Interest rate of bank is
higher and also company is required to pay the amount in specific time period. In case of
“National Takaful co”, it has been found that company could raise the funds through bank
loan easily but higher rate of interest would be paid.
Borrowings:
Borrowings from financial institution and capital market are long term source to raise
the funds. In this, company takes loan from financial institution for more than 1 year. It is
quite easier to rise because of easy availability of funds. However it could affect the
significance of ownership (Bierman, 2010). Interest rate of bank is higher and also company
Paraphrase This Document
Need a fresh take? Get an instant paraphrase of this document with our AI Paraphraser
Strategic Financial Management 8
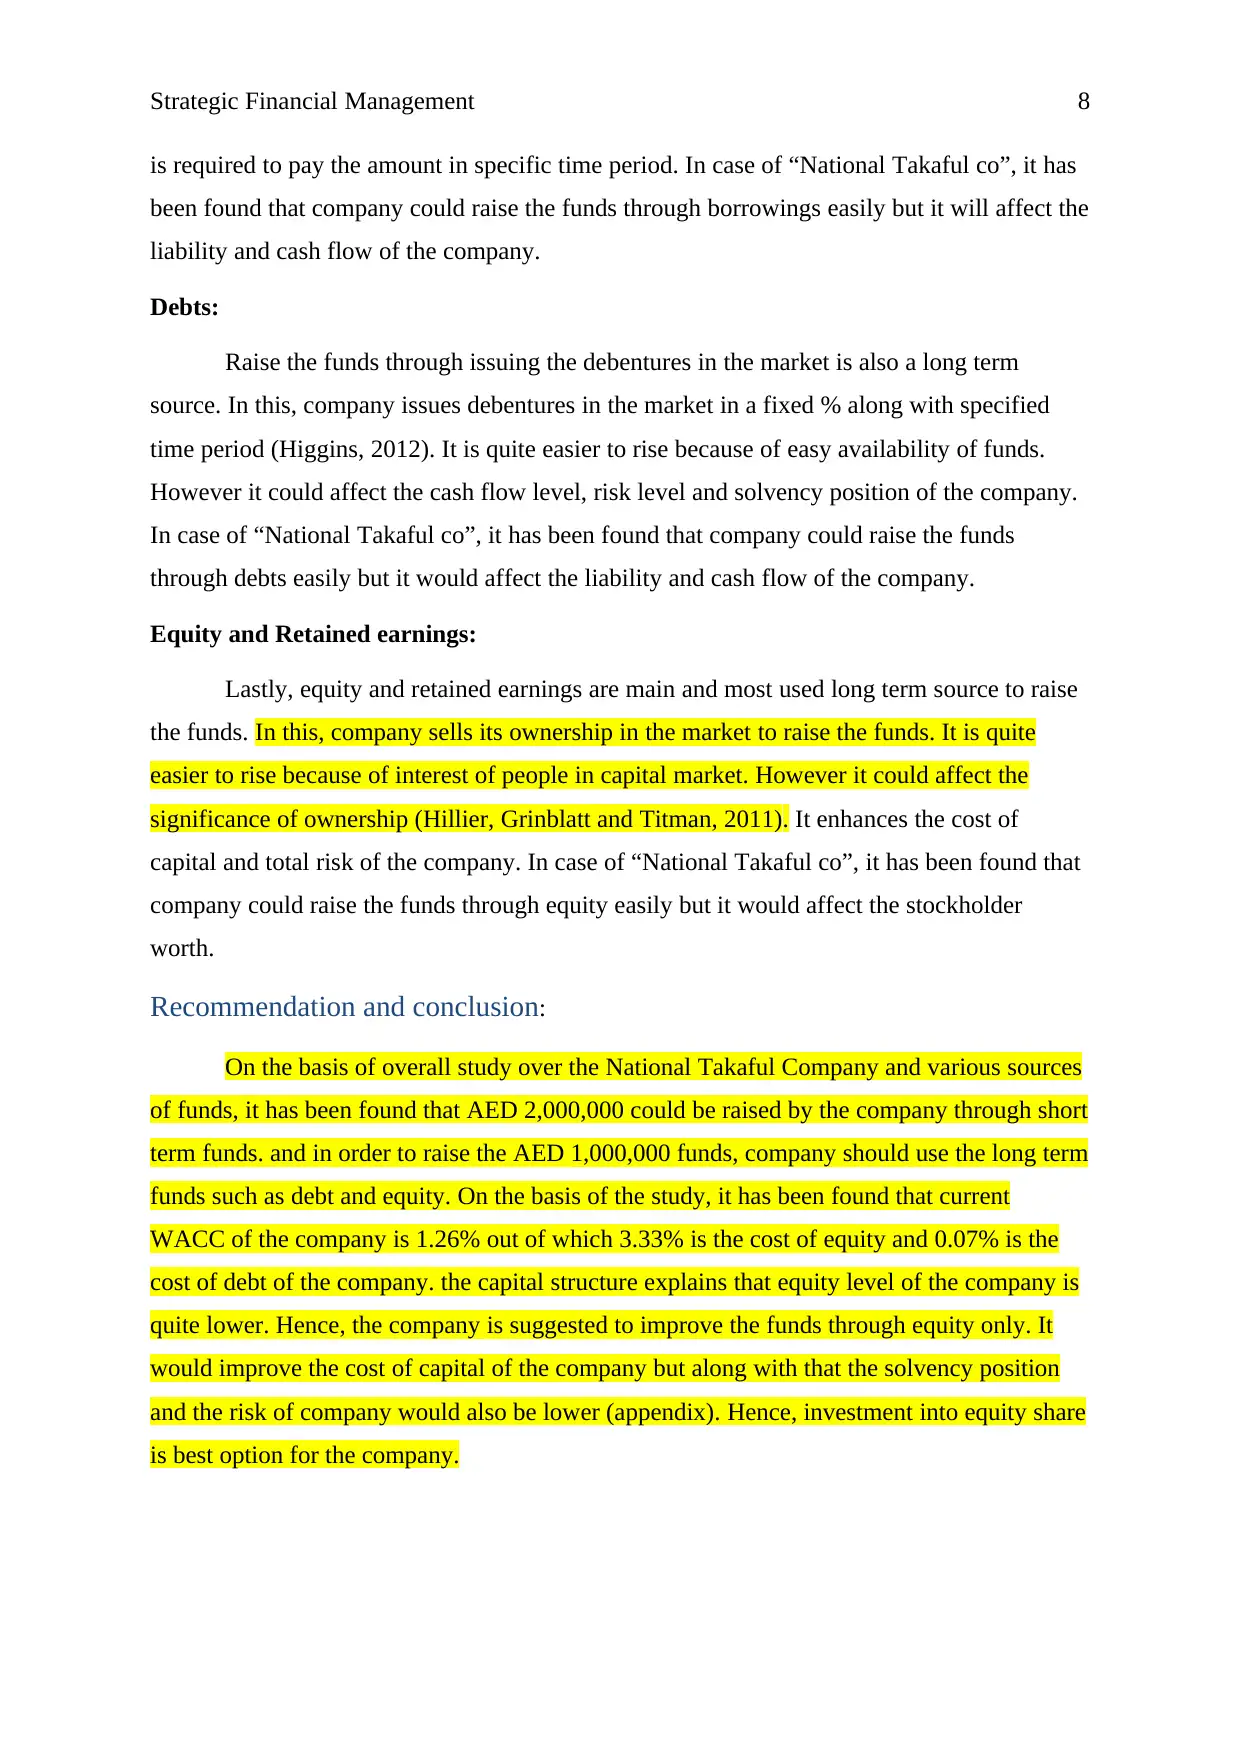
is required to pay the amount in specific time period. In case of “National Takaful co”, it has
been found that company could raise the funds through borrowings easily but it will affect the
liability and cash flow of the company.
Debts:
Raise the funds through issuing the debentures in the market is also a long term
source. In this, company issues debentures in the market in a fixed % along with specified
time period (Higgins, 2012). It is quite easier to rise because of easy availability of funds.
However it could affect the cash flow level, risk level and solvency position of the company.
In case of “National Takaful co”, it has been found that company could raise the funds
through debts easily but it would affect the liability and cash flow of the company.
Equity and Retained earnings:
Lastly, equity and retained earnings are main and most used long term source to raise
the funds. In this, company sells its ownership in the market to raise the funds. It is quite
easier to rise because of interest of people in capital market. However it could affect the
significance of ownership (Hillier, Grinblatt and Titman, 2011). It enhances the cost of
capital and total risk of the company. In case of “National Takaful co”, it has been found that
company could raise the funds through equity easily but it would affect the stockholder
worth.
Recommendation and conclusion:
On the basis of overall study over the National Takaful Company and various sources
of funds, it has been found that AED 2,000,000 could be raised by the company through short
term funds. and in order to raise the AED 1,000,000 funds, company should use the long term
funds such as debt and equity. On the basis of the study, it has been found that current
WACC of the company is 1.26% out of which 3.33% is the cost of equity and 0.07% is the
cost of debt of the company. the capital structure explains that equity level of the company is
quite lower. Hence, the company is suggested to improve the funds through equity only. It
would improve the cost of capital of the company but along with that the solvency position
and the risk of company would also be lower (appendix). Hence, investment into equity share
is best option for the company.
Strategic Financial Management 9
Task 3:
Introduction:
In the report, cost evaluation and budgetary evaluation process has been done. Anglo
American plc is an international mining business which is based in United Kingdom. Main
products of the company are copper, iron ore, nickel, diamonds, platinum, thermal coal etc.
the cost of the company has been studied and evaluated from the previous financial statement
of the company. Further, the importance of cost accounting has been studied. Various tools of
cost design and cost system has been assessed to calculate the financial position of the
company.
Cost verified from financial statement:
Cost accounting assist the business to measure the associated cost to the production of
the company so that the business could identify the irrelevant cost and reduce it to reach over
the main objectives of the business (Deegan, 2013). Cost accounting helps the management
to manage netire activities and production cost of the factory perfectly. the main process of
cost accounting is to classify the record, evaluate and analyze it and allocate the cost is
various numbers to control over the operations of the company (Brealey, Myers and Marcus,
2017).
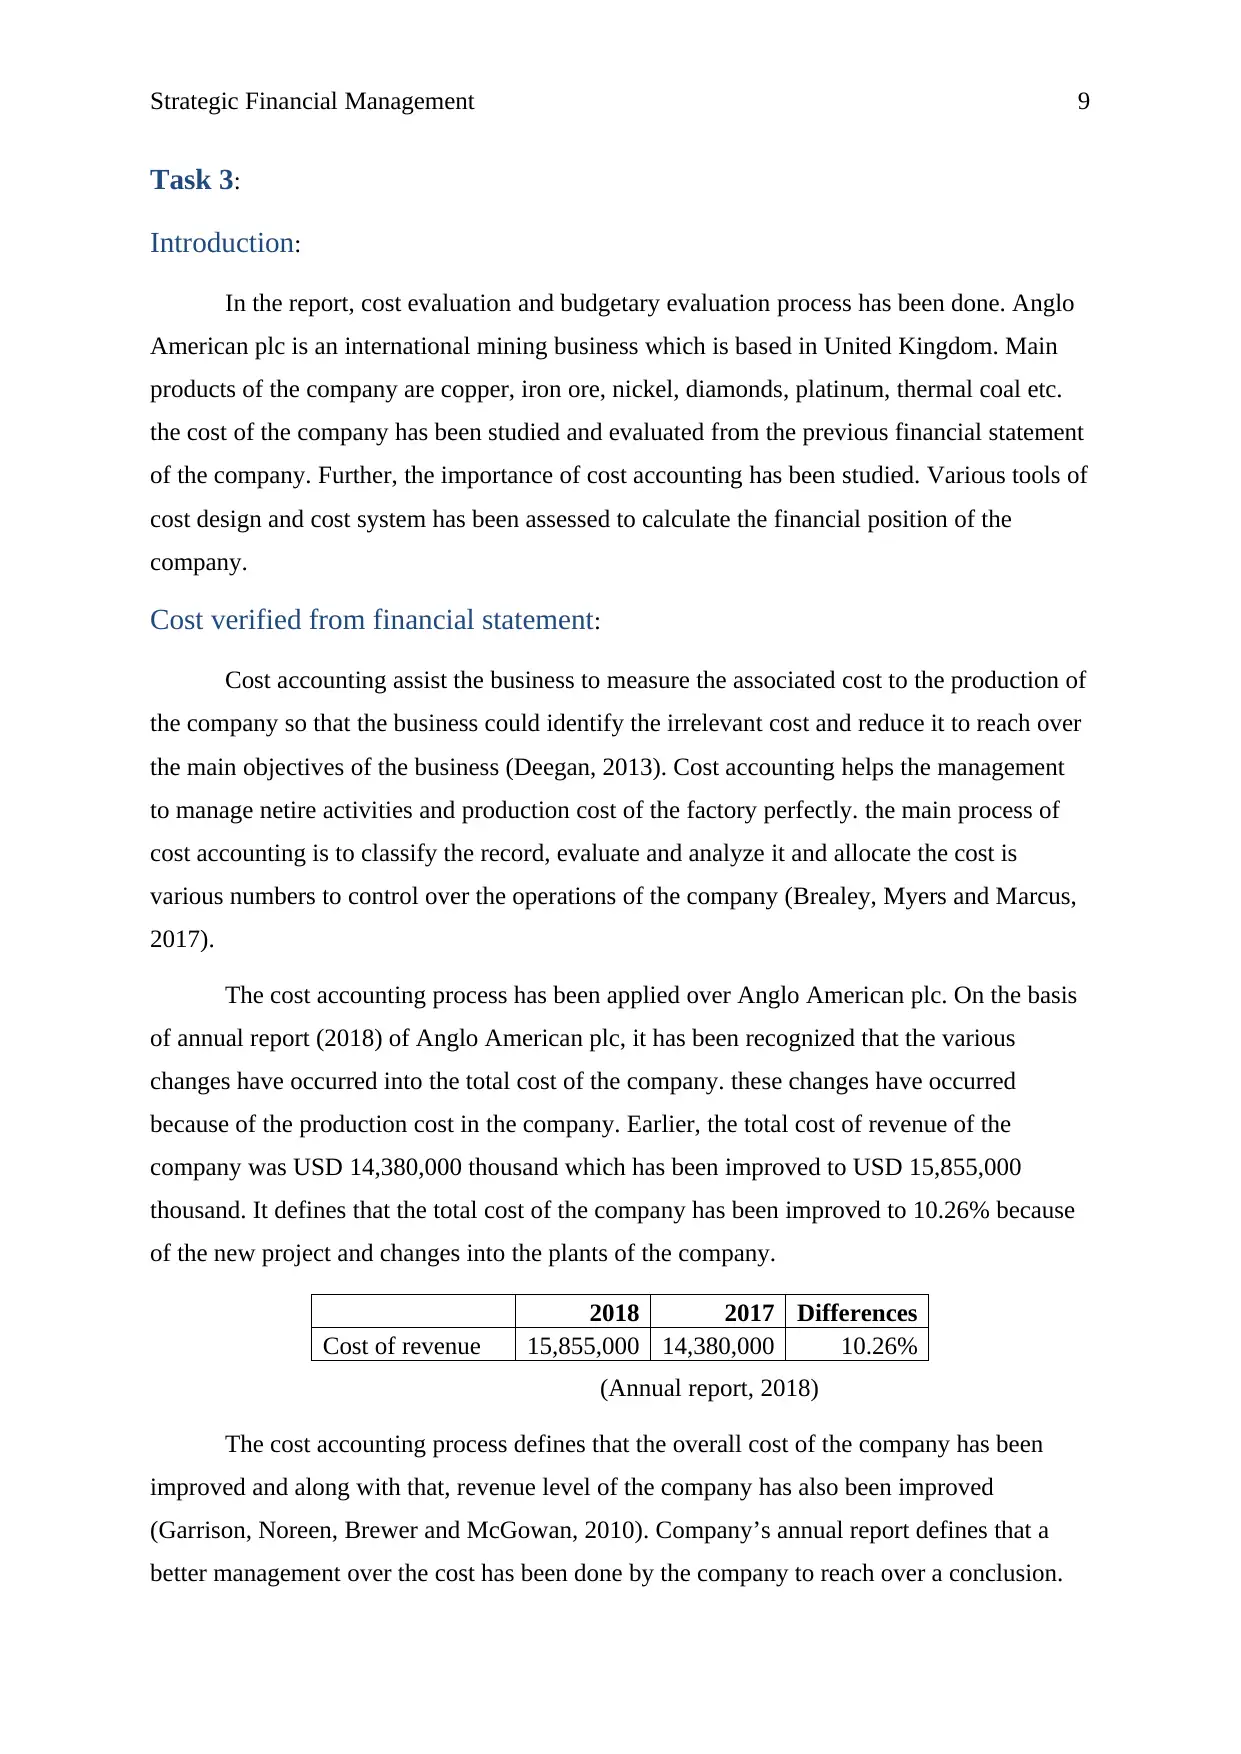
The cost accounting process has been applied over Anglo American plc. On the basis
of annual report (2018) of Anglo American plc, it has been recognized that the various
changes have occurred into the total cost of the company. these changes have occurred
because of the production cost in the company. Earlier, the total cost of revenue of the
company was USD 14,380,000 thousand which has been improved to USD 15,855,000
thousand. It defines that the total cost of the company has been improved to 10.26% because
of the new project and changes into the plants of the company.
2018 2017 Differences
Cost of revenue 15,855,000 14,380,000 10.26%
(Annual report, 2018)
The cost accounting process defines that the overall cost of the company has been
improved and along with that, revenue level of the company has also been improved
(Garrison, Noreen, Brewer and McGowan, 2010). Company’s annual report defines that a
better management over the cost has been done by the company to reach over a conclusion.
Task 3:
Introduction:
In the report, cost evaluation and budgetary evaluation process has been done. Anglo
American plc is an international mining business which is based in United Kingdom. Main
products of the company are copper, iron ore, nickel, diamonds, platinum, thermal coal etc.
the cost of the company has been studied and evaluated from the previous financial statement
of the company. Further, the importance of cost accounting has been studied. Various tools of
cost design and cost system has been assessed to calculate the financial position of the
company.
Cost verified from financial statement:
Cost accounting assist the business to measure the associated cost to the production of
the company so that the business could identify the irrelevant cost and reduce it to reach over
the main objectives of the business (Deegan, 2013). Cost accounting helps the management
to manage netire activities and production cost of the factory perfectly. the main process of
cost accounting is to classify the record, evaluate and analyze it and allocate the cost is
various numbers to control over the operations of the company (Brealey, Myers and Marcus,
2017).
The cost accounting process has been applied over Anglo American plc. On the basis
of annual report (2018) of Anglo American plc, it has been recognized that the various
changes have occurred into the total cost of the company. these changes have occurred
because of the production cost in the company. Earlier, the total cost of revenue of the
company was USD 14,380,000 thousand which has been improved to USD 15,855,000
thousand. It defines that the total cost of the company has been improved to 10.26% because
of the new project and changes into the plants of the company.
2018 2017 Differences
Cost of revenue 15,855,000 14,380,000 10.26%
(Annual report, 2018)
The cost accounting process defines that the overall cost of the company has been
improved and along with that, revenue level of the company has also been improved
(Garrison, Noreen, Brewer and McGowan, 2010). Company’s annual report defines that a
better management over the cost has been done by the company to reach over a conclusion.
⊘ This is a preview!⊘
Do you want full access?
Subscribe today to unlock all pages.
Trusted by 1+ million students worldwide
Strategic Financial Management 10
Importance of cost accounting:
Cost accounting’s main aim is to provide enough information and knowledge about
the different cost associated in the company to the concerned person so that the cost
accountant or other concerned person can evaluate the associated cost with the company and
make better decision accordingly. It offers various statistical methods to identify the
irrelevant cost in the company so that it can be reduced and profitability level of the company
could be improved. It helps the management to present the associated cost in presentable
manner in front of stakeholder (Hogarth and Makridakis, 2011). The main importance of cost
accounting is that it helps the business to run smoothly and business doesn’t require to
showcase the cost accounting data to public. It evaluates the cost occurred in the production
department of the company and other related department so that the overall cost of the
business could be occurred (Bierman, 2010).
On the basis of the cost accounting, an organization can easily forecast the future cost
and performance of the business. Organizations such as Anglo American plc take the help of
cost accounting to measure the cost performance and make better decision in the market.
Tools of costing design and costing system:
Costing design is a set which helps an organization or the management to administer
the various aspects and functions while taking decision about the cost system. It helps the
management to identify and record all the cost related aspect in presentable manner. Cost
design system helps the management to gather cost related information and present them to
internal stakeholders in such a way that quick decision could be made (Brown, Beekes and
Verhoeven, 2011). Cost design system is basically dividend into 2 parts:
Internal cost design system:
This cost design system takes the concern over the internal data of an organization.
This process is applied by Anglo American plc to evaluate about the profit, performance and
position of the company internally. It helps the business to make better polices and strategies.
In these tools, management evaluates the internal costing process of the company and make
better decision about the performance of the company accordingly. The internal design
system evaluates the controlling power of the company to decide the new policies and
performance (Brigham and Ehrhardt, 2013). It shows its concern about internal performance
of the company and makes the decision about overall improvement in the organization in
Paraphrase This Document
Need a fresh take? Get an instant paraphrase of this document with our AI Paraphraser
Strategic Financial Management 11
terms of production and profitability level. Internal cost design system also helps the
organization to make better decision, plan, policy, decision, strategy etc for the betterment of
the company. it also helps the company to make policies for stakeholders and governments.
External cost design system:
This cost design system takes the concern over the external data of an organization.
This process is applied by Anglo American plc to evaluate about the profitability level,
financial performance and market position of the business externally. It helps the business to
make better polices and strategies to improve the market position (Davies and Crawford,
2011). In these tools, management evaluates the external costing process of the company and
make better decision about the performance of the company accordingly. The external design
system evaluates the controlling power of the company to decide the new policies and
performance (Damodaran, 2011). It shows its concern about external performance of the
company and makes the decision about overall improvement in the organization in terms of
production and profitability level. External cost design system also helps the organization to
make better decision, plan, policy, decision, strategy etc for the betterment of the company. It
also helps the company to make policies for stakeholders and governments.
Budget and budgetary process:
Budgeting is a process in which future income and expenditure of the business is
determined on the basis of market changes, economical performance, industry demand
fluctuations and previous performance of the business. Initially company identifies the
relevant approaches of budgeting process such as top down budget and bottom up budget.
Further, the components of budget such as sales budget, production budget, ash budget etc
are determined. The budgeting process of the company is as follows:
1. Update budget assumption
2. Note available funding
3. Step costing points
4. Create budget package
5. Obtain revenue forecast
6. Obtain department budget
7. Validate compensation
Strategic Financial Management 12
8. Validate bonus plan
9. Obtain capital budget model
10. Update the budget model
11. Review the budget
12. Obtain approval
13. Issue the budget
Recommendation:
At the end, costing and pricing strategy of the company has been evaluated and it has
been found that the few changes are required by the company to improve the overall
performance at internal and external level. Company is suggested to look over the overhead
cost and indirect cost as this cost of the company could be controlled and it can help the
business to improve the overall performance of the company. Further, the control over these
costs would improve the internal and external position of the company. The cost accounting’s
main part is to evaluate about the relevant performance and cost information of the company.
In case of Anglo American plc, it has been recognized that the organization is
involving into various irrelevant cost such as additional depreciation and non-controlling
expenses of the company which would reduce the production cost and associated cost of the
company and improve the net profit of the company. To conclude, this process would
improve the market performance, capital position, financial performance etc of the company.
It would also help the business to make better planning to improve the stakeholder’s worth
and government interference level. The changes into cost design system would also help the
organization to make better decision, plan, policy, decision, strategy etc for the betterment of
the company. It would also help the company to make policies for stakeholders and
governments. Company is also recommended to use the master budget to forecast the future
performance of the company. Sample of master budget for anglo American has given in
appendix.
⊘ This is a preview!⊘
Do you want full access?
Subscribe today to unlock all pages.
Trusted by 1+ million students worldwide
1 out of 30
Related Documents


Your All-in-One AI-Powered Toolkit for Academic Success.
+13062052269
info@desklib.com
Available 24*7 on WhatsApp / Email
![[object Object]](/_next/static/media/star-bottom.7253800d.svg)
Unlock your academic potential
Copyright © 2020–2026 A2Z Services. All Rights Reserved. Developed and managed by ZUCOL.