Research Report: Computer Usage on UOW Library Ground Floor

Verified

Added on  2021/06/15

|6
|1543
|162
Report
AI Summary
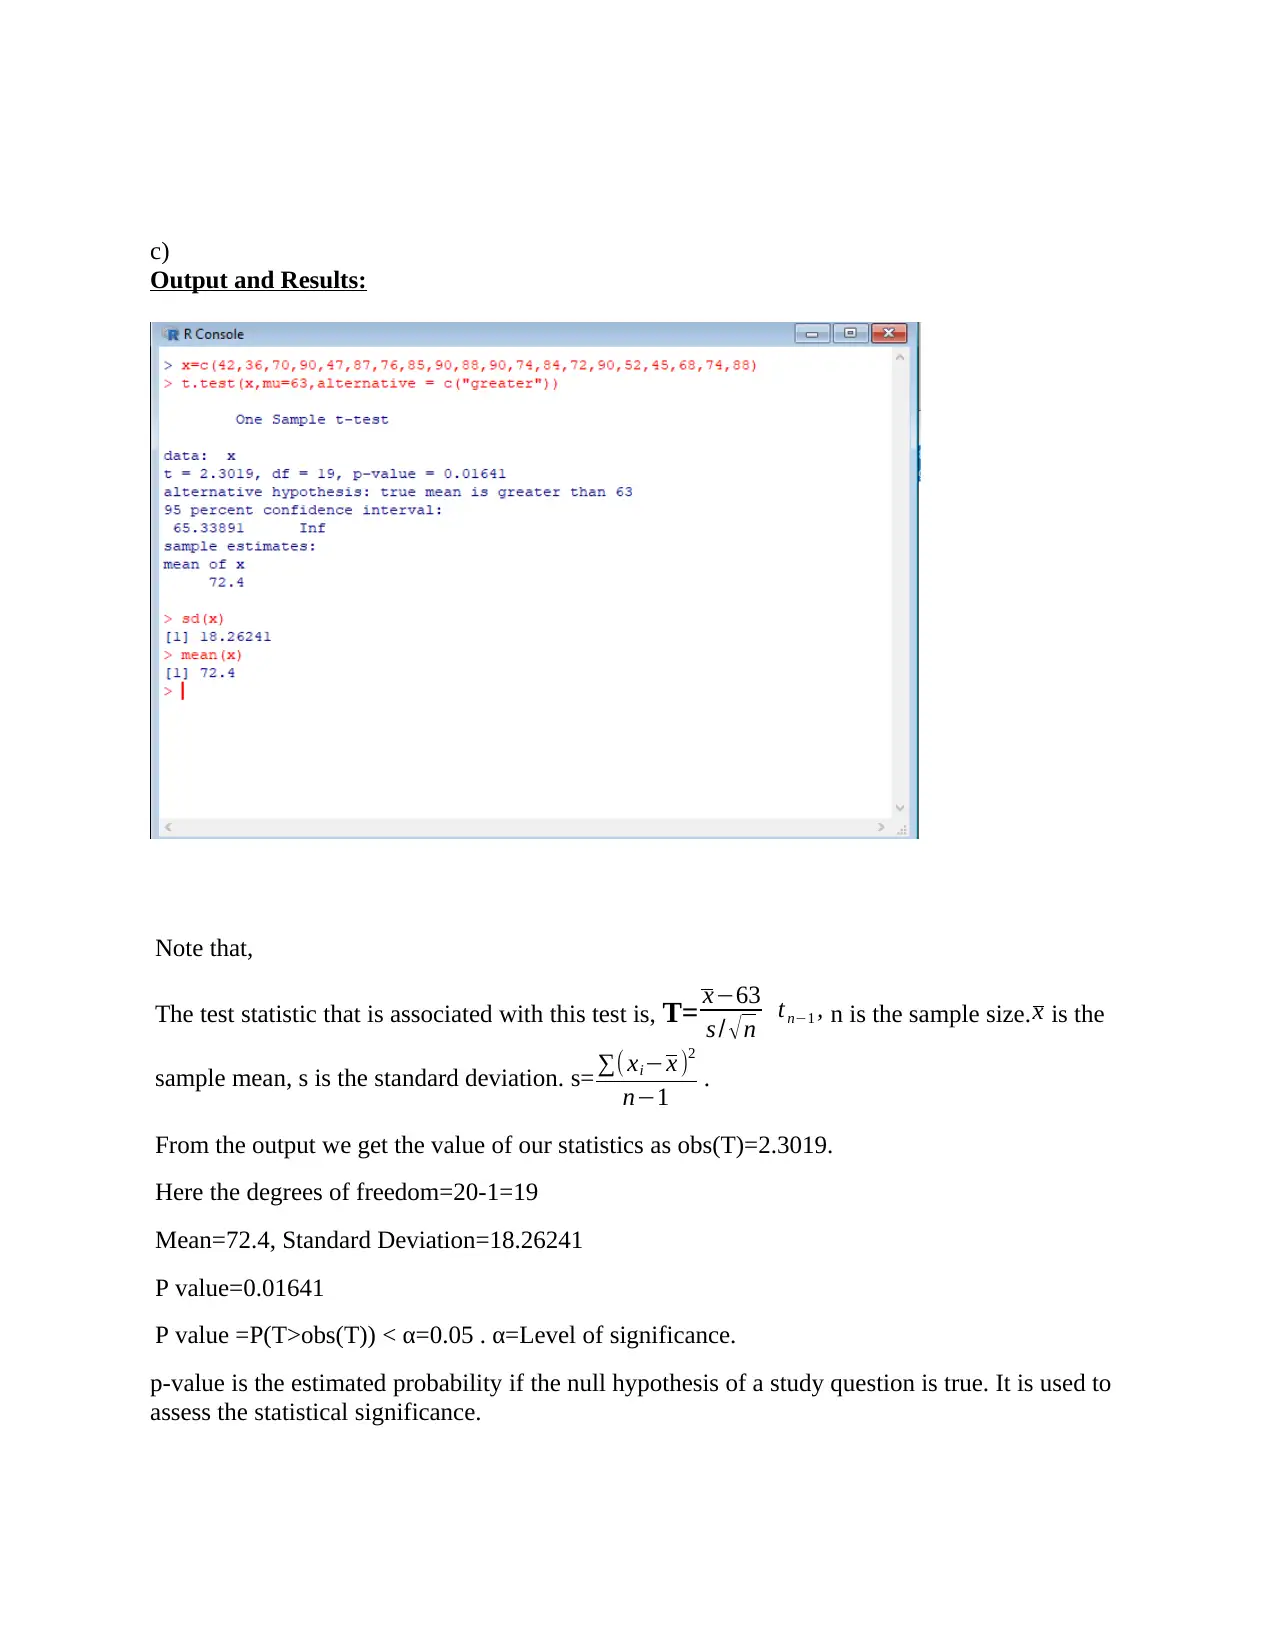
This report presents a statistical analysis of computer usage on the ground floor of the UOW library. The study aimed to determine whether the current number of computers is sufficient to meet student demand. Data was collected over 20 observations, recording the number of occupied computers at different times. A one-sample t-test was employed to analyze the data, comparing the observed usage against a threshold of 70% occupancy. The results of the t-test, including the test statistic, degrees of freedom, mean, standard deviation, and p-value, are presented. The analysis concluded that the library should provide more computers for students on the ground floor. The report includes a discussion of the statistical methods, assumptions, and a formal report. The report also includes an appendix defining key statistical terms and suggests further research directions, such as collecting more data and analyzing the impact of adding more computers.
Document Page
Report:
Research on Usage of Computers on the ground floor in UOW library to verify whether
more computers are needed or not.
Abstract:
In our project we are focused on analyzing the number of computers which have been occupied on the
ground floor in the UOW library. Here we have collected the data and conducted a one sample t-test to
come to the conclusion whether to accept the null hypothesis or to support the claim i.e. alternative
hypothesis. After carefully calculating the test statistic’s value we find out that it is coming in the
rejection region so we conclude that we should support the claim and more computers should be
provided for the students on the ground floor of UOW library.
Introduction:
Now a days every library has computers as they help to keep track of student records and e-
books are easily available where as to find a hardcopy of a book one has to spend time or it may
happen that a particular book’s 3 copies are available in the library but all of them are issued in
such cases e-books are very much helpful and to use e-books one need to use computer.
Here we have collected the data then analyzed it to come to the conclusion.
The quantitative analysis part is written in the following format.
At first we have described how we have collected the data, then we have given a section
describing the statistical analysis , next we provided the output and results section. Further we
have given the formal report and lastly the references section is added.
We have also provided a section in the last showing how further research can be done based on
this project.
tabler-icon-diamond-filled.svg

Secure Best Marks with AI Grader

Need help grading? Try our AI Grader for instant feedback on your assignments.
Document Page
Quantitative analysis:
(1) Data collection :
We have collected data on the number of computers which were busy during different times in
the library . We have collected total 20 data points which are presented in the following table.
Note: We have taken observations on 90 computers on the ground floor in the UOW library.
Reading Number Number of computers(Busy) Time
1 42 7:00 pm
2 36 8:21pm
3 70 4:00pm
4 90 2:10pm
5 47 5:45pm
6 87 11:31am
7 76 3:21pm
8 85 12:46pm
9 90 2:21pm
10 88 12:03pm
11 90 1:54pm
12 74 3:45pm
13 84 11:45am
14 72 3:25pm
15 90 12:44pm
16 52 5:21pm
17 45 6:47pm
18 68 4:14pm
19 74 3:38pm
20 88 2:31pm
Table 1: Sample of 20 data on the number of computers which were busy
during different times in the library
The data was collected by carefully observing by myself, the number of computers which were
busy in different times on the ground floor in the UOW library. Here the sample is a simple
random sample from its population. Each individual in the population has an equal probability of
being selected in the sample.
Note : we collect data with respect to time but for analysis purpose we
(2) Statistical analysis:
This is a case-control study.
Here our research task is to find out the usage of computers on the ground floor in the UOW
library and analyze it with one sample t-test.
Document Page
Our research proposal was to find out whether more than 70% of the computers on the ground
floor in the UOW library are busy or not.
Note that there are 90 computers on the ground floor in the UOW library. So 70% of that is
0.7*90=63.
Here we have a sample of 20 data points so we do not have the population number of computers
that are busy hence population standard deviation of the number of computers those are busy is
unknown to us. Hence one-sample t –test is used otherwise we would have used one-sample z
test.
Before working out with the one sample t-test we assume the following.
Assumptions :
1. The data are continuous .
2. The data follow the normal probability distribution.
3. The sample is a simple random sample from its population. Each individual in the population
has an equal probability of being selected in the sample
Hypothesis Test:
The university authority’s belief is that 70% of the computers are occupied in the library and
suppose it is claimed by the library officials that more than 70% of the computers are occupied in
the library.
Hence the hypothesis testing procedure is followed as below.
a)Here we test ,
H0 : μ=63 vs H1 : μ> 63
H0 , denotes Null hypothesis which is our prior belief about our population .
H1 , denotesthe claim ,isusually opposite of Null hypothesis .
μ , d enotesthe population meannumber of computers that are busy on the ground floor the
UOW library
This reflects our research problem.
b) Using R-Studio we carry out the one sample t-test:
R script:
x=c(42,36,70,90,47,87,76,85,90,88,90,74,84,72,90,52,45,68,74,88)
t.test(x,mu=63,alternative = c("greater"))
sd(x)
mean(x)
Document Page
c)
Output and Results:
Note that,
The test statistic that is associated with this test is, T= x63
s / n tn1 , n is the sample size. x is the
sample mean, s is the standard deviation. s= ( xix )2
n1 .
From the output we get the value of our statistics as obs(T)=2.3019.
Here the degrees of freedom=20-1=19
Mean=72.4, Standard Deviation=18.26241
P value=0.01641
P value =P(T>obs(T)) < α=0.05 . α=Level of significance.
p-value is the estimated probability if the null hypothesis of a study question is true. It is used to
assess the statistical significance.
tabler-icon-diamond-filled.svg

Secure Best Marks with AI Grader

Need help grading? Try our AI Grader for instant feedback on your assignments.
Document Page
Hence at 5% level of significance in the light of the given data we have enough evidence to
support the claim that more than 70% of the computers are busy on the ground floor in the
UOW library.
(3) Formal Report and expected outcomes:
Hence as we can observe that more than 70% computers are busy hence there is a requirement of
number of computers on the ground floor in the UOW library so that no student has to wait. This will
allow all the students to get same benefit.
Further Research:
Further if there is a shortage of budget we can at first add a few computers and then take
readings again and test whether it is enough or not. This will not only save the university
spending but also the space on the ground floor of UOW library.
Further we can use the same research technique to check the availability of other amenities which
should be there for the help of study for both the researchers and students.
We can collect more dataset and check whether there is a significant difference in the number of
computers used in different times. We can divide 24 hours into two shifts and collect data and then
do a two sample t test on the data.
References:
Sheldon, Ross (2010). Introductory Statistics, Academic Press, USA.
Hoel, P.G.,(1971),Introduction to Mathematical Statistics, Fourth Edition, USA
Feller, William(2013),
An introduction to Probability Theory and Its Applications, Volume I, Third
Edition, U.K
Skaik Y.,
The bread and butter of statistical analysis “t-test”: Uses and misuses. ,Pak J Med Sci
2015;31(6):1558-1559
Skaik Y. The panacea statistical toolbox of a biomedical peer reviewer. Pak J Med Sci
2015;31(4):999-1001
Document Page
Appendix:
In the following we have described few terms which are used in this report.
Parameter: It is associated with the population. It defines the properties of the population. It does not
vary.
Statistic: It is associated with the sample. It helps to estimate the parameter. It varies from sample to
sample.
Hypothesis: A theory that is created to ascertain some event
Null Hypothesis: Null hypothesis is our prior belief about our population under concern.
Alternative Hypothesis: Alternative hypothesis is just opposite of null hypothesis which is tested
against the null hypothesis. It is basically a claim against the null hypothesis.
p-value : p-value is between 0 to 1.It is a probability measure. It helps to take the decision i.e
whether we should support the claim or we are failing to reject the null hypothesis i.e our prior
belief. If its value is less than level of significance (generally denoted by,α) then we should
support the claim in the light of the given data.
SRS: SRS means simple random sample . Here we collect samples from the population in such a
way that each and every unit of the population has the same probability or equal chance of being
included in the sample.
Continuous data: Data is classified into two categories , qualitative and quantitative. Quantitative
data are classified into discrete and continuous. These are numeric values which are measured on
a scale .
chevron_up_icon
1 out of 6
circle_padding
hide_on_mobile
zoom_out_icon
logo.png

Your All-in-One AI-Powered Toolkit for Academic Success.

Available 24*7 on WhatsApp / Email

[object Object]