MTE4593: LCA and MFA Analysis of Vegemite Jar Packaging
VerifiedAdded on 2023/01/18
|15
|3092
|75
Report
AI Summary
This technical paper presents a Life Cycle Assessment (LCA) and Material Flow Analysis (MFA) of Vegemite jar packaging, comparing glass and aluminum. The study examines the environmental impacts, production costs, and recycling feasibility of each material. The analysis includes weight calculations, boundary conditions, and data validation, using US price data for cost comparisons. The report evaluates the environmental impact of both materials, considering factors like energy consumption and CO2 emissions. The study aims to identify a more environmentally friendly and cost-effective packaging solution for Vegemite, considering factors like material properties, recycling potential, and sensitivity analysis. The findings of this study provide valuable insights for stakeholders, including environmental protection agencies, food companies, and consumers, to make informed decisions about sustainable packaging options.
Abstract:
Preservation of food product is the most important factor in today’s food industry. Food
preservation implays keeping the food safely, fresh and bacteria free. The supply chain of the
food industry is quite complex. It starts from manufacturer to ware house then dealer to
retailer final comes the end user. Product reaching to the end user passes through various
logistic, process and environment. Also use of recycle able products for the packaging and
shipping plays an important factor in cost reduction as well as it will be environmental friendly.
By studying the Life cycle of the packaging material, we can reduce the cost as well as the
product will be environmental friendly.
In this technical paper we will study the life Cycle Assessment of a glass jar of Vegemite.
Introduction:
Economic and industrial growth will slow down as the technology advances. In current scenario
we are more dependent on digital communication, low cost energy material and use of IoT. Life
cycle assessment of a product gives product’s relation with environmental and its potential
impact on environment. Life cycle assessment is the study of design to production of raw
material, manufacturing to marketing, usage of end user to recycle after use. Also we will study
the Material Flow Analysis. Material Flow Analysis is defined as a systematic assessment of the
flows and stocks of material within a system defined in space and time.
Literature Review:
Reason for study:
For the packing of vegemite, conventional glass jar package is used. But usage of glass jar has a
potential impact on environment. After use if the glass jars are recycled. As the recycling
process of the glass jar increases, the carbon emission and the energy demand increases. In this
study we need to find an alternative solution or material or packaging for vegemite. The
modified material should have a positive impact on environment, low recycling cost and energy
cost.
Its Intended application.
The outcome of the study is to compare both the materials and its impact on market. Also we
need to make sure the food product quality should be maintained as before.
Paraphrase This Document
Need a fresh take? Get an instant paraphrase of this document with our AI Paraphraser
Are there any other materials that could have been used? i.e., cheaper?,
better?
What are the main competitor materials and manufacturing processes? Are
there any?
Target audience:
The stock holders or the audience for implementation of new material are environmental
protection agency, companies producing food item (Vegemite in this case), end users and last
but not the least the Government.
This study is carried out to study and discuss different aspect of both the materials and carry
out a report based on that. The report will include the impact on environment, production cost
and recycle cost.
Application of Life Cycle Assessment:
Life cycle Assessment (LCA) is the analysis of Eco-balance and disposal technique. In this
technique we study the impact of the product on environment through out its life cycle. It
starts with the raw material procurement, goes through the production and processing and
ends by the end user and recycling process.
Application of Material Flow Analysis
Material Flow Analysis (MFA) controls the path way for material flow and industrial process. It
also closes the loop for industrial practice and de-materialization the industrial output. It also
creates a systematic pattern for the energy use. By this analysis the balance is maintained
between the industrial input and out put to the Eco system. Apart from this it states the
environmental impacts and creates the energy consumption strategy.
Comparison Between MFA and LCA
MFA method creates the inventory for LCA.
LCA gives a complete analysis
MFA gives transparency in the data acquisition and manageability of the data.
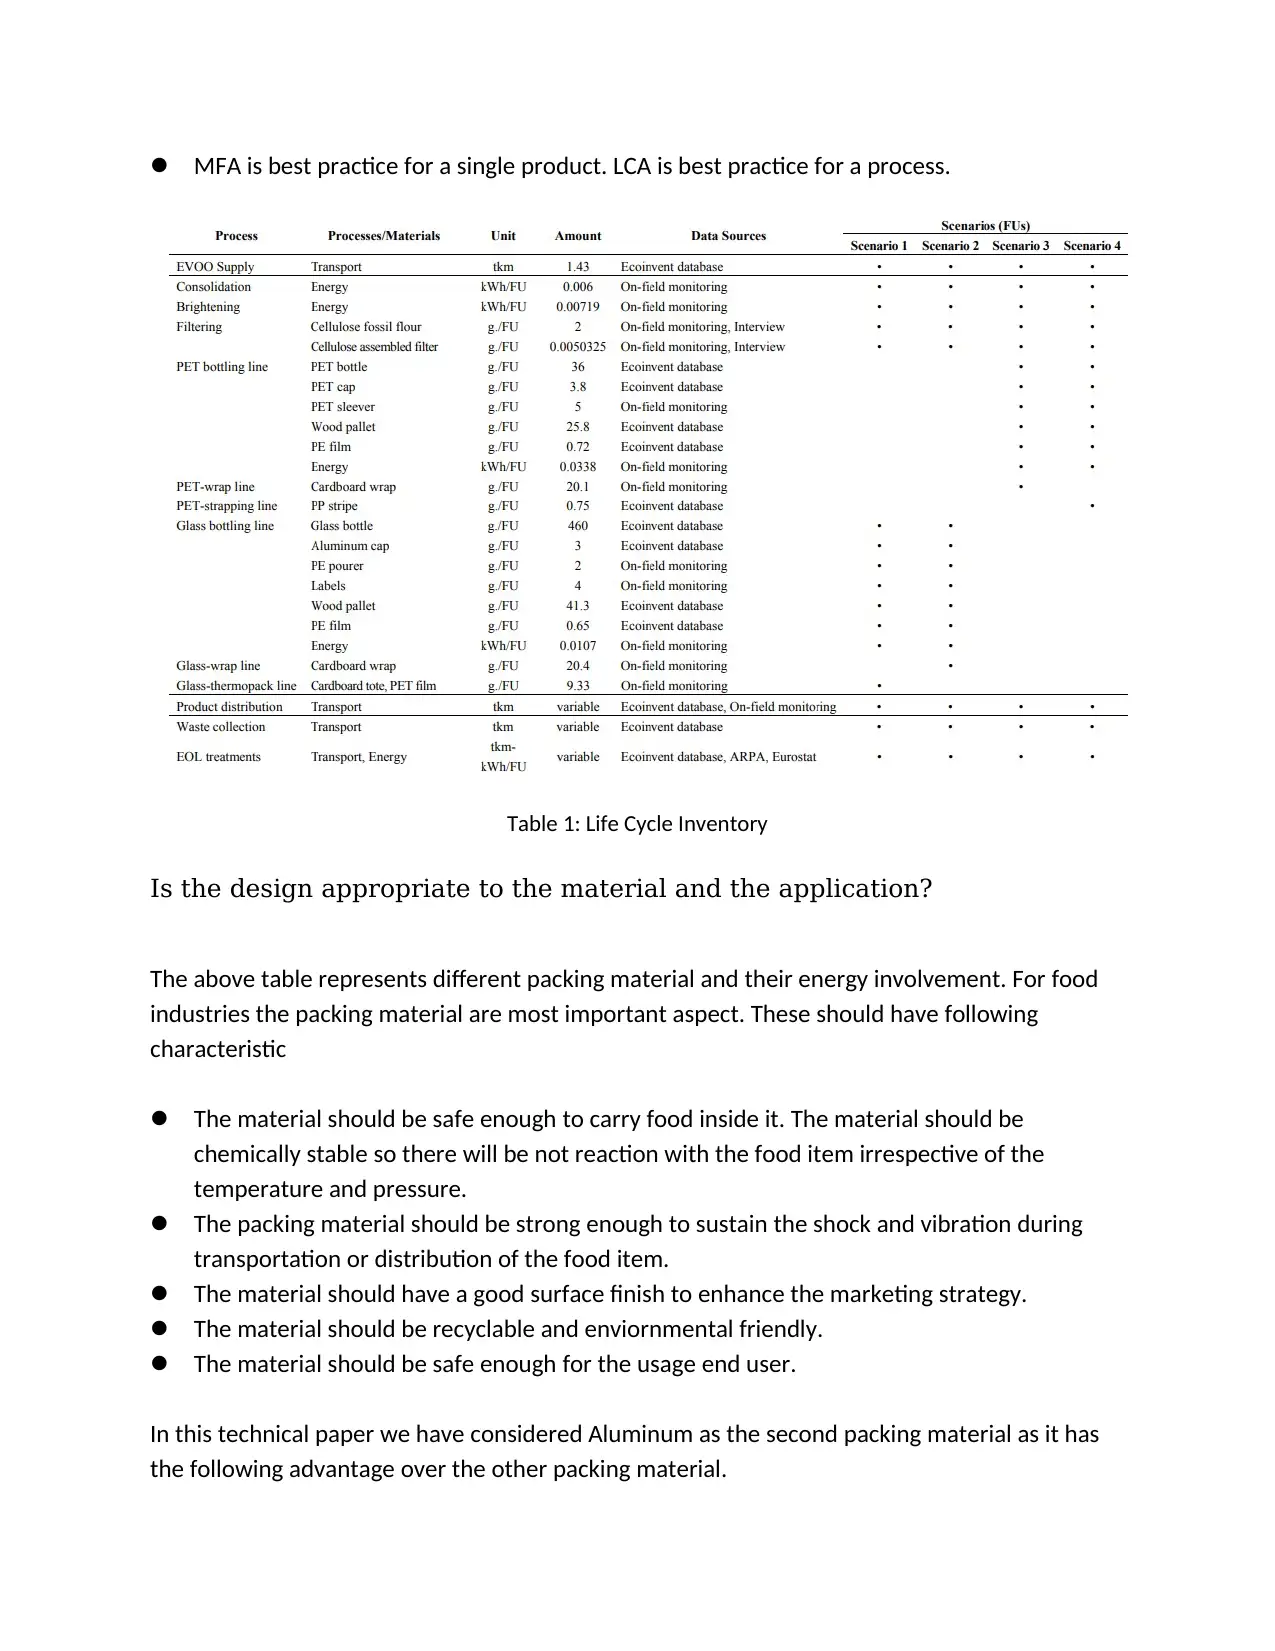
MFA is best practice for a single product. LCA is best practice for a process.
Table 1: Life Cycle Inventory
Is the design appropriate to the material and the application?
The above table represents different packing material and their energy involvement. For food
industries the packing material are most important aspect. These should have following
characteristic
The material should be safe enough to carry food inside it. The material should be
chemically stable so there will be not reaction with the food item irrespective of the
temperature and pressure.
The packing material should be strong enough to sustain the shock and vibration during
transportation or distribution of the food item.
The material should have a good surface finish to enhance the marketing strategy.
The material should be recyclable and enviornmental friendly.
The material should be safe enough for the usage end user.
In this technical paper we have considered Aluminum as the second packing material as it has
the following advantage over the other packing material.
⊘ This is a preview!⊘
Do you want full access?
Subscribe today to unlock all pages.
Trusted by 1+ million students worldwide
Light Weight which reduces the overall payload during transportation.
Chemically non reactive which is suitable for food item preservation.
Smooth surface finish gives an edge to the marketing team.
Aluminum can can be completely recycled after use without any residual wastage and can
be used in other application.
Though the cost of product is bit high but its recycling properties makes it a better packing
material.
Scope of Study:
What properties does the material(s) have that make it appropriate for this
application?
For the study of this technical paper, we will study the packing material for 500 gm vegemite
glass jar. Here we can take Aluminum as the second option for the packing material. To avoid
the complexity of the study we will not consider the sealing and cap of the container. We will
study the main body for the study. In comparison to the Glass Jar we will take 500 gm
Aluminum bottle for the study. Also to measure the impact on large scale we will study a lot of
200 nos packing bottle or aluminum can for study.
In this technical paper the following study is made.
LCA and MFA analysis of both the products
Check for the best use material for packing of vegemite.
Finding alternative solution for packing.
Weight Calculation:
According to record
The weight of vegemite in the bottle = 500 gm
The total weight of the glass bottle = 566 gm
Weight of the empty glass bottle = 66 gm
Weight of the Aluminum can + 500 gm Vegemite = 528 gm
Weight of empty Aluminum can = 28 gm
Paraphrase This Document
Need a fresh take? Get an instant paraphrase of this document with our AI Paraphraser
Total weight of glass bottle 66 x 200 = 13.2 kg
Total weight of Aluminum 28 x 200 = 5.6 kg
Table 2: Weight Calculation of both the material
Boundary Condition for LCA analysis:
Fig 1: Product Life Process
The above figure represents the life cycle of a packaging product. The input of the process is
Raw material and energy. The output of the of this life cycle is Atmospheric emission, Water
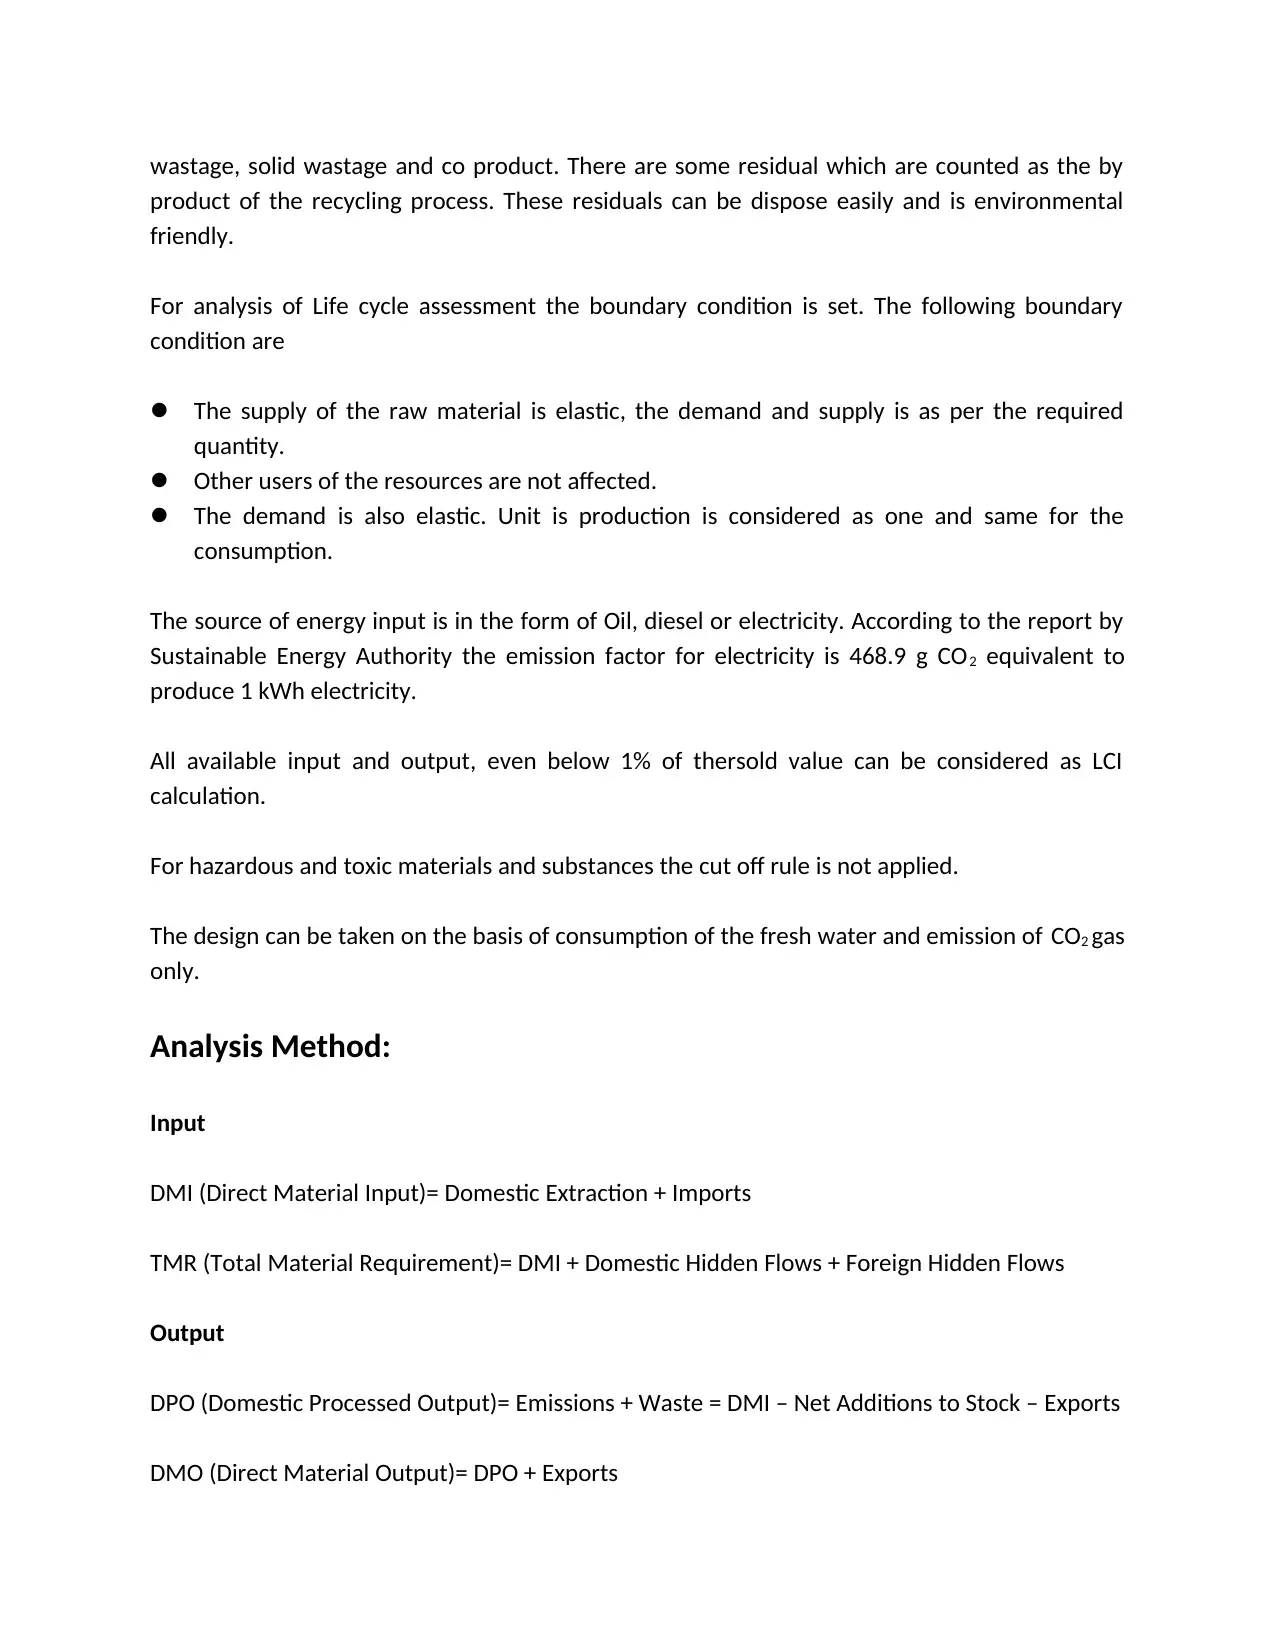
wastage, solid wastage and co product. There are some residual which are counted as the by
product of the recycling process. These residuals can be dispose easily and is environmental
friendly.
For analysis of Life cycle assessment the boundary condition is set. The following boundary
condition are
The supply of the raw material is elastic, the demand and supply is as per the required
quantity.
Other users of the resources are not affected.
The demand is also elastic. Unit is production is considered as one and same for the
consumption.
The source of energy input is in the form of Oil, diesel or electricity. According to the report by
Sustainable Energy Authority the emission factor for electricity is 468.9 g CO2 equivalent to
produce 1 kWh electricity.
All available input and output, even below 1% of thersold value can be considered as LCI
calculation.
For hazardous and toxic materials and substances the cut off rule is not applied.
The design can be taken on the basis of consumption of the fresh water and emission of CO2 gas
only.
Analysis Method:
Input
DMI (Direct Material Input)= Domestic Extraction + Imports
TMR (Total Material Requirement)= DMI + Domestic Hidden Flows + Foreign Hidden Flows
Output
DPO (Domestic Processed Output)= Emissions + Waste = DMI – Net Additions to Stock – Exports
DMO (Direct Material Output)= DPO + Exports
⊘ This is a preview!⊘
Do you want full access?
Subscribe today to unlock all pages.
Trusted by 1+ million students worldwide
TDO (Total Domestic Output)= DPO + Domestic Hidden Flows
Consumption
DMC (Direct Materials Consumption)= DMI - Exports
TMC (Total Materials Consumption)= TMR – Exports – Hidden Flows from Exports
Balance
NAS (Net Additions to Stock)= DMI – DPO – Exports
PTB (Physical Trade Balance)= Imports – exports
Efficiency
Input or Output/GDP (Material Productivity)
Unused/used (Resource efficiency of materials extraction)= Unused (hidden or indirect) / used
(DMI) materials
Energy input Energy Output
and residual
Product
Import Export
Paraphrase This Document
Need a fresh take? Get an instant paraphrase of this document with our AI Paraphraser
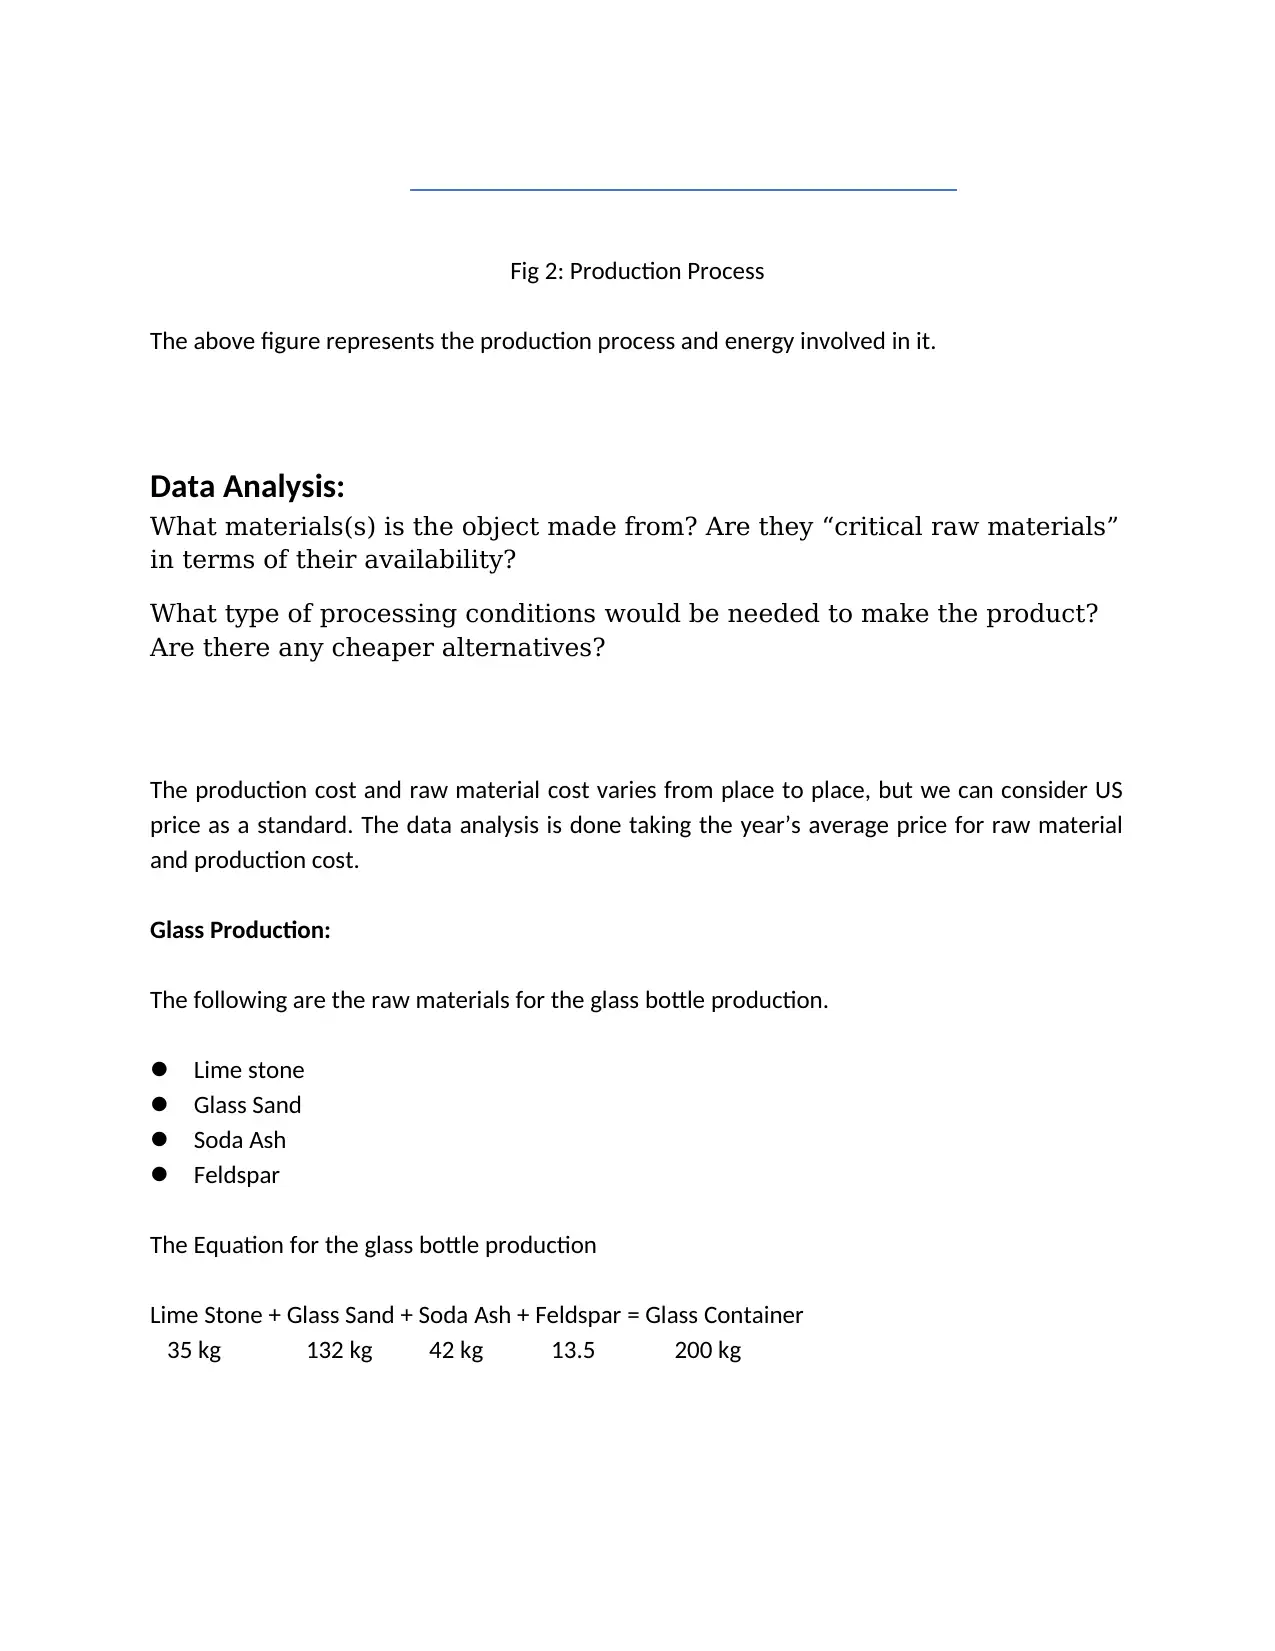
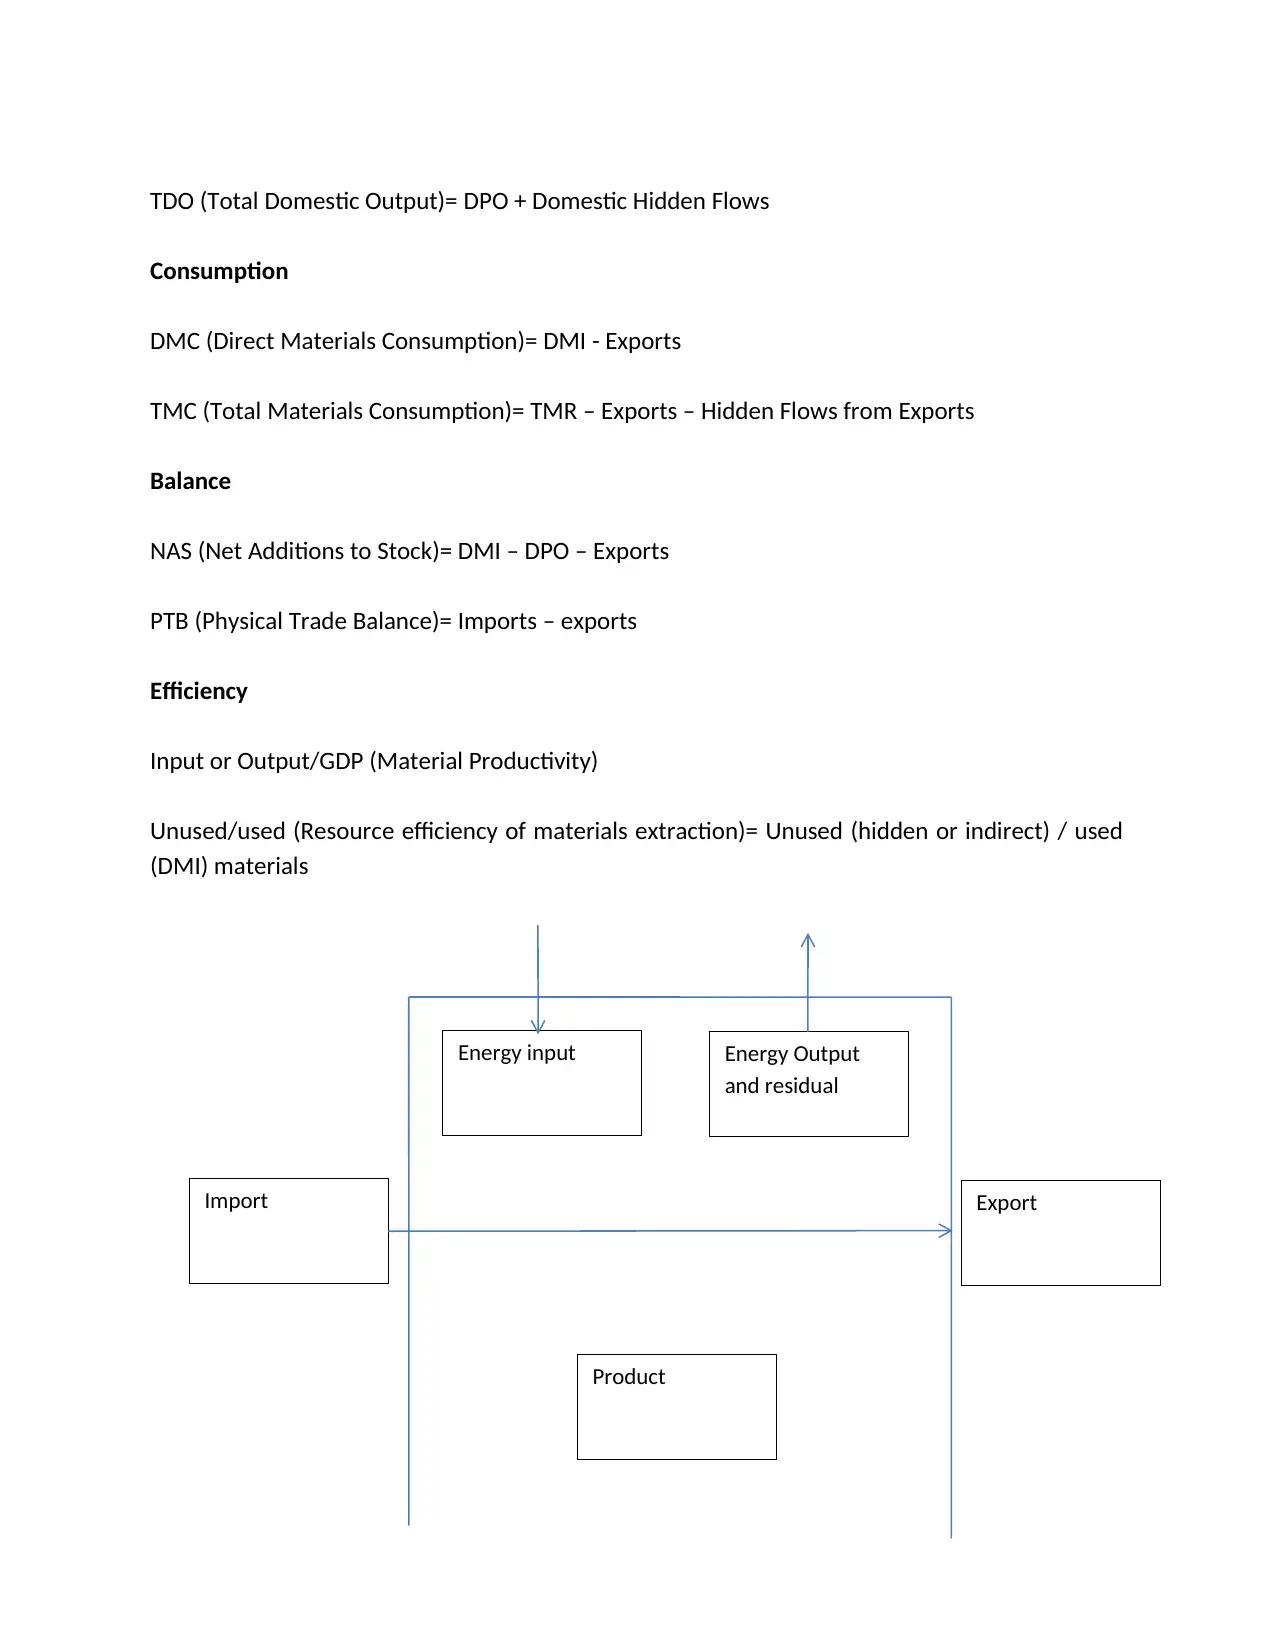
Fig 2: Production Process
The above figure represents the production process and energy involved in it.
Data Analysis:
What materials(s) is the object made from? Are they “critical raw materials”
in terms of their availability?
What type of processing conditions would be needed to make the product?
Are there any cheaper alternatives?
The production cost and raw material cost varies from place to place, but we can consider US
price as a standard. The data analysis is done taking the year’s average price for raw material
and production cost.
Glass Production:
The following are the raw materials for the glass bottle production.
Lime stone
Glass Sand
Soda Ash
Feldspar
The Equation for the glass bottle production
Lime Stone + Glass Sand + Soda Ash + Feldspar = Glass Container
35 kg 132 kg 42 kg 13.5 200 kg
Aluminum Production
Aluminum production process is as follows
Bauxite Mining
Alumina Production
Electrolysis
Ingot Casting
Metal Sheet Production
Aluminum Can production
For the production of 200 kg Aluminum can we need 800 kg Bauxite.
Transportation cost for the production of both the materials are considered same for the
simple calculation.
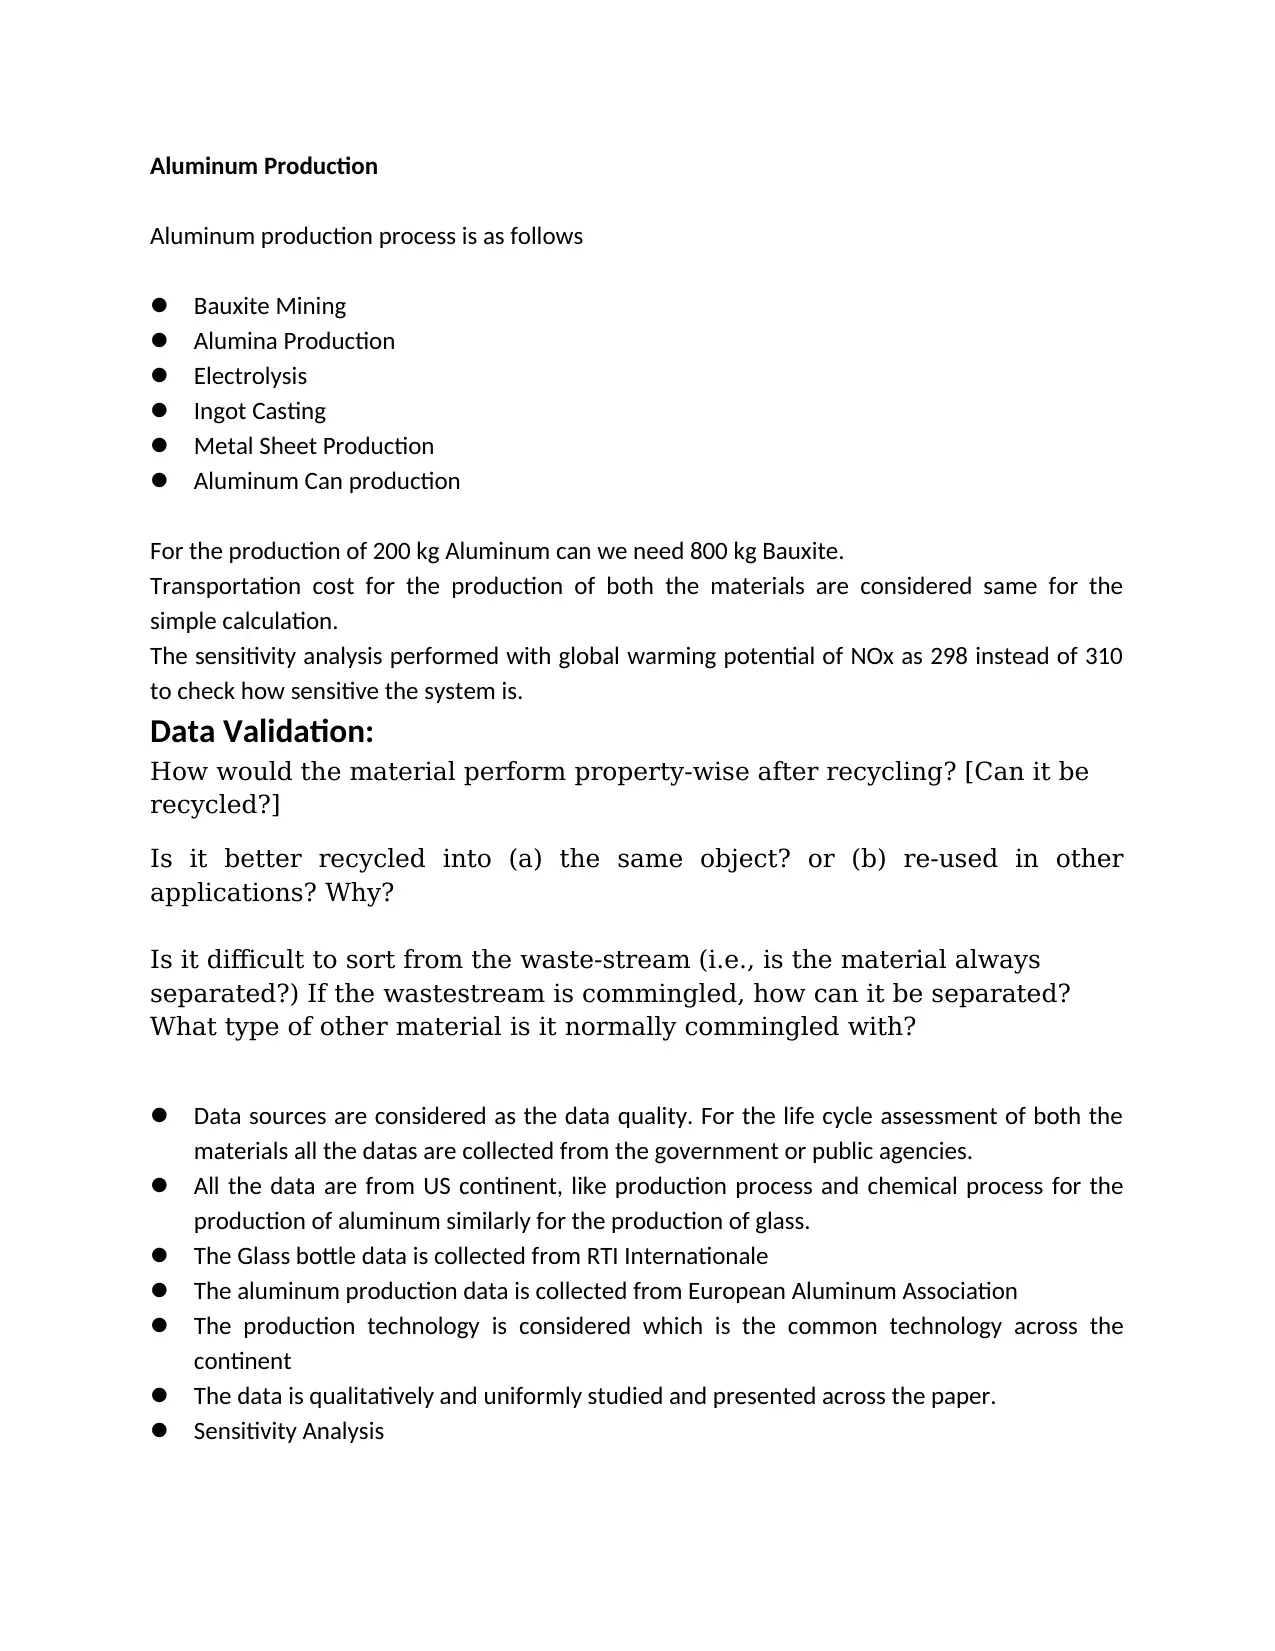
The sensitivity analysis performed with global warming potential of NOx as 298 instead of 310
to check how sensitive the system is.
Data Validation:
How would the material perform property-wise after recycling? [Can it be
recycled?]
Is it better recycled into (a) the same object? or (b) re-used in other
applications? Why?
Is it difficult to sort from the waste-stream (i.e., is the material always
separated?) If the wastestream is commingled, how can it be separated?
What type of other material is it normally commingled with?
Data sources are considered as the data quality. For the life cycle assessment of both the
materials all the datas are collected from the government or public agencies.
All the data are from US continent, like production process and chemical process for the
production of aluminum similarly for the production of glass.
The Glass bottle data is collected from RTI Internationale
The aluminum production data is collected from European Aluminum Association
The production technology is considered which is the common technology across the
continent
The data is qualitatively and uniformly studied and presented across the paper.
Sensitivity Analysis
Aluminum production process is as follows
Bauxite Mining
Alumina Production
Electrolysis
Ingot Casting
Metal Sheet Production
Aluminum Can production
For the production of 200 kg Aluminum can we need 800 kg Bauxite.
Transportation cost for the production of both the materials are considered same for the
simple calculation.
The sensitivity analysis performed with global warming potential of NOx as 298 instead of 310
to check how sensitive the system is.
Data Validation:
How would the material perform property-wise after recycling? [Can it be
recycled?]
Is it better recycled into (a) the same object? or (b) re-used in other
applications? Why?
Is it difficult to sort from the waste-stream (i.e., is the material always
separated?) If the wastestream is commingled, how can it be separated?
What type of other material is it normally commingled with?
Data sources are considered as the data quality. For the life cycle assessment of both the
materials all the datas are collected from the government or public agencies.
All the data are from US continent, like production process and chemical process for the
production of aluminum similarly for the production of glass.
The Glass bottle data is collected from RTI Internationale
The aluminum production data is collected from European Aluminum Association
The production technology is considered which is the common technology across the
continent
The data is qualitatively and uniformly studied and presented across the paper.
Sensitivity Analysis
⊘ This is a preview!⊘
Do you want full access?
Subscribe today to unlock all pages.
Trusted by 1+ million students worldwide
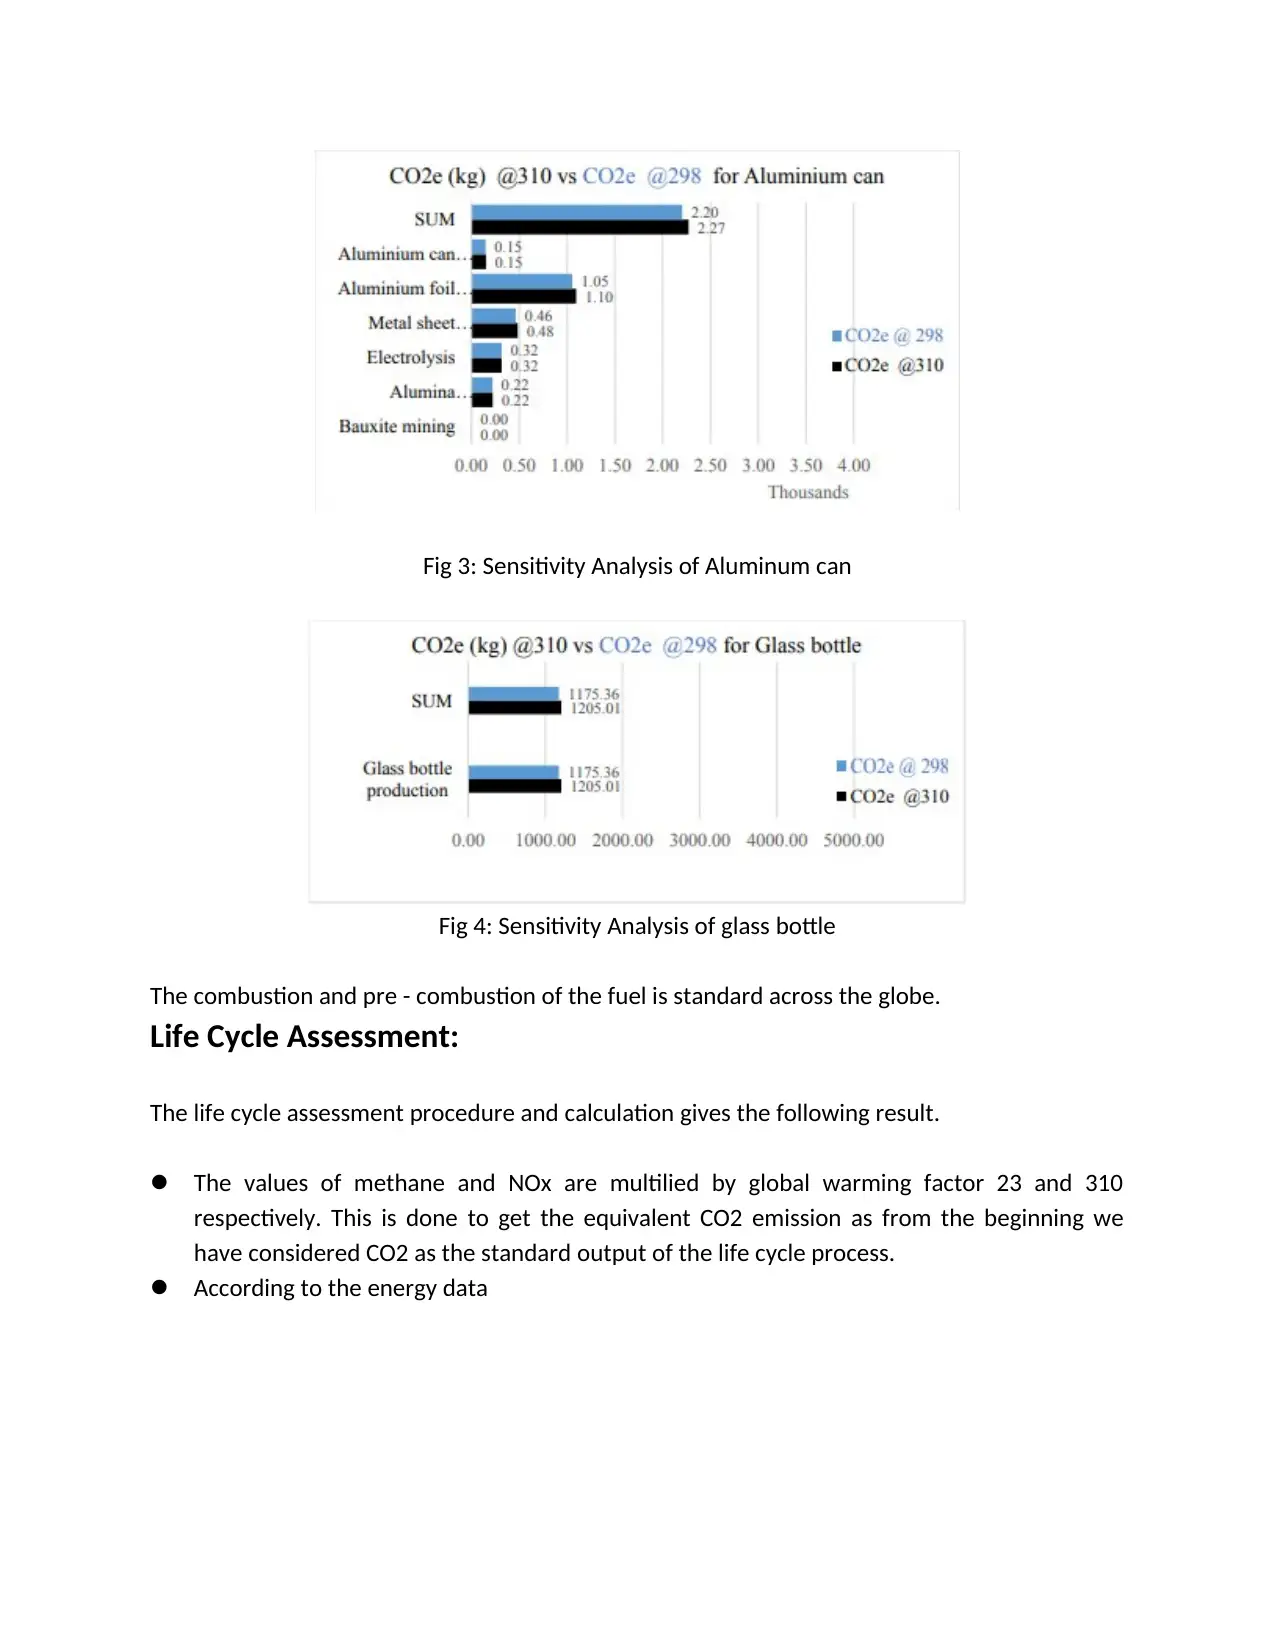
Fig 3: Sensitivity Analysis of Aluminum can
Fig 4: Sensitivity Analysis of glass bottle
The combustion and pre - combustion of the fuel is standard across the globe.
Life Cycle Assessment:
The life cycle assessment procedure and calculation gives the following result.
The values of methane and NOx are multilied by global warming factor 23 and 310
respectively. This is done to get the equivalent CO2 emission as from the beginning we
have considered CO2 as the standard output of the life cycle process.
According to the energy data
Paraphrase This Document
Need a fresh take? Get an instant paraphrase of this document with our AI Paraphraser
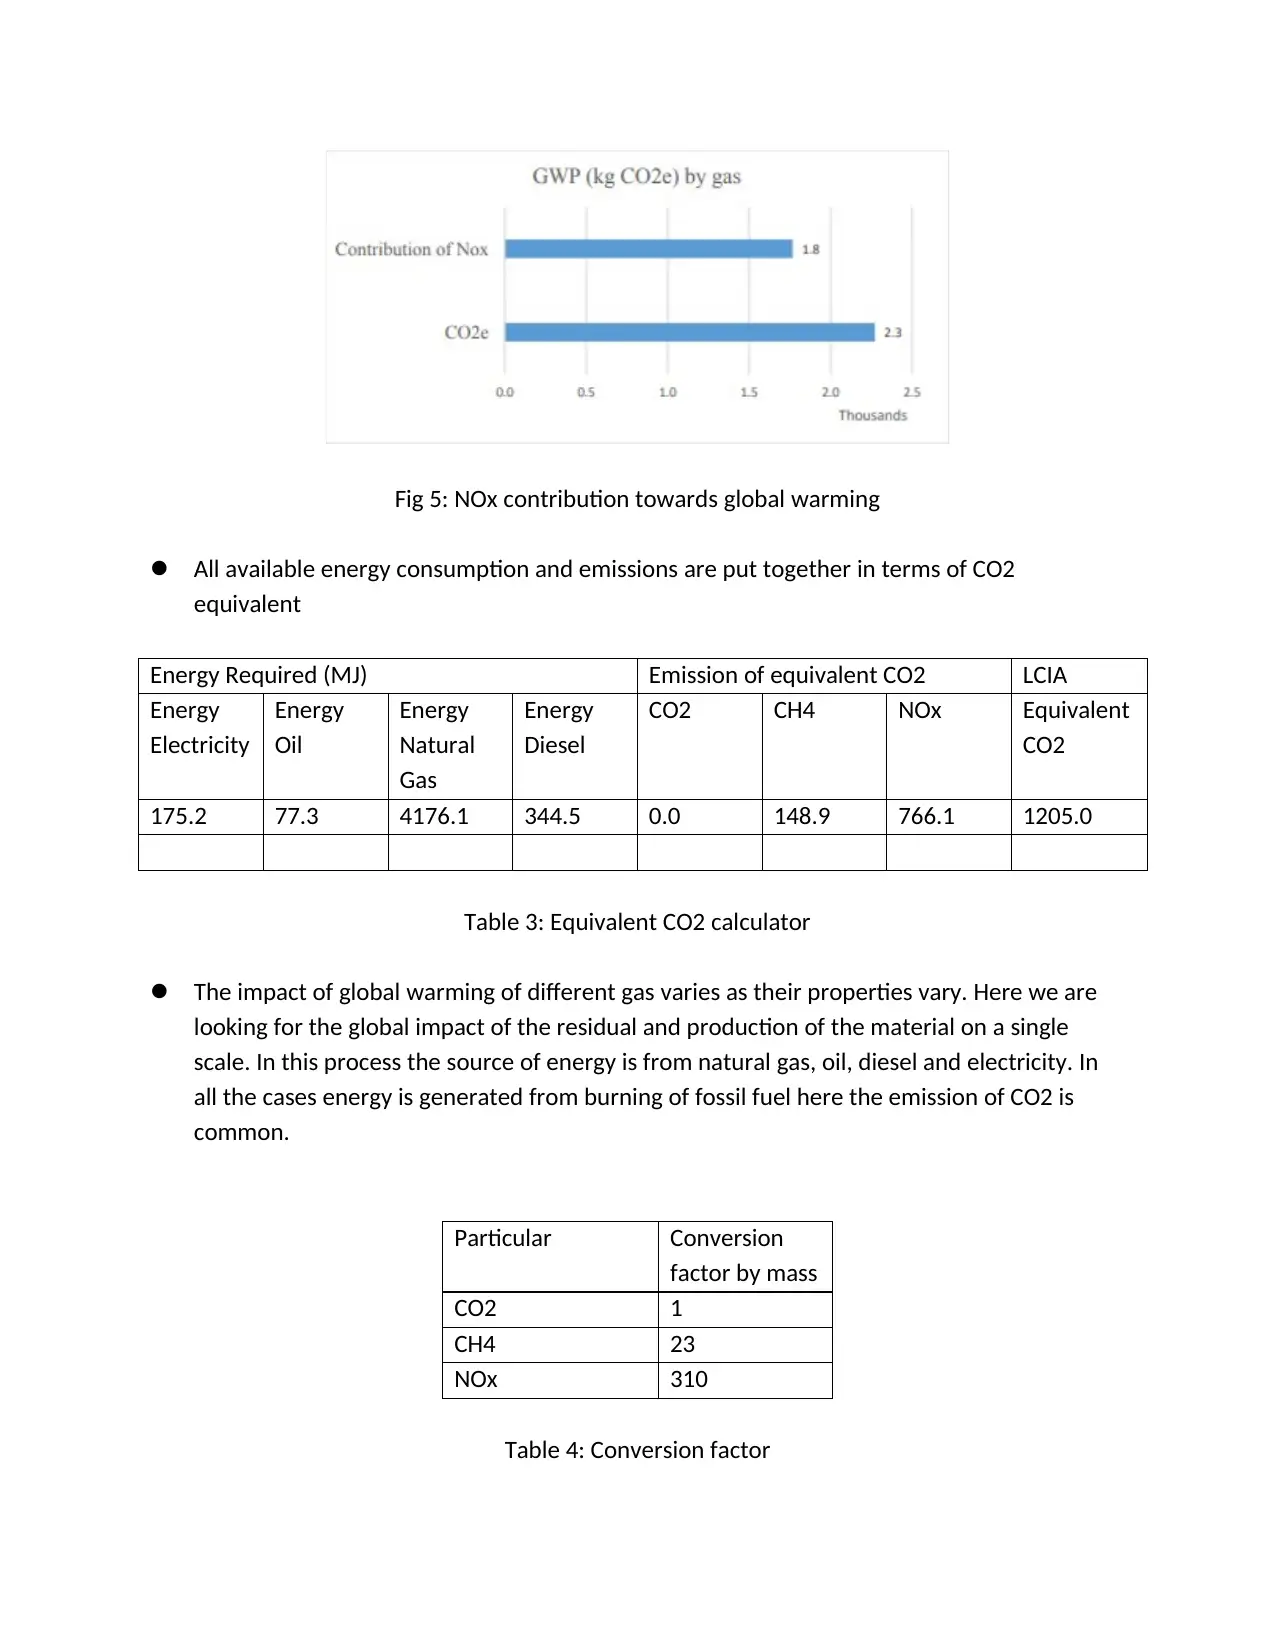
Fig 5: NOx contribution towards global warming
All available energy consumption and emissions are put together in terms of CO2
equivalent
Energy Required (MJ) Emission of equivalent CO2 LCIA
Energy
Electricity
Energy
Oil
Energy
Natural
Gas
Energy
Diesel
CO2 CH4 NOx Equivalent
CO2
175.2 77.3 4176.1 344.5 0.0 148.9 766.1 1205.0
Table 3: Equivalent CO2 calculator
The impact of global warming of different gas varies as their properties vary. Here we are
looking for the global impact of the residual and production of the material on a single
scale. In this process the source of energy is from natural gas, oil, diesel and electricity. In
all the cases energy is generated from burning of fossil fuel here the emission of CO2 is
common.
Particular Conversion
factor by mass
CO2 1
CH4 23
NOx 310
Table 4: Conversion factor
MJ to Kg Natural Gas Oil Diesel Electricity
NOx 0.00019 0.00015 0.0013 NA
CO2 0.056 0.079 0.078 0.13
Table 5: Emission Factor
Life Cycle Representation:
The result regarding life cycle representation of the glass bottle and the aluminum bottle is as
follows
Factor Aluminum Can Glass Bottle Unit/200 bottles
Fresh water depletion 0.7 0.15 M3
Green House Gas
emission
227.18 120.5 Equivalent of
CO2
Electricity
Consumption
214.5 17.5 MJ
Oil Consumption 109.02 7.7 MJ
Natural Gas
Consumption
109.9 417.6 MJ
Diesel Consumption 1.0 34.4 MJ
Table 6: Consumption of material
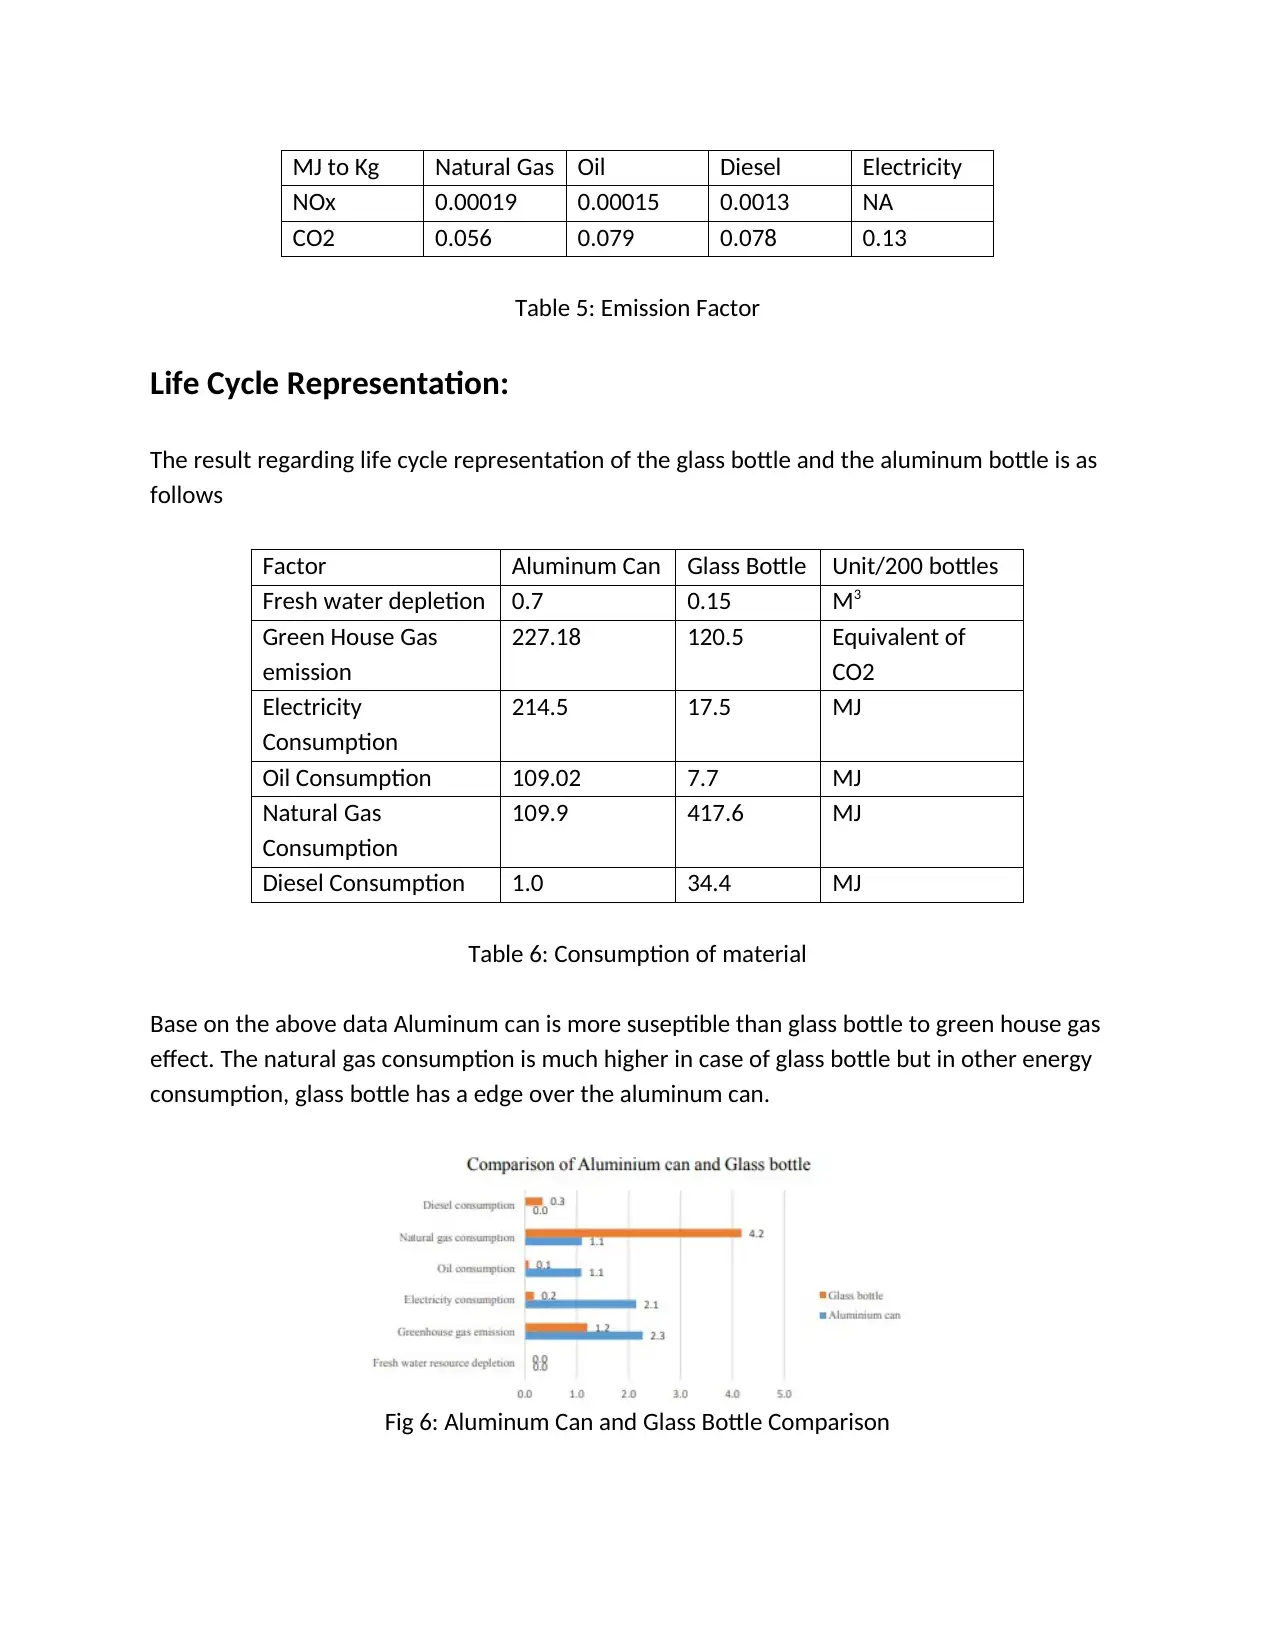
Base on the above data Aluminum can is more suseptible than glass bottle to green house gas
effect. The natural gas consumption is much higher in case of glass bottle but in other energy
consumption, glass bottle has a edge over the aluminum can.
Fig 6: Aluminum Can and Glass Bottle Comparison
NOx 0.00019 0.00015 0.0013 NA
CO2 0.056 0.079 0.078 0.13
Table 5: Emission Factor
Life Cycle Representation:
The result regarding life cycle representation of the glass bottle and the aluminum bottle is as
follows
Factor Aluminum Can Glass Bottle Unit/200 bottles
Fresh water depletion 0.7 0.15 M3
Green House Gas
emission
227.18 120.5 Equivalent of
CO2
Electricity
Consumption
214.5 17.5 MJ
Oil Consumption 109.02 7.7 MJ
Natural Gas
Consumption
109.9 417.6 MJ
Diesel Consumption 1.0 34.4 MJ
Table 6: Consumption of material
Base on the above data Aluminum can is more suseptible than glass bottle to green house gas
effect. The natural gas consumption is much higher in case of glass bottle but in other energy
consumption, glass bottle has a edge over the aluminum can.
Fig 6: Aluminum Can and Glass Bottle Comparison
⊘ This is a preview!⊘
Do you want full access?
Subscribe today to unlock all pages.
Trusted by 1+ million students worldwide
1 out of 15
Related Documents


Your All-in-One AI-Powered Toolkit for Academic Success.
+13062052269
info@desklib.com
Available 24*7 on WhatsApp / Email
![[object Object]](/_next/static/media/star-bottom.7253800d.svg)
Unlock your academic potential
Copyright © 2020–2026 A2Z Services. All Rights Reserved. Developed and managed by ZUCOL.