MG4002 Data Analytics Report: Life Satisfaction Analysis
VerifiedAdded on 2023/05/28
|14
|2481
|364
Report
AI Summary
This data analytics report, prepared by a student, investigates the relationship between life satisfaction and the state of the economy and health services. The report begins with an introduction and conceptual framework outlining the variables and hypotheses. The methodology section describes the data source (ESS), variables, and statistical tools (SPSS) used for analysis. The data analysis/results section presents descriptive statistics, including correlation and regression analyses, and hypothesis testing. The findings indicate a positive correlation between economic stability, health services, and life satisfaction. The discussion and conclusion sections interpret these results, emphasizing the need for governments to foster economic growth and provide quality health services to enhance citizen well-being. The report includes references to relevant academic sources and adheres to the assignment brief's structure.

SUBTOPIC 1
TOPIC
NAME OF AUTHOR
NAME OF CLASS
NAME OF PROFESSOR
NAME OF SCHOOL
CITY AND STATE OF SCHOOL
TOPIC
NAME OF AUTHOR
NAME OF CLASS
NAME OF PROFESSOR
NAME OF SCHOOL
CITY AND STATE OF SCHOOL
Paraphrase This Document
Need a fresh take? Get an instant paraphrase of this document with our AI Paraphraser
SUBTOPIC 2
Table of Contents
Data Analytics Report
1.0 Introduction
2.0 Conceptual Framework
3.0 Methodology
4.0 Data Analysis/Results
5.0 Discussion and Conclusion
References
Table of Contents
Data Analytics Report
1.0 Introduction
2.0 Conceptual Framework
3.0 Methodology
4.0 Data Analysis/Results
5.0 Discussion and Conclusion
References
SUBTOPIC 3
1.0 Introduction
Truly speaking, how does one become satisfied with life as a whole? Is general life satisfaction attained
by just accepting what you find yourself surrounded by and accepting to live on that without trying to be
in pursuit for more? Is it attained by trying to pursue an additional amount of material possessions? Is it
attained by holding the government of the republic in which one lives responsible for the provision of
social amenities and making sure that you are served by these provisions? As per my own view general
life satisfaction is not somewhere we arrive. The more we pursue general life satisfaction the more we
yarn to attain more. Consider an eating scenario. One eats whenever he or she feels hungry. But later
this person will definitely feel hungry and yarn for more food provision either by himself if he or she is
independent. If this person is dependent then the food provision must be made by someone else. This is
a true replica of what pursuing general life satisfaction is. Just as most people are in constant pursuit of
happiness.
It is again stated that those who pursue general life satisfaction are happier. The happier people are in a
society, the more devoted, industrious and corporative they will get to be. These people are always
healthier, have got good physical shape and they heal faster. In attaining happiness humans try several
ways, such as, gaining financial superiority and maybe fame.
Let the present state of economy represent the general infrastructure of a country. It can be recognized
that there is a relationship between general life satisfaction and present state of economy of a country.
Countries with stable economic status have citizens who are more comfortable and happier. This is
because of a stable and rapidly growing economic environment promises availability of material
possession that makes the lives of the citizen of a country more confortable. The more comfortable
citizens of a country are the more satisfied they generally become in life.
Apart from the present state of the economy of a country, research work has also acknowledged that
there exists a relationship between how satisfied one is with life as a whole and state of health services
in the country nowadays. A healing nation is a worried and unhappy nation. A country that values the
health and the productivity of its citizens will take a keen interest in provision of quality health services
to its citizens (Bessière et al. 2010). The existence of affordable and quality health services in a country
guarantees a comfortable state of mind and therefore a satisfied people of a nation.
Aim of Research: To determine whether life’s satisfaction depends on the state of the economy and the
health services of the country.
The topic of study is introduced alongside the background in the first section. The succeeding parts
are the conceptual framework, the method used in the research, data analysis and conclusion.
⊘ This is a preview!⊘
Do you want full access?
Subscribe today to unlock all pages.
Trusted by 1+ million students worldwide
SUBTOPIC 4
Boundaries of research: Boundaries are based on how one is generally satisfied with life in relation
to the satisfaction they get from the present state of economy and state of health services in the
country currently.
2.0 Conceptual Framework
State of the economy
Life’s satisfaction
State of health services
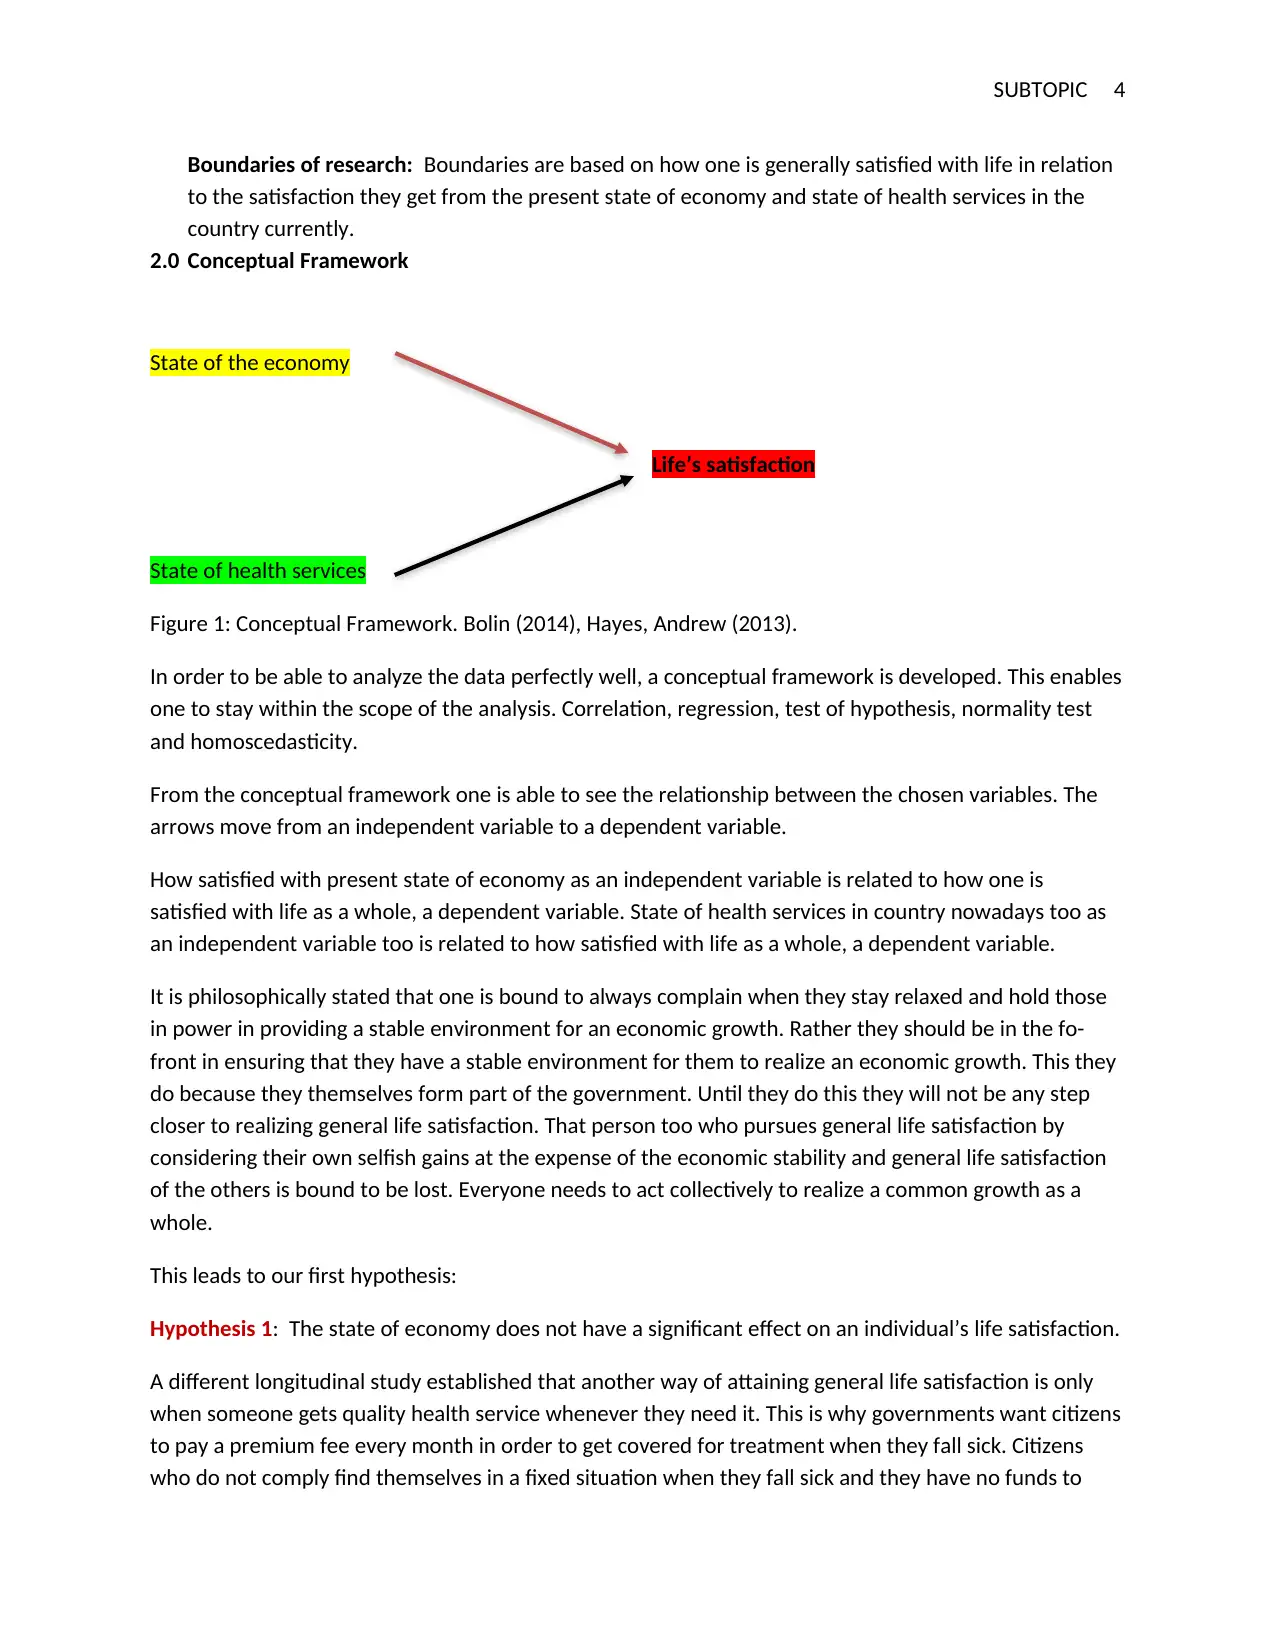
Figure 1: Conceptual Framework. Bolin (2014), Hayes, Andrew (2013).
In order to be able to analyze the data perfectly well, a conceptual framework is developed. This enables
one to stay within the scope of the analysis. Correlation, regression, test of hypothesis, normality test
and homoscedasticity.
From the conceptual framework one is able to see the relationship between the chosen variables. The
arrows move from an independent variable to a dependent variable.
How satisfied with present state of economy as an independent variable is related to how one is
satisfied with life as a whole, a dependent variable. State of health services in country nowadays too as
an independent variable too is related to how satisfied with life as a whole, a dependent variable.
It is philosophically stated that one is bound to always complain when they stay relaxed and hold those
in power in providing a stable environment for an economic growth. Rather they should be in the fo-
front in ensuring that they have a stable environment for them to realize an economic growth. This they
do because they themselves form part of the government. Until they do this they will not be any step
closer to realizing general life satisfaction. That person too who pursues general life satisfaction by
considering their own selfish gains at the expense of the economic stability and general life satisfaction
of the others is bound to be lost. Everyone needs to act collectively to realize a common growth as a
whole.
This leads to our first hypothesis:
Hypothesis 1: The state of economy does not have a significant effect on an individual’s life satisfaction.
A different longitudinal study established that another way of attaining general life satisfaction is only
when someone gets quality health service whenever they need it. This is why governments want citizens
to pay a premium fee every month in order to get covered for treatment when they fall sick. Citizens
who do not comply find themselves in a fixed situation when they fall sick and they have no funds to
Boundaries of research: Boundaries are based on how one is generally satisfied with life in relation
to the satisfaction they get from the present state of economy and state of health services in the
country currently.
2.0 Conceptual Framework
State of the economy
Life’s satisfaction
State of health services
Figure 1: Conceptual Framework. Bolin (2014), Hayes, Andrew (2013).
In order to be able to analyze the data perfectly well, a conceptual framework is developed. This enables
one to stay within the scope of the analysis. Correlation, regression, test of hypothesis, normality test
and homoscedasticity.
From the conceptual framework one is able to see the relationship between the chosen variables. The
arrows move from an independent variable to a dependent variable.
How satisfied with present state of economy as an independent variable is related to how one is
satisfied with life as a whole, a dependent variable. State of health services in country nowadays too as
an independent variable too is related to how satisfied with life as a whole, a dependent variable.
It is philosophically stated that one is bound to always complain when they stay relaxed and hold those
in power in providing a stable environment for an economic growth. Rather they should be in the fo-
front in ensuring that they have a stable environment for them to realize an economic growth. This they
do because they themselves form part of the government. Until they do this they will not be any step
closer to realizing general life satisfaction. That person too who pursues general life satisfaction by
considering their own selfish gains at the expense of the economic stability and general life satisfaction
of the others is bound to be lost. Everyone needs to act collectively to realize a common growth as a
whole.
This leads to our first hypothesis:
Hypothesis 1: The state of economy does not have a significant effect on an individual’s life satisfaction.
A different longitudinal study established that another way of attaining general life satisfaction is only
when someone gets quality health service whenever they need it. This is why governments want citizens
to pay a premium fee every month in order to get covered for treatment when they fall sick. Citizens
who do not comply find themselves in a fixed situation when they fall sick and they have no funds to
Paraphrase This Document
Need a fresh take? Get an instant paraphrase of this document with our AI Paraphraser
SUBTOPIC 5
take care of their medical conditions. But again, since the public facilities in most countries are usually
not well managed, others opt for private health coverage in order to provide themselves the best health
services when they are sick. With all of these said, it is only important if one cares about his or her own
health for them to move towards satisfaction in life.
The next step is to formulate the second hypothesis:
Hypothesis 2: State of health services does not have a significant effect on the individual’s life
satisfaction.
3.0 Methodology
Before analyzing the data that was collected it is only good to know that this is only achieved after
conducting the research which involves data collection. The various quantitative methods that ought to
be used in data collection should be using questionnaire, surveying, oral history and case studies, focus
groups conducting interviews, documents and records.
The data to be used was downloaded on online platform referred to ESS. The data has different
variables and the directive that was given is to pick three variables which has been already done. This is
shown above by the conceptual framework.
The data that is collected from ESS is full of variables and three variables are to be picked before further
analysis. It will be done using SPSS and it is called data cleaning. Then the analysis will also be done and
presented on an SPSS sheet as well.
Variables to use:
The cleaned data will need three variables. The variables will therefore be, independent variable; how
satisfied with present state of economy, dependent variable; how satisfied with life as a whole and
independent variable; state of health services in country nowadays.
4.0 Data Analysis/Results
In this section, various statistical analyses will be conducted.
Description
Statistical analysis need to be carried out but before this happens, the data will be tested against some
statistical assumptions which includes, linearity, homoscedasticity, normality and multi collinearity
(Vaismoradi,Turunen and Bondas 2013). Histogram will be used to test normality (Green and Salkind,
SUBTOPIC 6
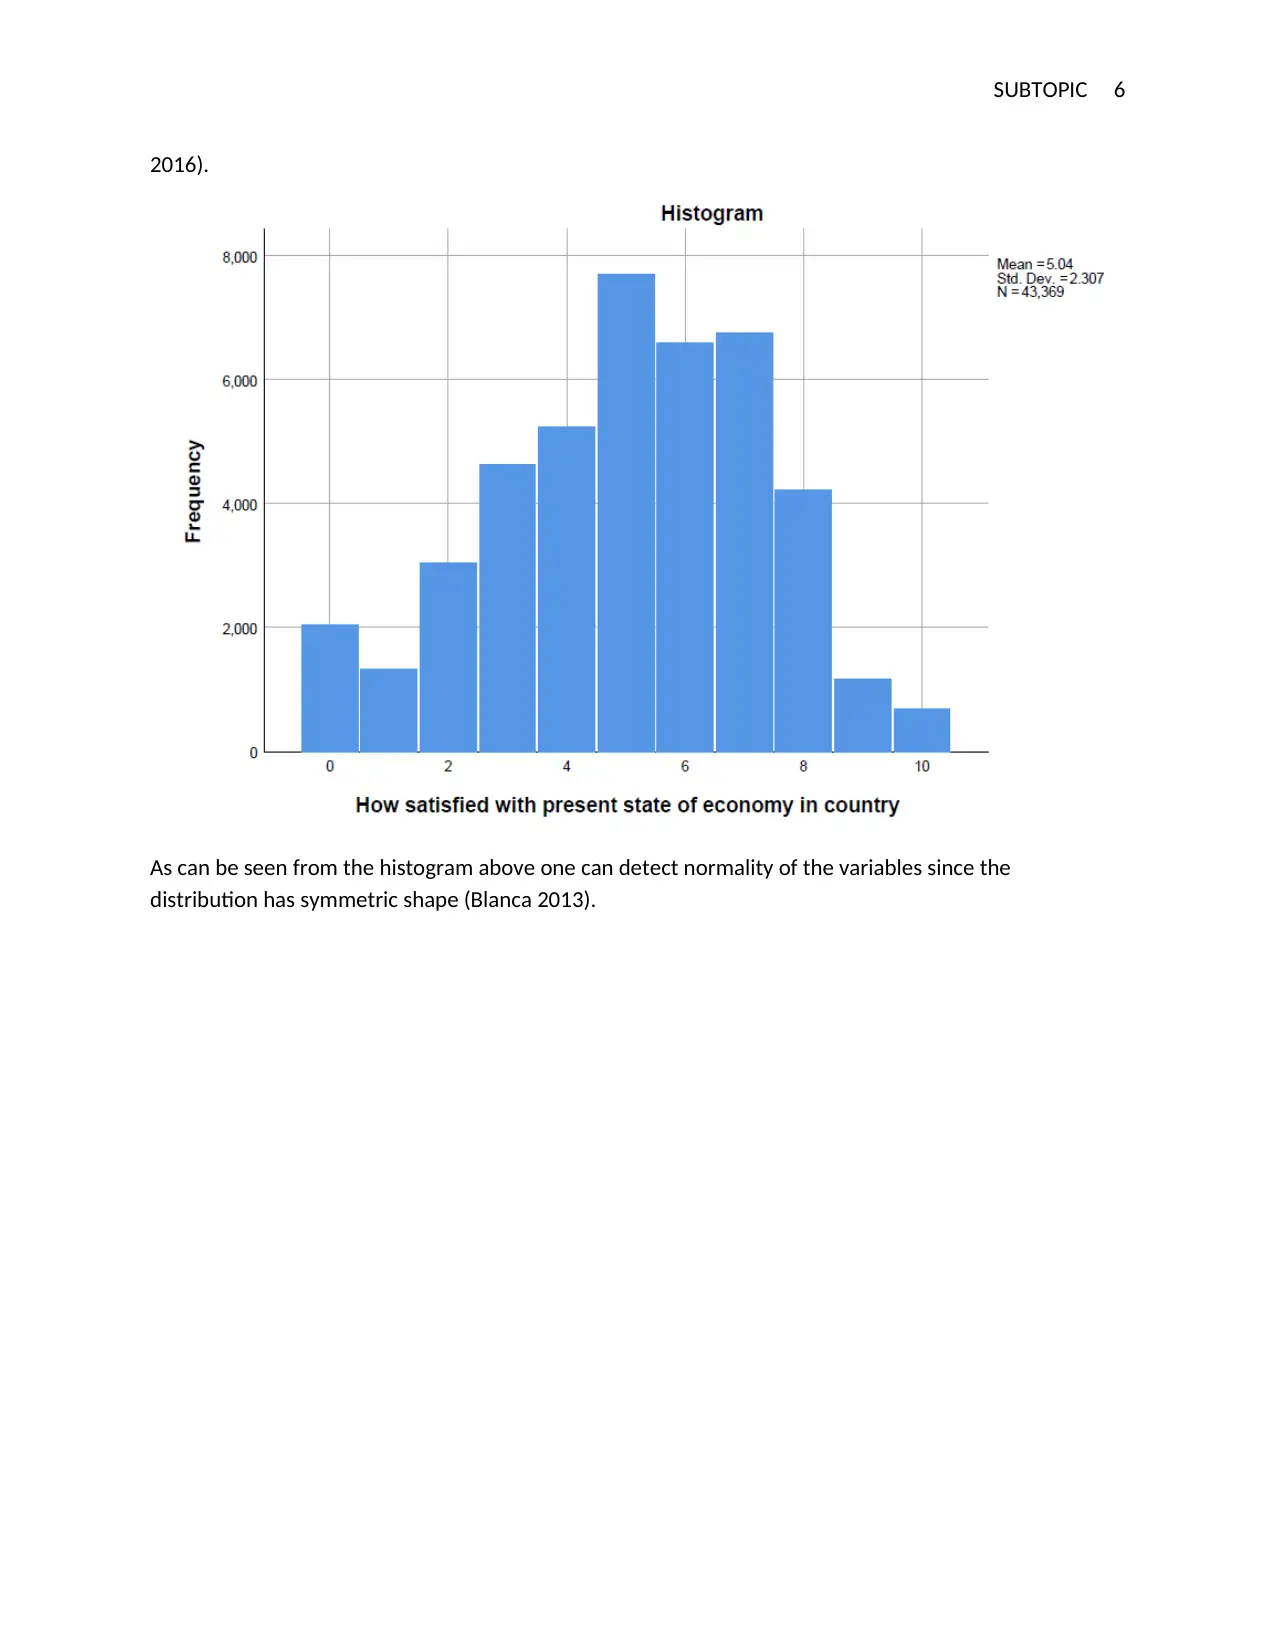
2016).
As can be seen from the histogram above one can detect normality of the variables since the
distribution has symmetric shape (Blanca 2013).
2016).
As can be seen from the histogram above one can detect normality of the variables since the
distribution has symmetric shape (Blanca 2013).
⊘ This is a preview!⊘
Do you want full access?
Subscribe today to unlock all pages.
Trusted by 1+ million students worldwide
SUBTOPIC 7
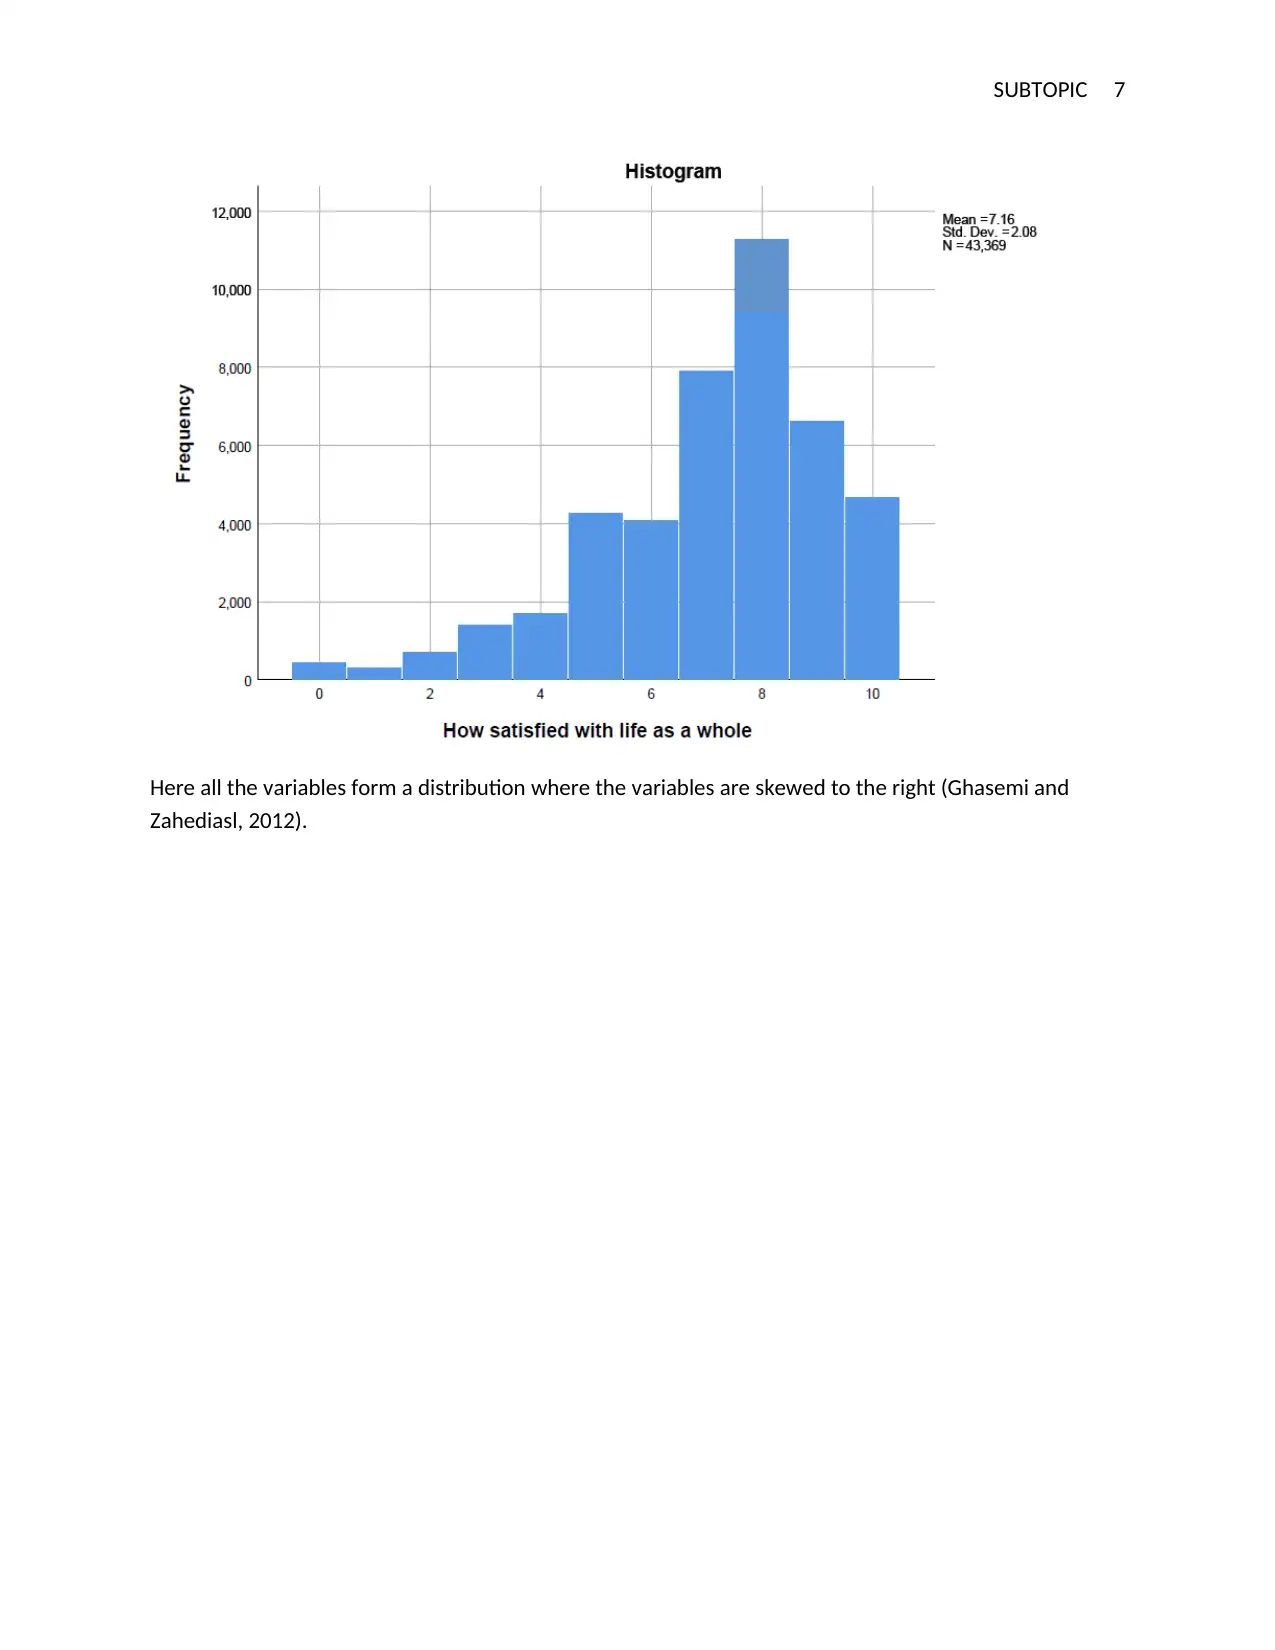
Here all the variables form a distribution where the variables are skewed to the right (Ghasemi and
Zahediasl, 2012).
Here all the variables form a distribution where the variables are skewed to the right (Ghasemi and
Zahediasl, 2012).
Paraphrase This Document
Need a fresh take? Get an instant paraphrase of this document with our AI Paraphraser
SUBTOPIC 8
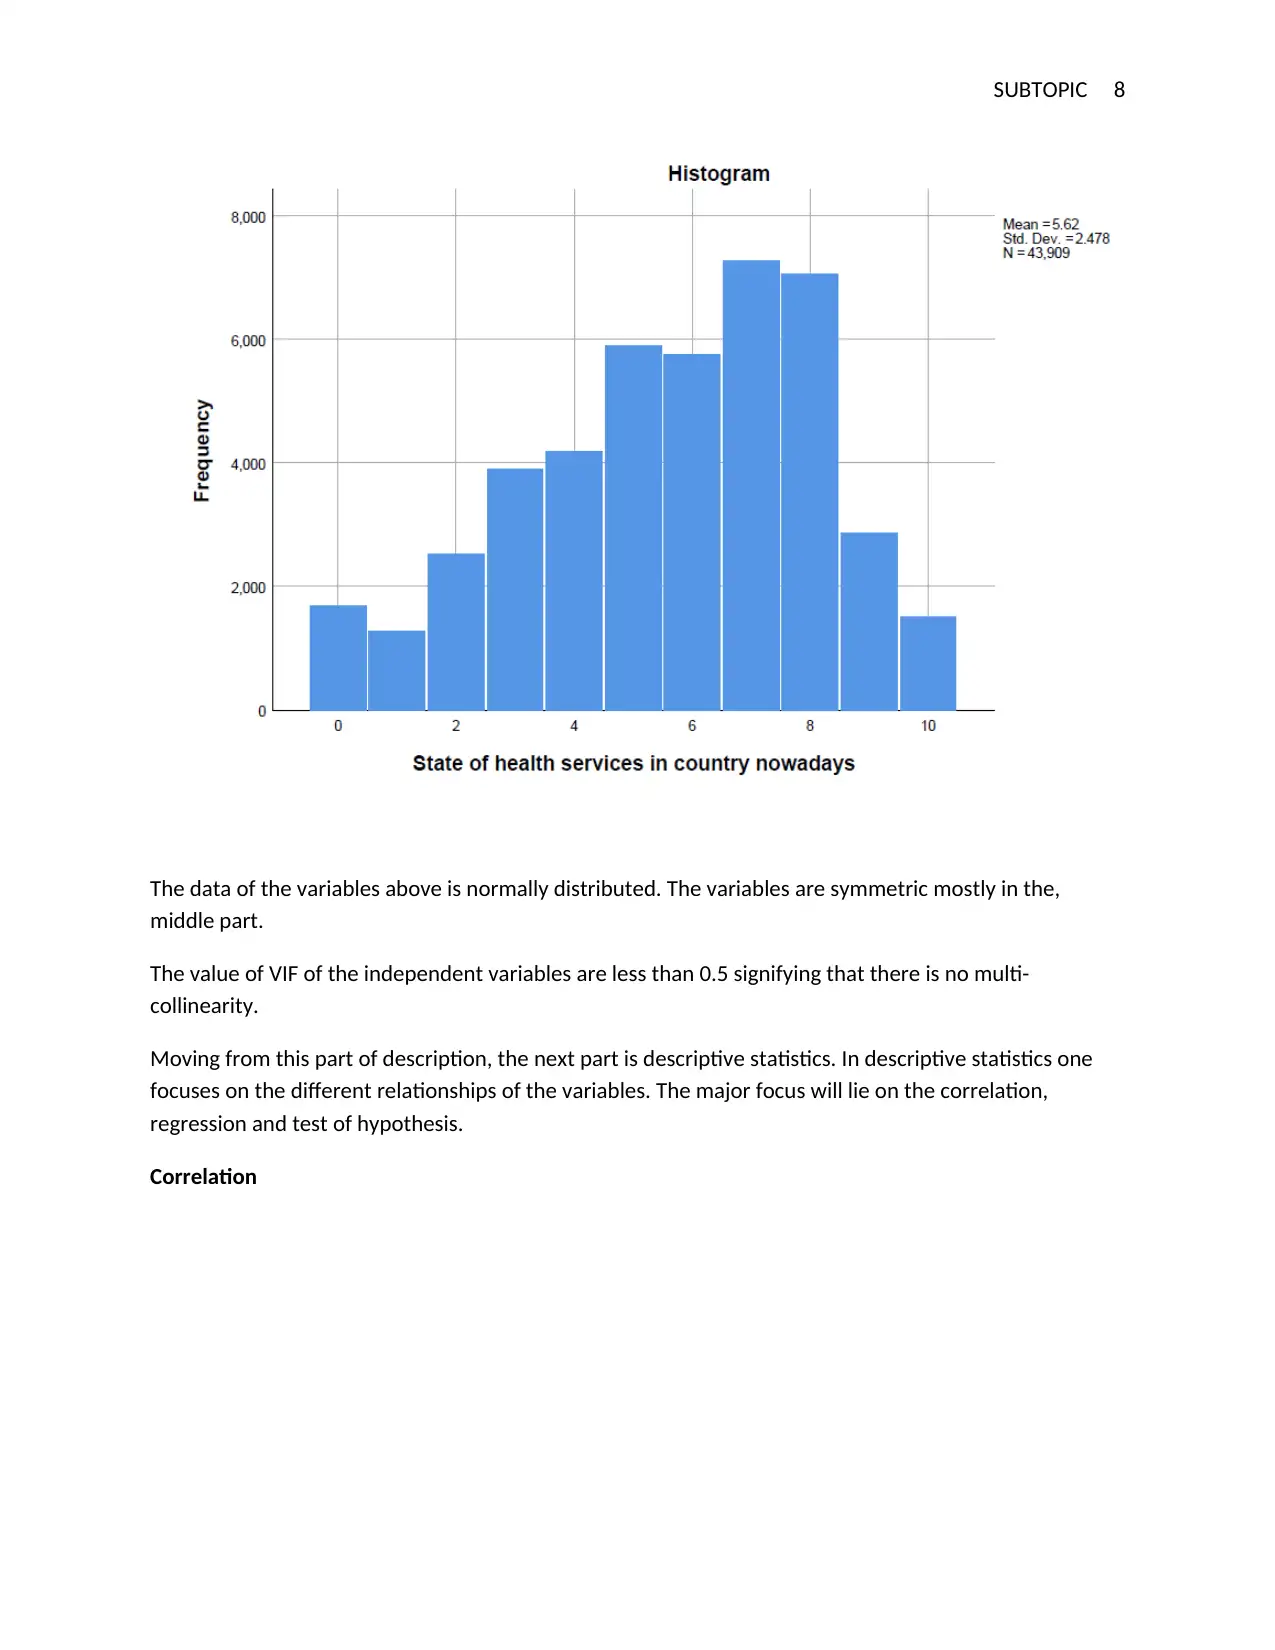
The data of the variables above is normally distributed. The variables are symmetric mostly in the,
middle part.
The value of VIF of the independent variables are less than 0.5 signifying that there is no multi-
collinearity.
Moving from this part of description, the next part is descriptive statistics. In descriptive statistics one
focuses on the different relationships of the variables. The major focus will lie on the correlation,
regression and test of hypothesis.
Correlation
SUBTOPIC 9
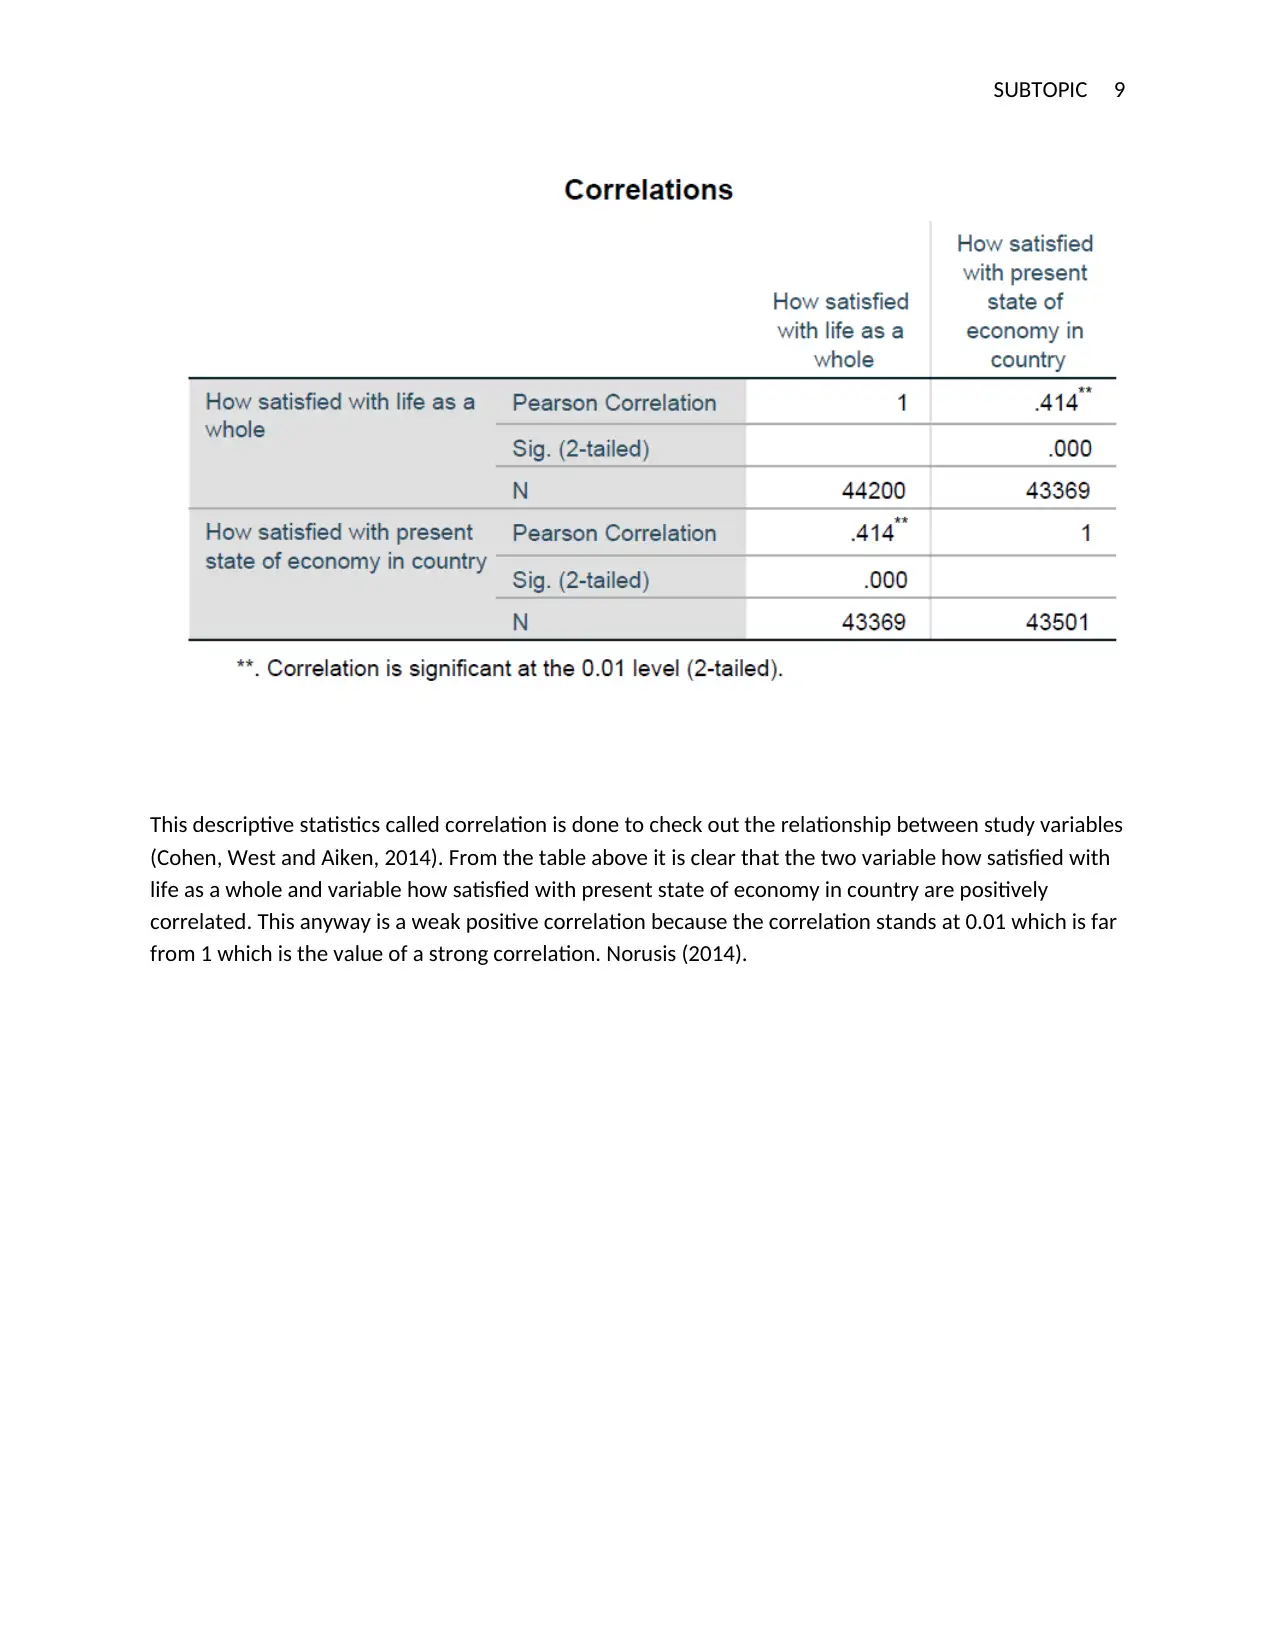
This descriptive statistics called correlation is done to check out the relationship between study variables
(Cohen, West and Aiken, 2014). From the table above it is clear that the two variable how satisfied with
life as a whole and variable how satisfied with present state of economy in country are positively
correlated. This anyway is a weak positive correlation because the correlation stands at 0.01 which is far
from 1 which is the value of a strong correlation. Norusis (2014).
⊘ This is a preview!⊘
Do you want full access?
Subscribe today to unlock all pages.
Trusted by 1+ million students worldwide
SUBTOPIC 10
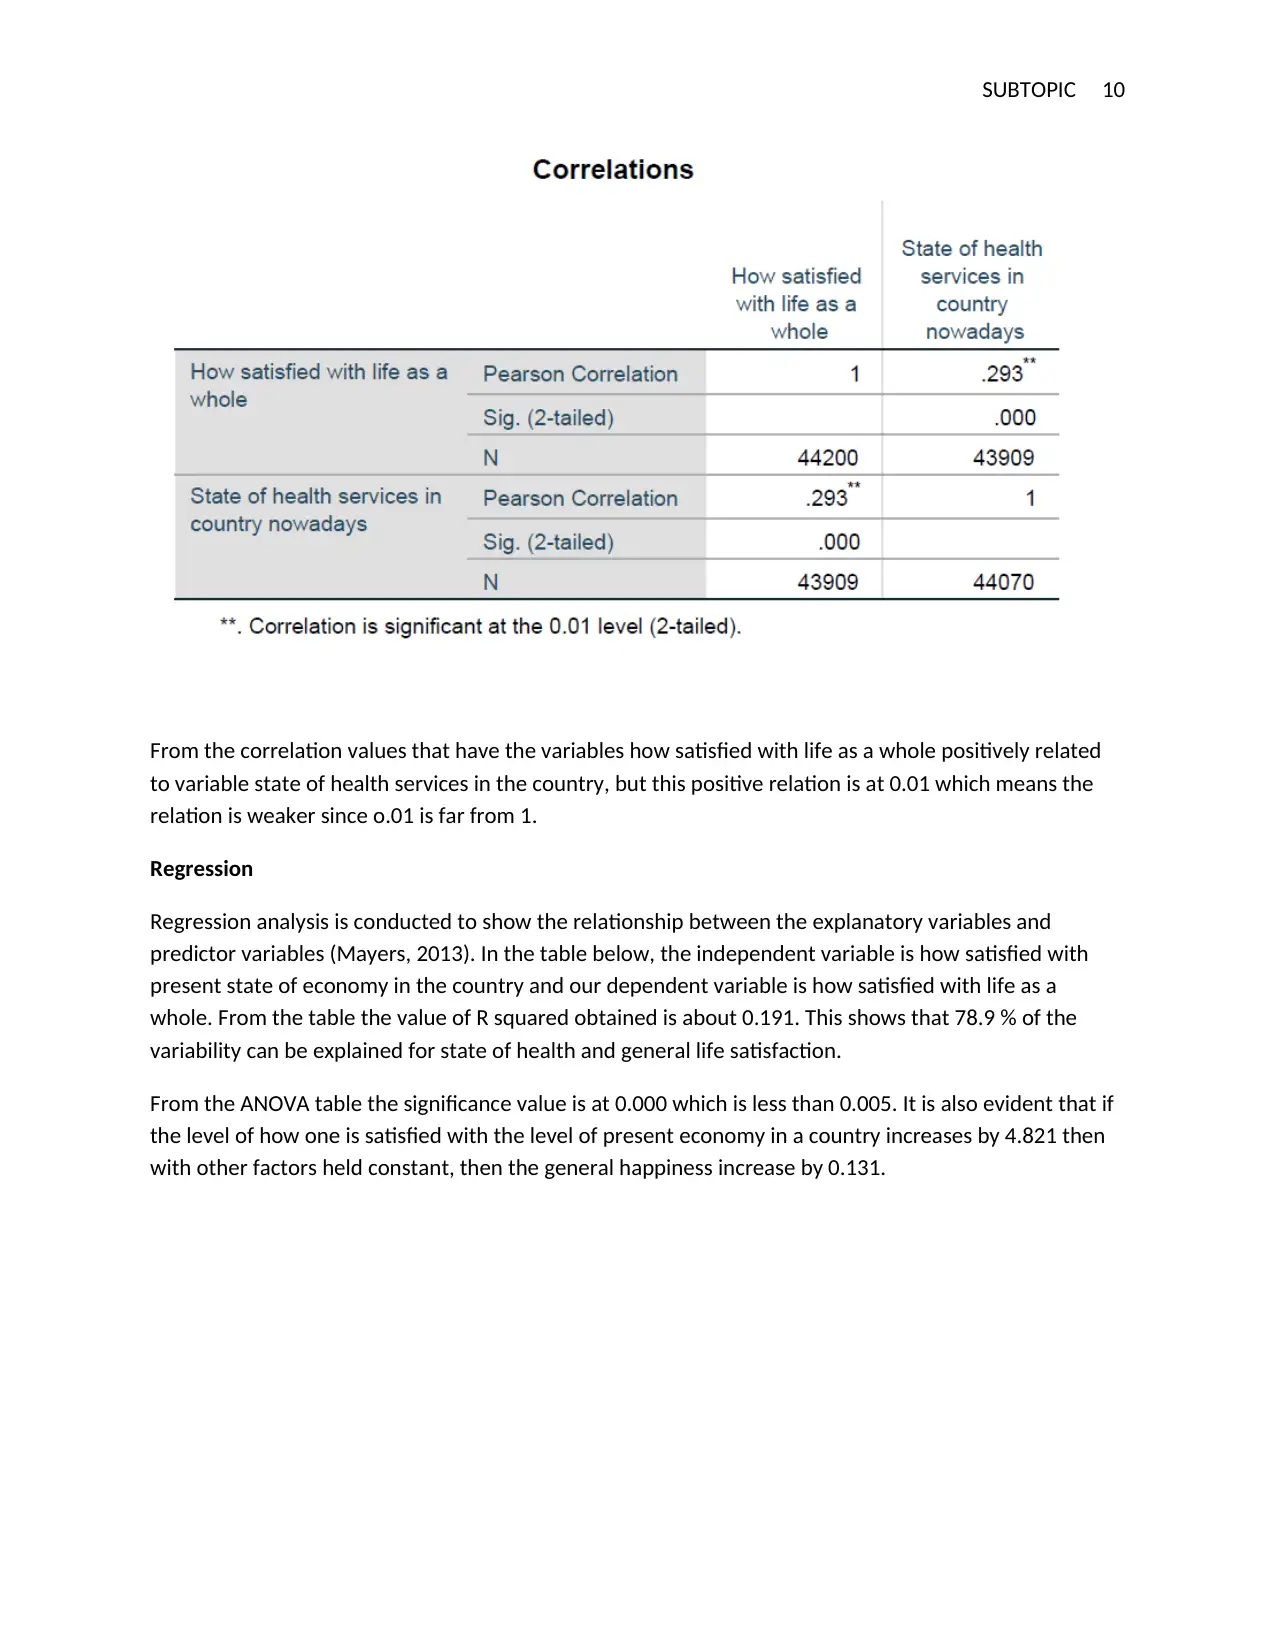
From the correlation values that have the variables how satisfied with life as a whole positively related
to variable state of health services in the country, but this positive relation is at 0.01 which means the
relation is weaker since o.01 is far from 1.
Regression
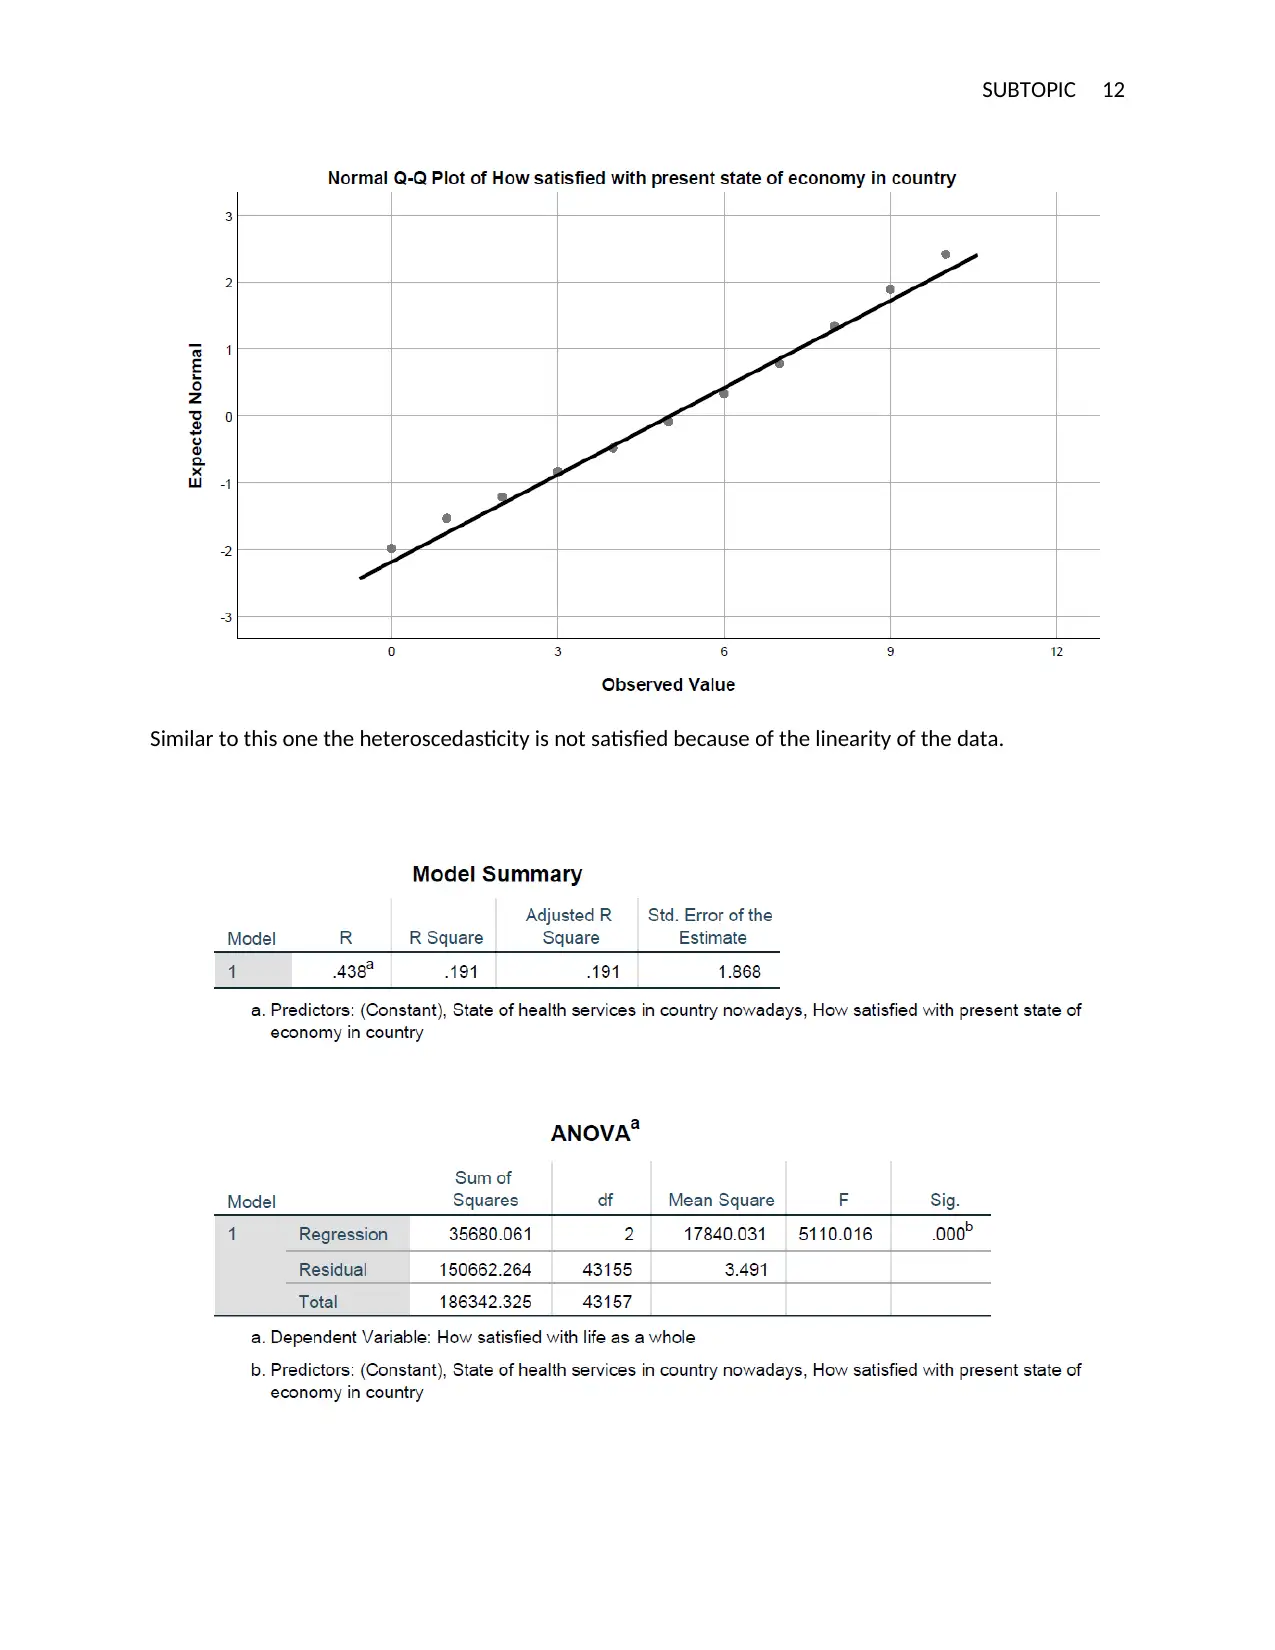
Regression analysis is conducted to show the relationship between the explanatory variables and
predictor variables (Mayers, 2013). In the table below, the independent variable is how satisfied with
present state of economy in the country and our dependent variable is how satisfied with life as a
whole. From the table the value of R squared obtained is about 0.191. This shows that 78.9 % of the
variability can be explained for state of health and general life satisfaction.
From the ANOVA table the significance value is at 0.000 which is less than 0.005. It is also evident that if
the level of how one is satisfied with the level of present economy in a country increases by 4.821 then
with other factors held constant, then the general happiness increase by 0.131.
From the correlation values that have the variables how satisfied with life as a whole positively related
to variable state of health services in the country, but this positive relation is at 0.01 which means the
relation is weaker since o.01 is far from 1.
Regression
Regression analysis is conducted to show the relationship between the explanatory variables and
predictor variables (Mayers, 2013). In the table below, the independent variable is how satisfied with
present state of economy in the country and our dependent variable is how satisfied with life as a
whole. From the table the value of R squared obtained is about 0.191. This shows that 78.9 % of the
variability can be explained for state of health and general life satisfaction.
From the ANOVA table the significance value is at 0.000 which is less than 0.005. It is also evident that if
the level of how one is satisfied with the level of present economy in a country increases by 4.821 then
with other factors held constant, then the general happiness increase by 0.131.
Paraphrase This Document
Need a fresh take? Get an instant paraphrase of this document with our AI Paraphraser
SUBTOPIC 11
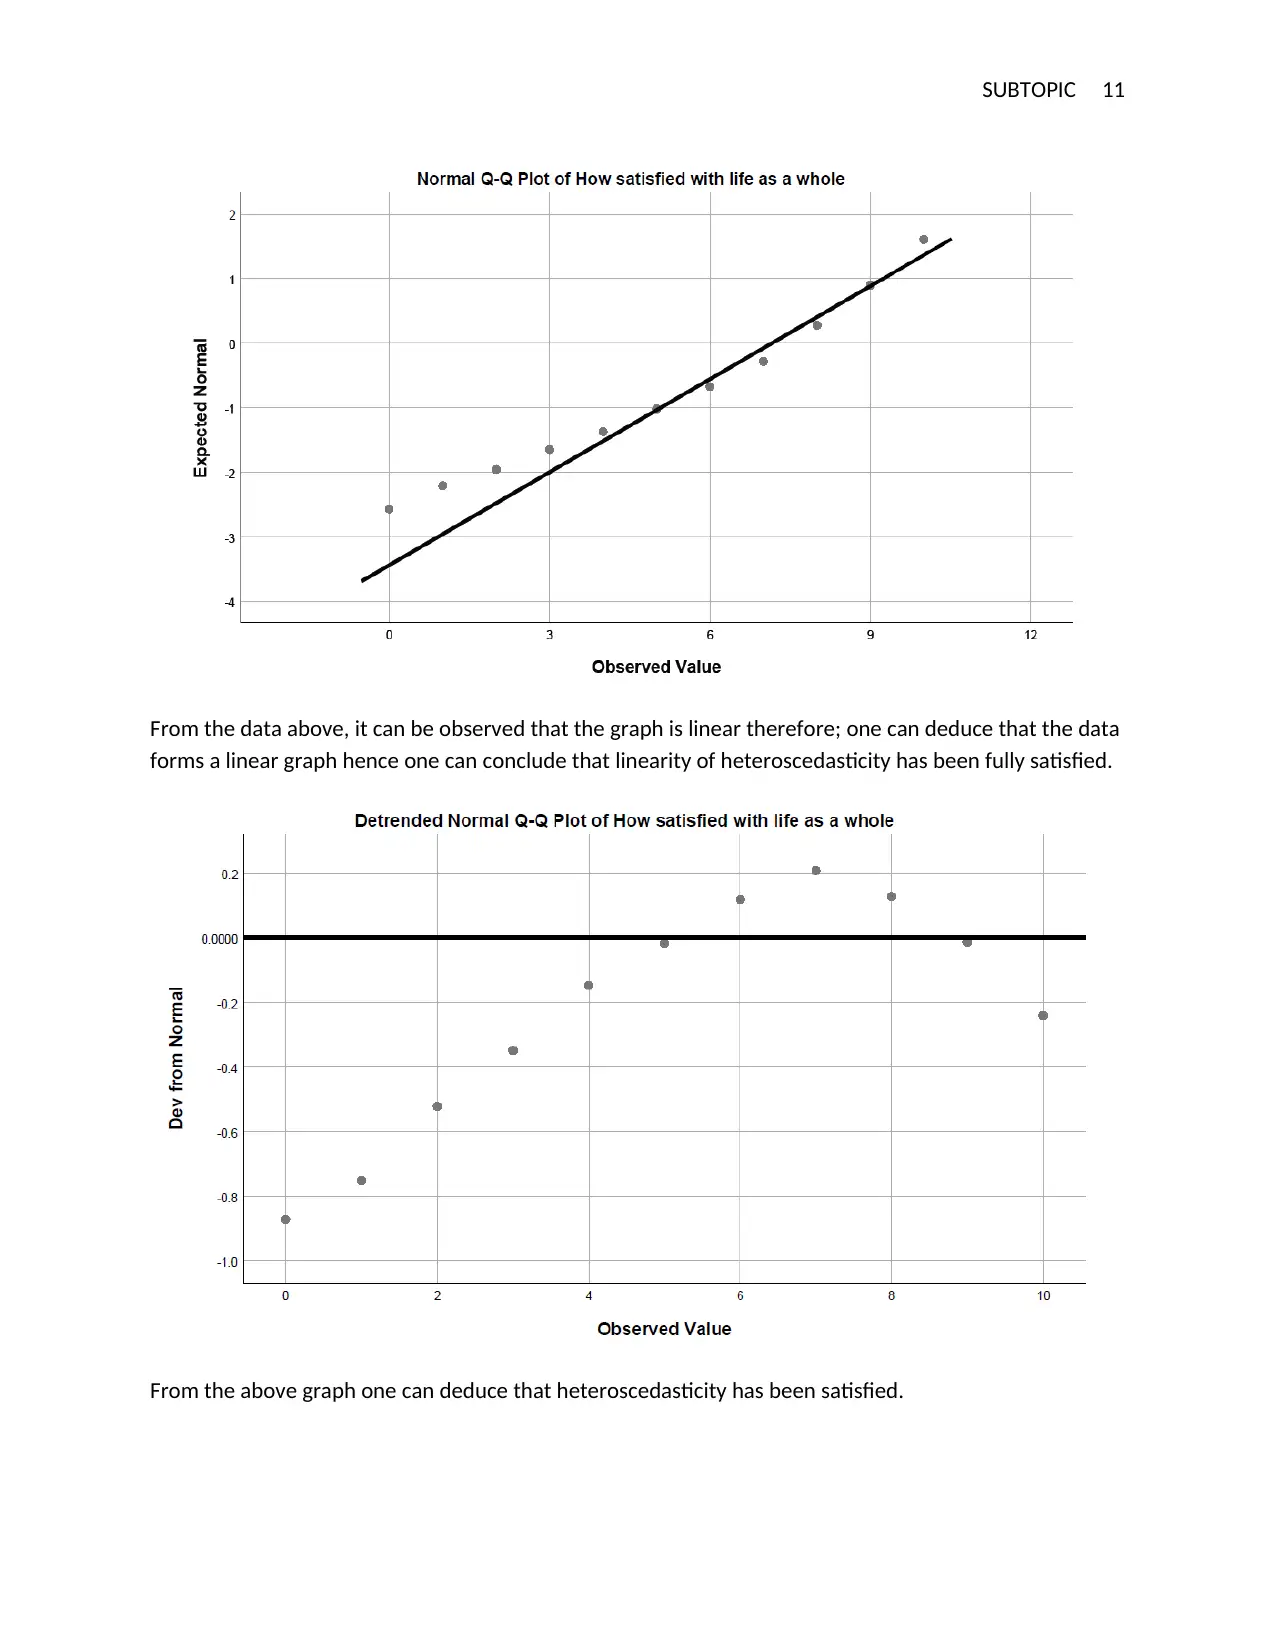
From the data above, it can be observed that the graph is linear therefore; one can deduce that the data
forms a linear graph hence one can conclude that linearity of heteroscedasticity has been fully satisfied.
From the above graph one can deduce that heteroscedasticity has been satisfied.
From the data above, it can be observed that the graph is linear therefore; one can deduce that the data
forms a linear graph hence one can conclude that linearity of heteroscedasticity has been fully satisfied.
From the above graph one can deduce that heteroscedasticity has been satisfied.
SUBTOPIC 12
Similar to this one the heteroscedasticity is not satisfied because of the linearity of the data.
Similar to this one the heteroscedasticity is not satisfied because of the linearity of the data.
⊘ This is a preview!⊘
Do you want full access?
Subscribe today to unlock all pages.
Trusted by 1+ million students worldwide
1 out of 14
Your All-in-One AI-Powered Toolkit for Academic Success.
+13062052269
info@desklib.com
Available 24*7 on WhatsApp / Email
![[object Object]](/_next/static/media/star-bottom.7253800d.svg)
Unlock your academic potential
Copyright © 2020–2026 A2Z Services. All Rights Reserved. Developed and managed by ZUCOL.