Economics and Quantitative Analysis: Life Satisfaction and GDP Report
VerifiedAdded on 2022/08/14
|10
|1546
|12
Report
AI Summary
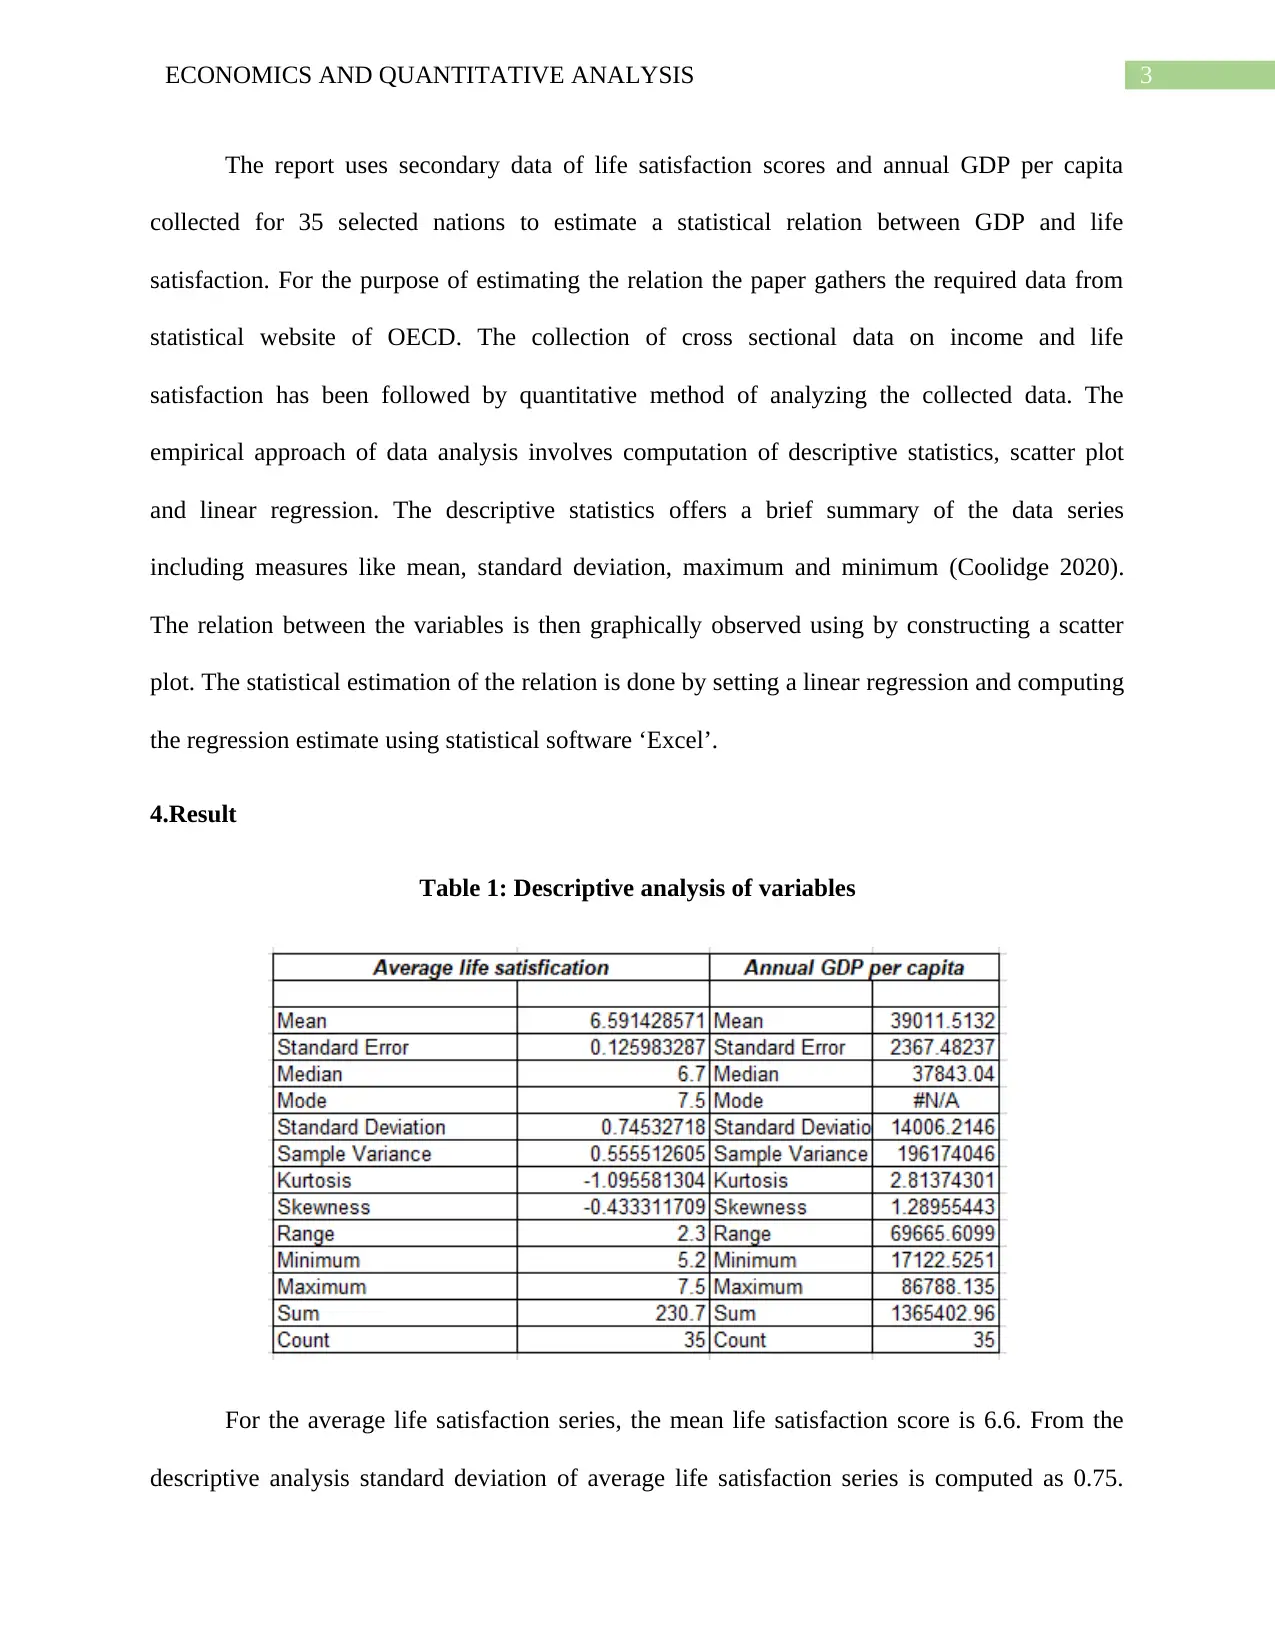
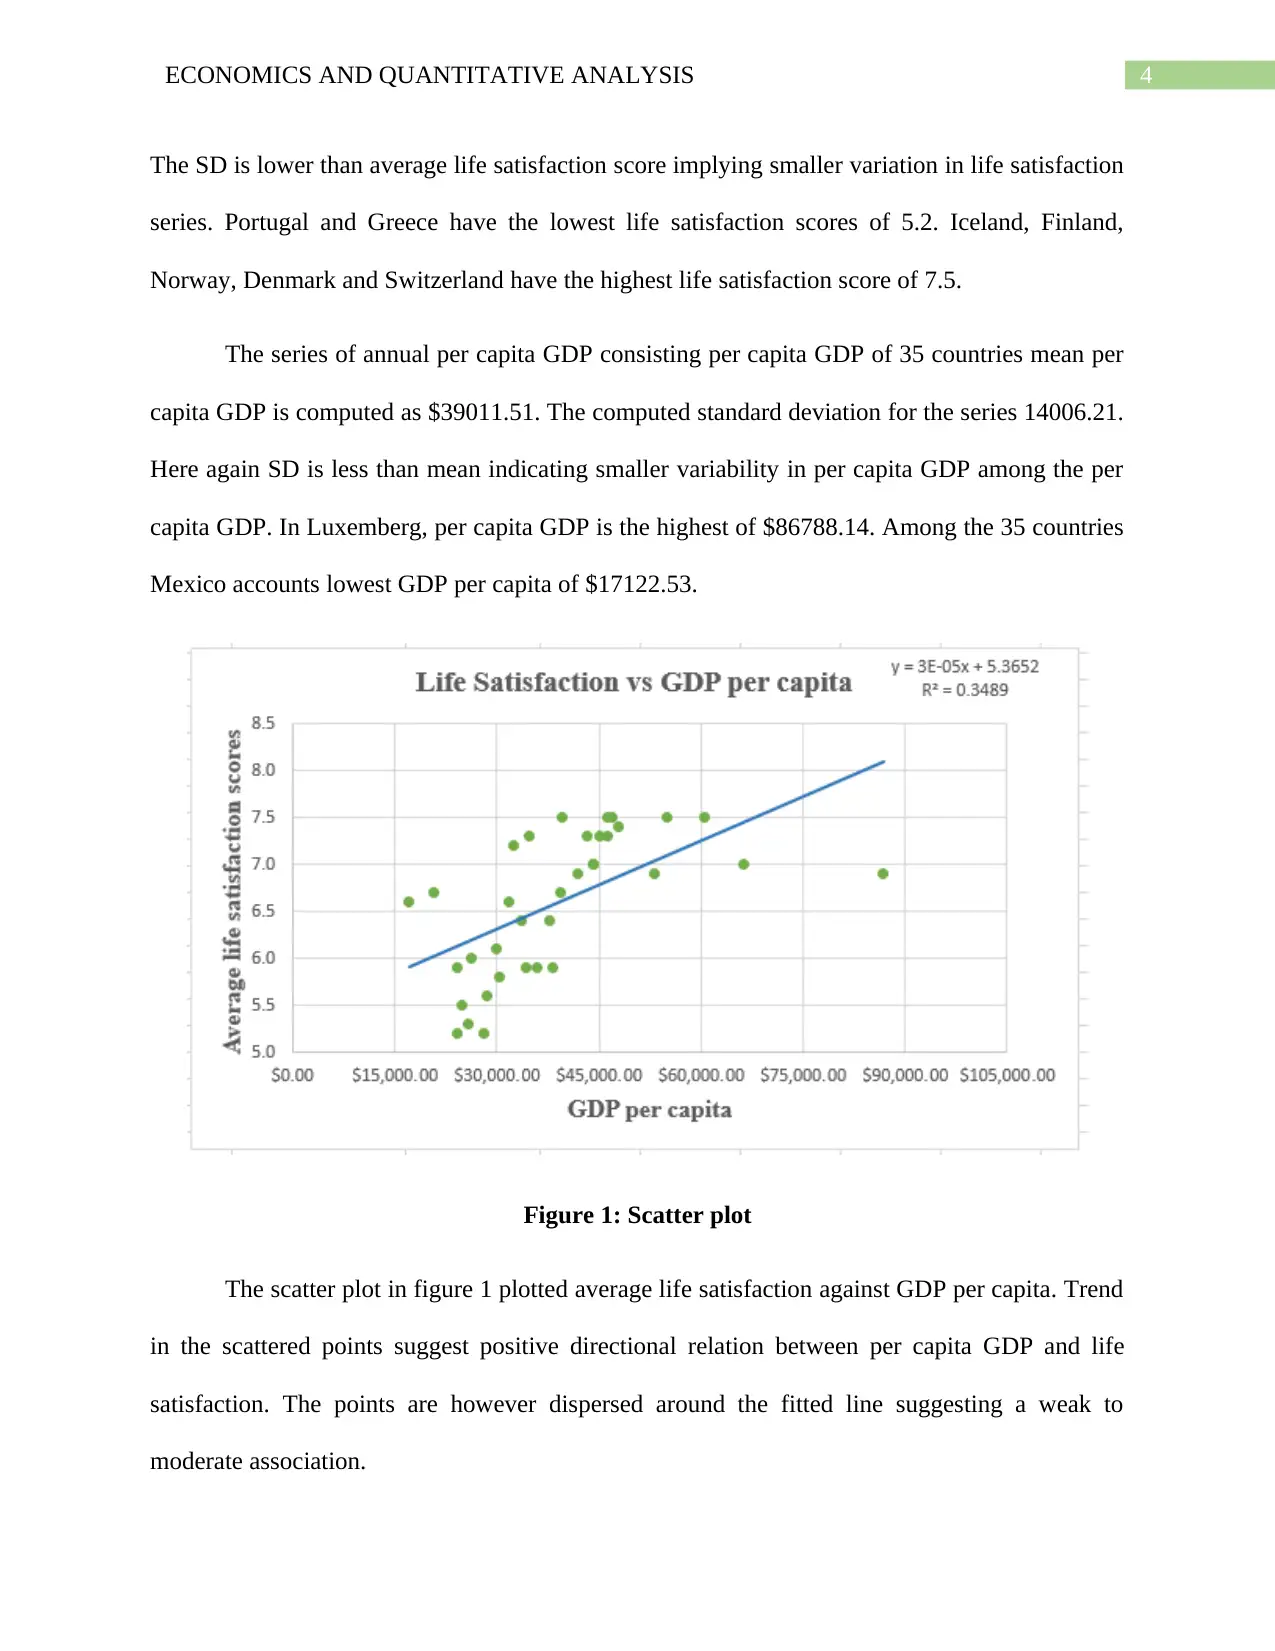
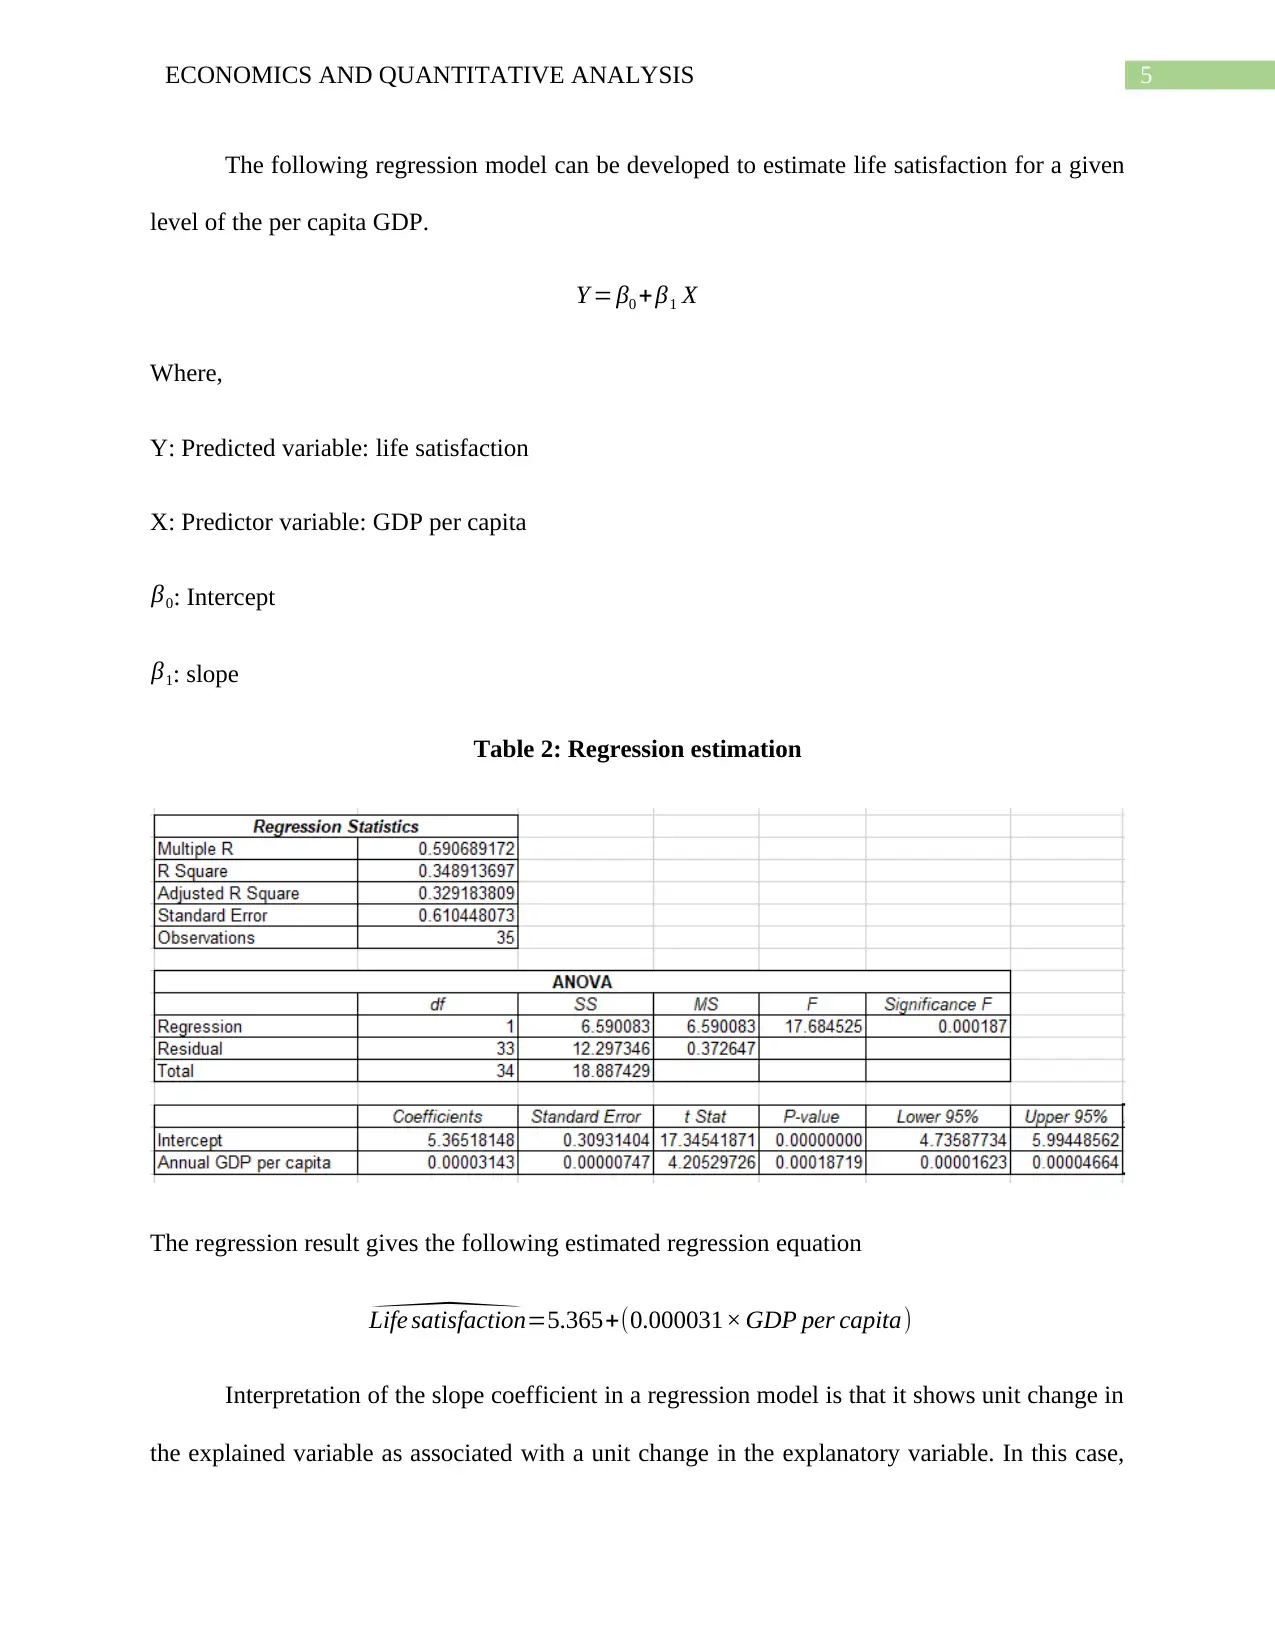
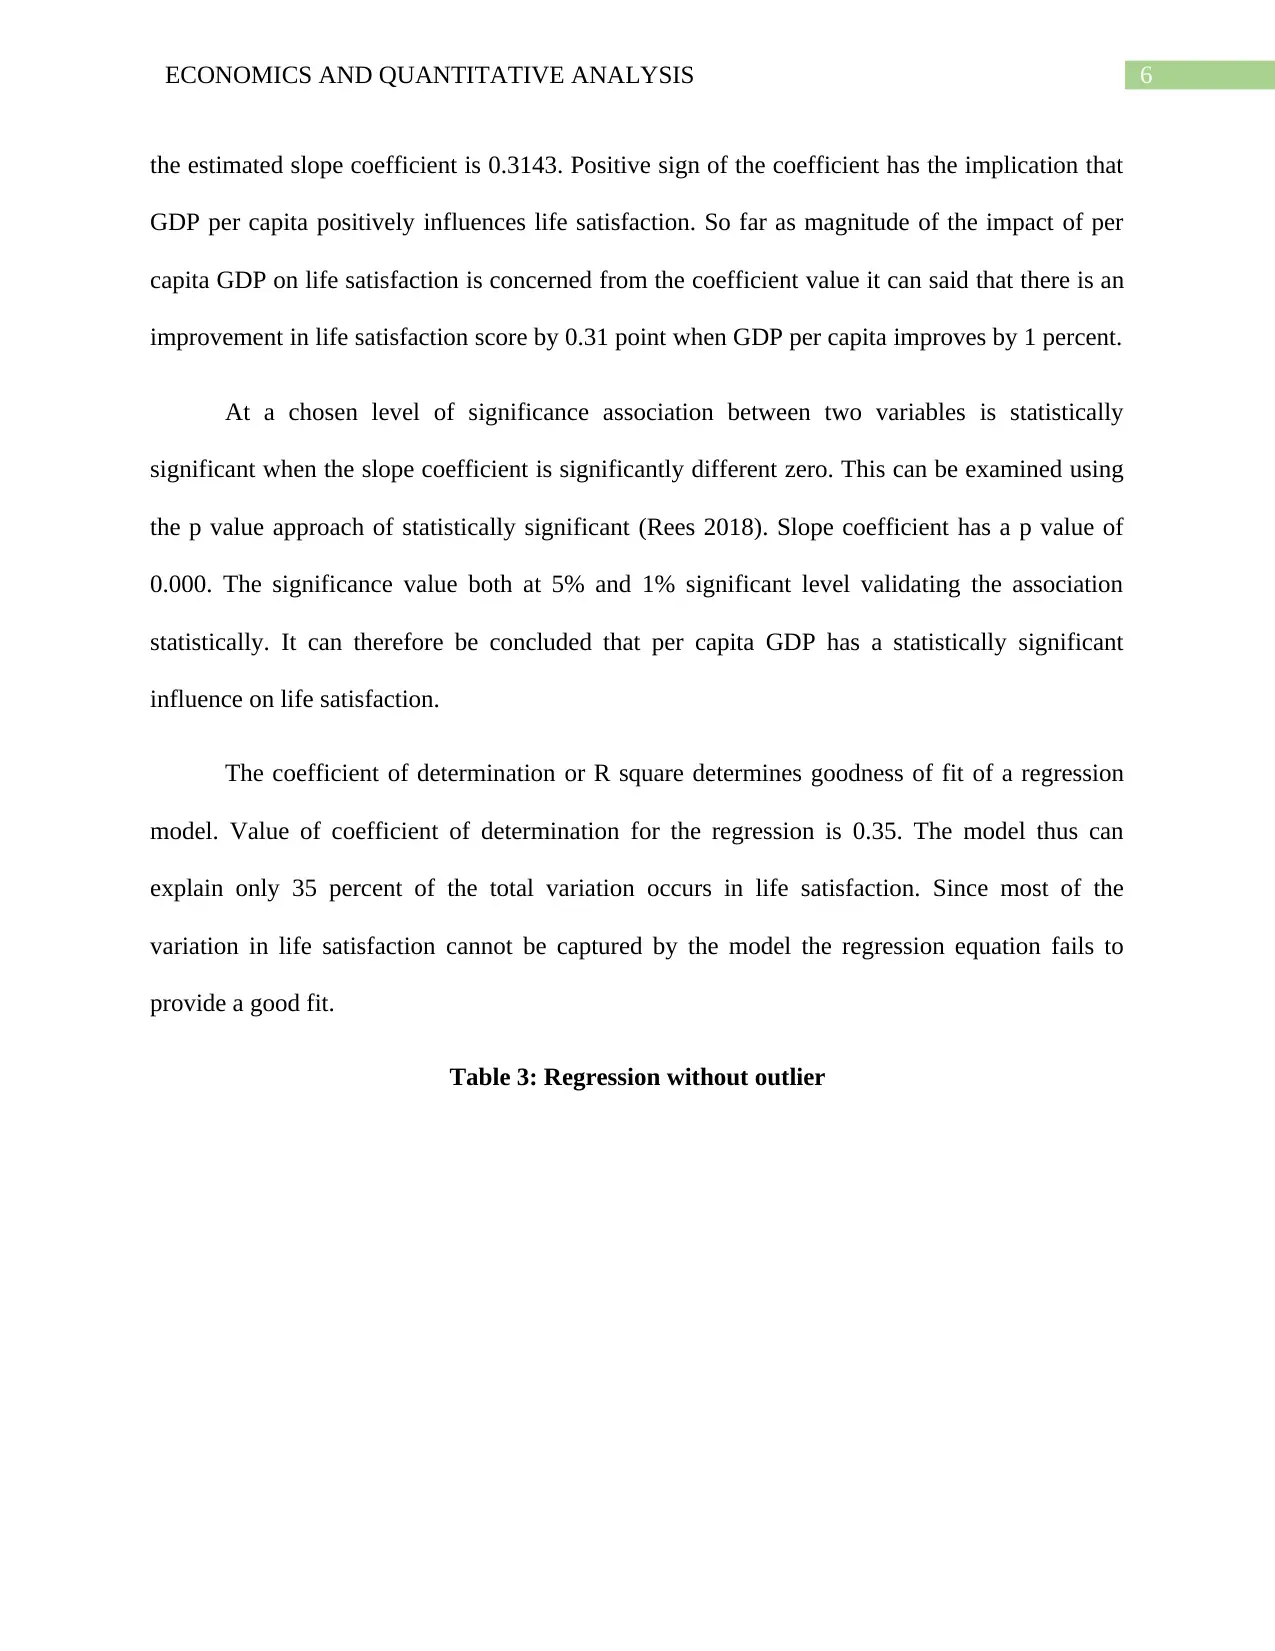
This report, prepared for an economics course, investigates the statistical relationship between average life satisfaction and GDP per capita using OECD cross-sectional data. The report begins with a clear statement of purpose and provides a brief literature review on the existing economic studies regarding subjective well-being and its relation to income. The methodology section details the use of secondary data, descriptive statistics, scatter plots, and linear regression analysis to estimate the association. The results section presents descriptive statistics of the variables, a scatter plot illustrating the relationship, and the results of the regression analysis, including interpretation of the slope coefficient, p-value, and coefficient of determination. The report discusses the findings, comparing them to existing literature and considering the limitations of the analysis, such as the use of data from only 35 countries. The report concludes with recommendations for policies aimed at increasing GDP and improving life satisfaction, emphasizing investments in infrastructure, human capital, and employment opportunities.

Running head: ECONOMICS AND QUANTITATIVE ANALYSIS
Economics and Quantitative Analysis
Name of the Student
Name of the University
Student ID
Economics and Quantitative Analysis
Name of the Student
Name of the University
Student ID
Paraphrase This Document
Need a fresh take? Get an instant paraphrase of this document with our AI Paraphraser

1ECONOMICS AND QUANTITATIVE ANALYSIS
Table of Contents
1.Purpose.........................................................................................................................................2
2.Background...................................................................................................................................2
3.Method..........................................................................................................................................2
4.Result............................................................................................................................................3
5. Discussion....................................................................................................................................7
6. Recommendation.........................................................................................................................8
Reference list...................................................................................................................................9

2ECONOMICS AND QUANTITATIVE ANALYSIS
1.Purpose
The report intends to prepare a short report with the objective of examining statistical
association between average life satisfaction and GDP per capita using OECD cross sectional
data.
2.Background
Economic studies have put great importance on studying subjective well-being or
individual utility. The recent trend added to these studies is to examine the relation of subjective
well-being with economic factors with income being one primary economic factor influencing
life satisfaction. Economists engage in studying life satisfaction at least for three well-specified
reasons. First, state of happiness among people in the society determines the support to market
economy. Second, keeping people happy is one primary goal of policy makers. Third, it is
important to understand the relation between objective and subjective determinant of well-being.
One study as developed by Easterlin used the US data during post war period and confirmed that
happiness of people is independent of income (Strulik 2015). As a contradiction to this finding of
Easterning some other literatures concluded a positive association between income and life
satisfaction. Similar findings have also been confirmed by a panel study that considered data of
five households. Some other papers challenged the findings and suggests happiness varies with
income but only up to a certain limit (Stevenson and Wolfers 2013). Given the differences in
opinions among the economists and scientists related to connection between life satisfaction and
income researchers show continuous interest to explore the relation.
3.Method
⊘ This is a preview!⊘
Do you want full access?
Subscribe today to unlock all pages.

Trusted by 1+ million students worldwide

3ECONOMICS AND QUANTITATIVE ANALYSIS
The report uses secondary data of life satisfaction scores and annual GDP per capita
collected for 35 selected nations to estimate a statistical relation between GDP and life
satisfaction. For the purpose of estimating the relation the paper gathers the required data from
statistical website of OECD. The collection of cross sectional data on income and life
satisfaction has been followed by quantitative method of analyzing the collected data. The
empirical approach of data analysis involves computation of descriptive statistics, scatter plot
and linear regression. The descriptive statistics offers a brief summary of the data series
including measures like mean, standard deviation, maximum and minimum (Coolidge 2020).
The relation between the variables is then graphically observed using by constructing a scatter
plot. The statistical estimation of the relation is done by setting a linear regression and computing
the regression estimate using statistical software ‘Excel’.
4.Result
Table 1: Descriptive analysis of variables
For the average life satisfaction series, the mean life satisfaction score is 6.6. From the
descriptive analysis standard deviation of average life satisfaction series is computed as 0.75.
Paraphrase This Document
Need a fresh take? Get an instant paraphrase of this document with our AI Paraphraser

4ECONOMICS AND QUANTITATIVE ANALYSIS
The SD is lower than average life satisfaction score implying smaller variation in life satisfaction
series. Portugal and Greece have the lowest life satisfaction scores of 5.2. Iceland, Finland,
Norway, Denmark and Switzerland have the highest life satisfaction score of 7.5.
The series of annual per capita GDP consisting per capita GDP of 35 countries mean per
capita GDP is computed as $39011.51. The computed standard deviation for the series 14006.21.
Here again SD is less than mean indicating smaller variability in per capita GDP among the per
capita GDP. In Luxemberg, per capita GDP is the highest of $86788.14. Among the 35 countries
Mexico accounts lowest GDP per capita of $17122.53.
Figure 1: Scatter plot
The scatter plot in figure 1 plotted average life satisfaction against GDP per capita. Trend
in the scattered points suggest positive directional relation between per capita GDP and life
satisfaction. The points are however dispersed around the fitted line suggesting a weak to
moderate association.

5ECONOMICS AND QUANTITATIVE ANALYSIS
The following regression model can be developed to estimate life satisfaction for a given
level of the per capita GDP.
Y = β0 +β1 X
Where,
Y: Predicted variable: life satisfaction
X: Predictor variable: GDP per capita
β0: Intercept
β1: slope
Table 2: Regression estimation
The regression result gives the following estimated regression equation
^Life satisfaction=5.365+(0.000031× GDP per capita)
Interpretation of the slope coefficient in a regression model is that it shows unit change in
the explained variable as associated with a unit change in the explanatory variable. In this case,
⊘ This is a preview!⊘
Do you want full access?
Subscribe today to unlock all pages.

Trusted by 1+ million students worldwide

6ECONOMICS AND QUANTITATIVE ANALYSIS
the estimated slope coefficient is 0.3143. Positive sign of the coefficient has the implication that
GDP per capita positively influences life satisfaction. So far as magnitude of the impact of per
capita GDP on life satisfaction is concerned from the coefficient value it can said that there is an
improvement in life satisfaction score by 0.31 point when GDP per capita improves by 1 percent.
At a chosen level of significance association between two variables is statistically
significant when the slope coefficient is significantly different zero. This can be examined using
the p value approach of statistically significant (Rees 2018). Slope coefficient has a p value of
0.000. The significance value both at 5% and 1% significant level validating the association
statistically. It can therefore be concluded that per capita GDP has a statistically significant
influence on life satisfaction.
The coefficient of determination or R square determines goodness of fit of a regression
model. Value of coefficient of determination for the regression is 0.35. The model thus can
explain only 35 percent of the total variation occurs in life satisfaction. Since most of the
variation in life satisfaction cannot be captured by the model the regression equation fails to
provide a good fit.
Table 3: Regression without outlier
Paraphrase This Document
Need a fresh take? Get an instant paraphrase of this document with our AI Paraphraser

7ECONOMICS AND QUANTITATIVE ANALYSIS
Dropping the outlier values has improved the regression model both in terms of estimated
value of slope coefficient and model fitness. Associated slope coefficient for the mode is 0.5514.
The new slope coefficient suggests that life satisfaction score improves by 0.55 points compared
of 0.31 points in the previous model given 1 percent increase in GDP per capita. The
improvement in model fitness can be observed from a higher value of coefficient of
determination (Cameron and Trivedi 2013). The coefficient of determination now is 0.50
meaning the model now accounts half of total variation in life satisfaction. This in turn indicates
a better fit relative to previous model.
5. Discussion
Investigation of relation between income and life satisfaction has confirmed that income
entails a positive significant influence on life satisfaction of people living in a nation. People
therefore likely to have the feeling of more satisfied when they earn a larger income.
The paper follows a systematic approach to arrive at the conclusion over the relation
between life satisfaction and GDP per capita. The quantitative data analysis method used in the
paper include descriptive analysis, scatter plot and regression. The analysis involves simple

8ECONOMICS AND QUANTITATIVE ANALYSIS
estimation techniques and gives result that can be interpreted easily. Use of data of only 35
countries is one limitation of the analysis.
The positive relation between income and life satisfaction does not support Easterlin
paradox showing independence of relation between life satisfaction and income. The result of the
report however strengthens the findings in this field that believe life satisfaction changes
positively with income. The result of the paper along with other literatures with similar findings
thus has policy implication in terms of enhancing happiness or life satisfaction.
6. Recommendation
The paper has confirmed a positive association between income as measured by per
capita GDP and life satisfaction. Therefore, policies to increase GDP can lead to an
increase in life satisfaction. Making productive investment like improving infrastructure,
development of human capital and other can be helpful to increase GDP and income.
Creating employment opportunities is another means of supporting income which in turn
can enhance life satisfaction.
Besides income other aspects of well-being such as health, education, environmental
quality and so on needs to be improved to increase well-being.
⊘ This is a preview!⊘
Do you want full access?
Subscribe today to unlock all pages.

Trusted by 1+ million students worldwide

9ECONOMICS AND QUANTITATIVE ANALYSIS
Reference list
Cameron, A.C. and Trivedi, P.K., 2013. Regression analysis of count data (Vol. 53). Cambridge
university press.
Coolidge, F.L., 2020. Statistics: A gentle introduction. SAGE Publications, Incorporated.
Ngamaba, K.H., 2016. Happiness and life satisfaction in Rwanda. Journal of Psychology in
Africa, 26(5), pp.407-414.
Rees, D.G., 2018. Essential statistics. Chapman and Hall/CRC.
Stevenson, B. and Wolfers, J., 2013. Subjective well-being and income: Is there any evidence of
satiation?. American Economic Review, 103(3), pp.598-604.
Strulik, H., 2015. Preferences, income, and life satisfaction: An equivalence
result. Mathematical Social Sciences, 75, pp.20-26.
1 out of 10
Related Documents
Your All-in-One AI-Powered Toolkit for Academic Success.
+13062052269
info@desklib.com
Available 24*7 on WhatsApp / Email
Unlock your academic potential
Copyright © 2020–2025 A2Z Services. All Rights Reserved. Developed and managed by ZUCOL.


