Term Project: Analyzing Life Satisfaction and GDP in OECD Countries

Verified

Added on  2022/09/12

|34
|1800
|60
Project
AI Summary
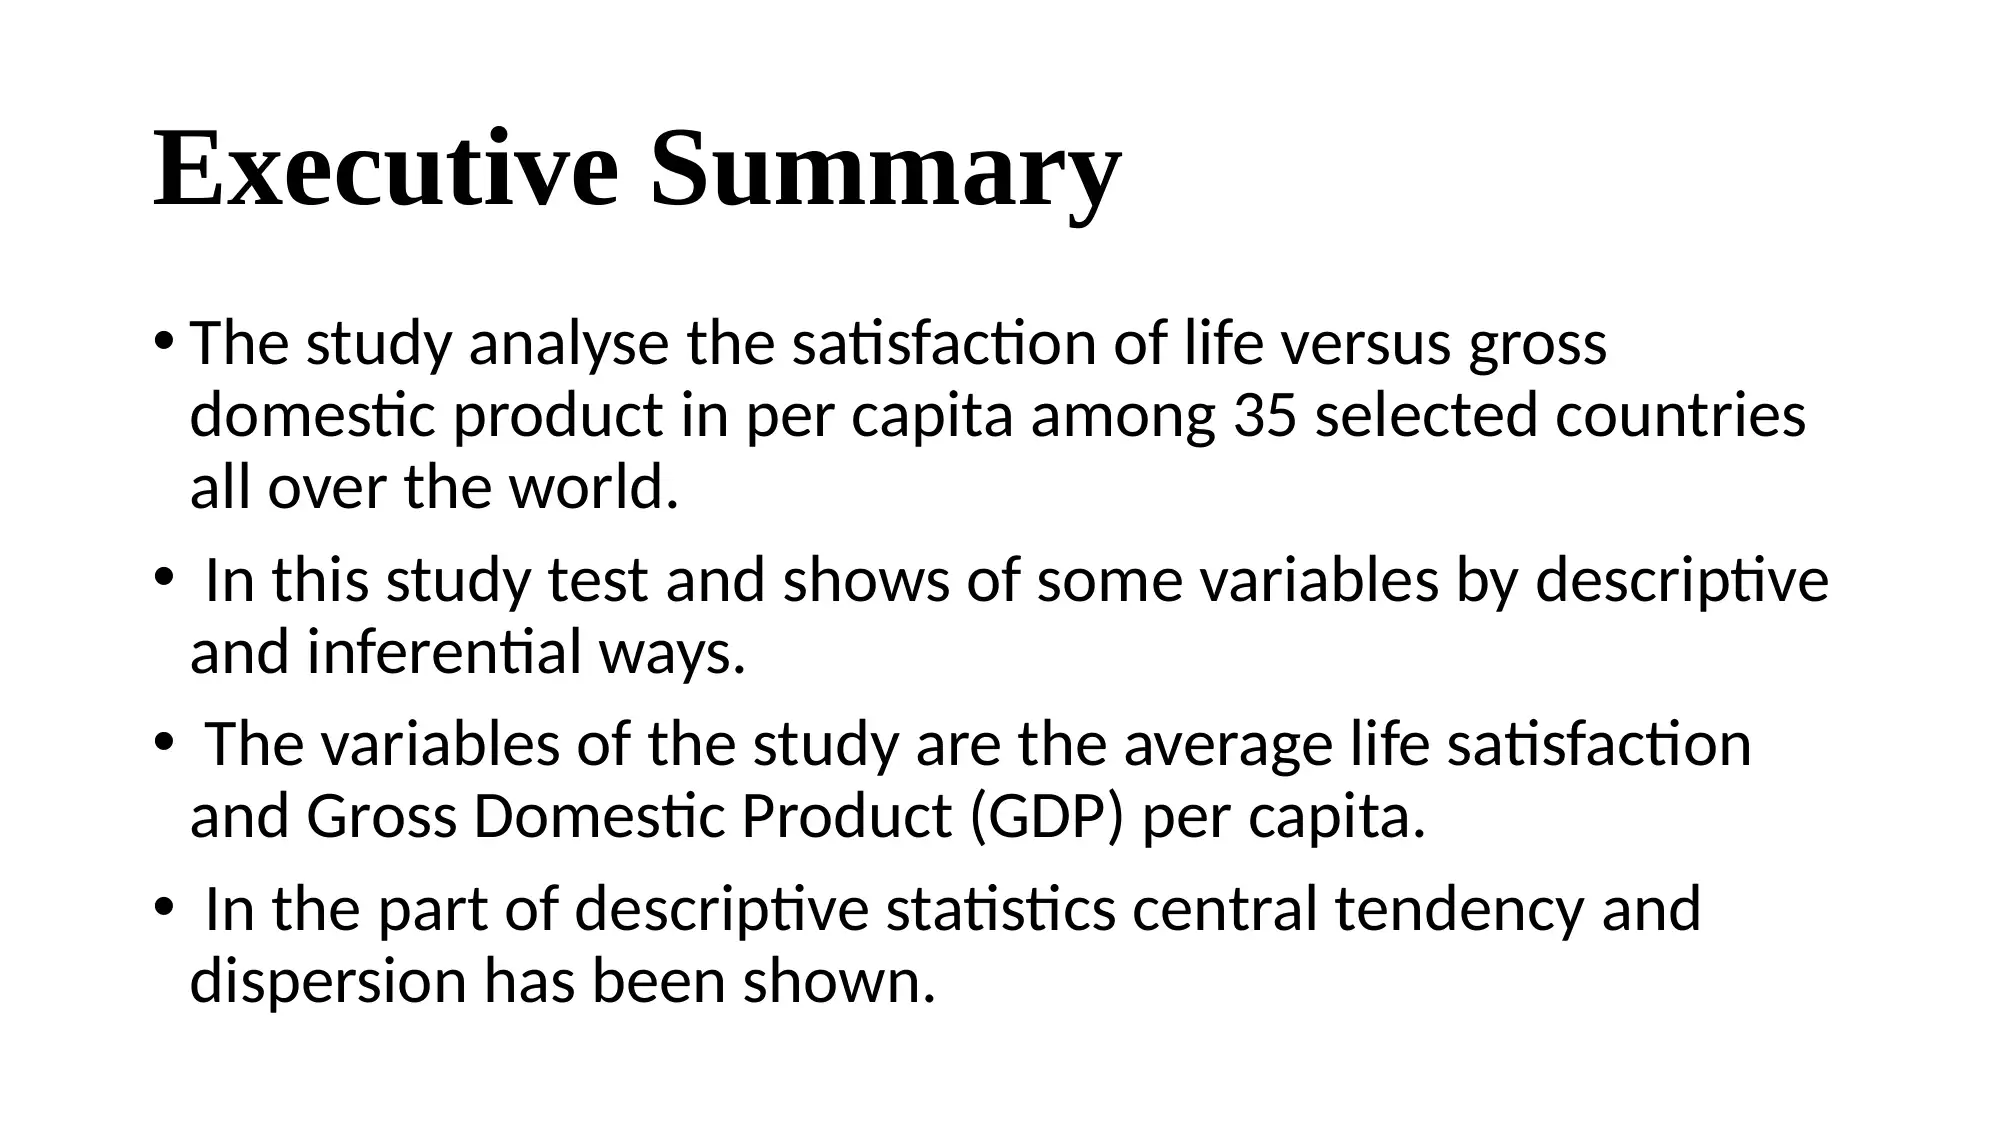
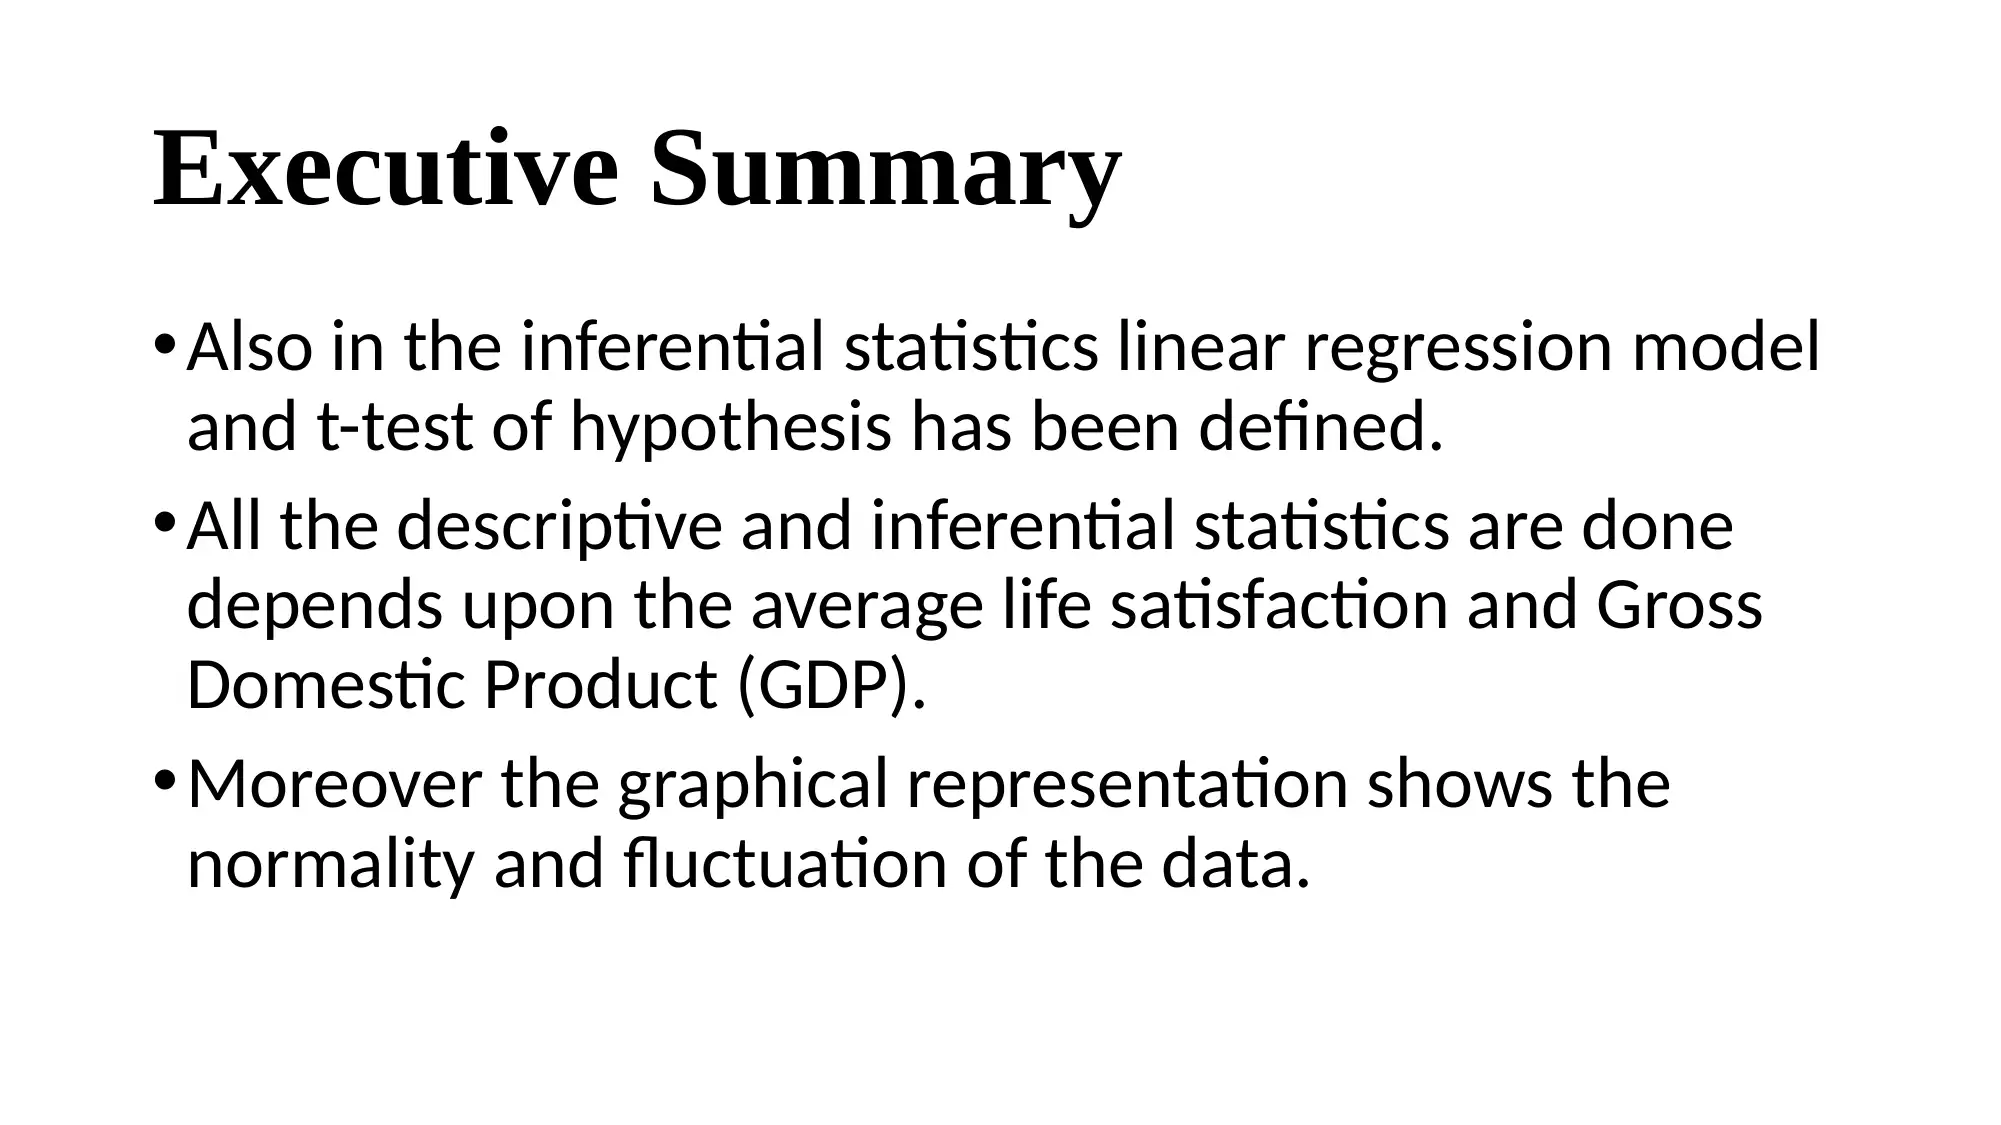
This project presents a quantitative analysis of the relationship between average life satisfaction and GDP per capita across 35 OECD countries. The study employs secondary data from 2017, utilizing descriptive and inferential statistics to explore this relationship. Descriptive statistics include measures of central tendency and dispersion for both variables. Inferential statistics involve a linear regression model, t-tests, and correlation analysis to test hypotheses about the association between life satisfaction and GDP. The project includes graphical representations such as histograms and scatter plots to visualize the data. Key findings include a positive correlation between life satisfaction and GDP, with specific recommendations for governmental policies to improve life satisfaction. The analysis concludes with references and a discussion of the limitations and implications of the findings. The study also includes hypothesis testing and the coefficient of determination.
Document Page
A Study On average life
satisfaction and GDP per capita
in OECD
tabler-icon-diamond-filled.svg

Paraphrase This Document

Need a fresh take? Get an instant paraphrase of this document with our AI Paraphraser
Document Page
Contents of the study
Executive Summary
Introduction
Hypothesis
Method
Summary Measure
Regression Analysis
T-test
Scatter Plot
Correlation Coefficient and Coefficient of determination
Recommendation
Conclusion
References
Document Page
Executive Summary
The study analyse the satisfaction of life versus gross
domestic product in per capita among 35 selected countries
all over the world.
In this study test and shows of some variables by descriptive
and inferential ways.
The variables of the study are the average life satisfaction
and Gross Domestic Product (GDP) per capita.
In the part of descriptive statistics central tendency and
dispersion has been shown.
Document Page
Executive Summary
Also in the inferential statistics linear regression model
and t-test of hypothesis has been defined.
All the descriptive and inferential statistics are done
depends upon the average life satisfaction and Gross
Domestic Product (GDP).
Moreover the graphical representation shows the
normality and fluctuation of the data.
tabler-icon-diamond-filled.svg

Paraphrase This Document

Need a fresh take? Get an instant paraphrase of this document with our AI Paraphraser
Document Page
Introduction
The study analyse the satisfaction of life versus gross domestic
product in per capita among 35 selected countries all over the world.
The study provides the satisfaction of life and gross domestic product
per capita among the selected countries (Balestra, Boarini & Tosetto,
2018).
The main hypothesis of the study is to show the relationship between
the life satisfaction and the gross domestic product per capita.
Document Page
Introduction
From the point of purchasing power and parity a riches power of
the country is on the downward direction when the nation has a
gross domestic product fewer than 15,000 USD (Brown, Oueslati
& Silva, 2016).
The presence of high or low gross domestic product and
satisfaction of life of a people defines the economic condition of
a country.
The study reflect the relation between satisfaction of life and
gross domestic product by simple linear regression model.
Document Page
Hypothesis
To determine that the relationship
between average life satisfaction and
GDP.
To test that the average life satisfaction
is not more than 7.
tabler-icon-diamond-filled.svg

Paraphrase This Document

Need a fresh take? Get an instant paraphrase of this document with our AI Paraphraser
Document Page
Method
The study has been conducted with the help of secondary data of
135 OECD countries.
The sample observations has been collected during the period of
2017.
The summary statistics and the regression analysis has been shown
to determine the relationship between life satisfactions versus gross
domestic product.
The study reflect the association between the satisfaction of life and
gross domestic product per capita among 35 selected countries.
Document Page
Method
In summary statistics the central tendency, measure of dispersion has been
illustrated (Bickel & Lehmann, 2012).
The simple linear regression model shows the association between these
two variable and also define the correlation coefficient and coefficient of
determination among the 35 countries.
The parameter satisfaction of life is measured on 5 to 8 scale unit. Also the
gross domestic product is defined in dollar scale.
The general formation of simple linear regression is (Draper & Smith, 2013)
Dependent variable = Intercept + Independent variables * slope of the
independent variable.
Document Page
Method
The dependent and independent variable of the study is life
satisfaction and the gross domestic product.
The measure of central tendency, dispersion, and all the graphical
representation ahs been done with the help of MS Excel.
In the selection of sample among all the different countries a list of
simple random sampling technique applied.
Firstly the secondary data has been collected.
After that with the help of lottery method there is are 35 countries
selected and analysed.
tabler-icon-diamond-filled.svg

Paraphrase This Document

Need a fresh take? Get an instant paraphrase of this document with our AI Paraphraser
Document Page
Histogram on Average Life
satisfaction
Document Page
Comment
Figure 1 illustrate the histogram on average life
satisfaction. In the X-axis define the class and Y-axis
define the frequency.
It is clear that the maximum of average life
satisfaction has been seen on 7 to 7.5 class.
Similarly the minimum of average life satisfaction has
been seen on the class of 6 to 6.5.
chevron_up_icon
1 out of 34
circle_padding
hide_on_mobile
zoom_out_icon
[object Object]