Linear Regression Analysis: Life Satisfaction and GDP

Verified

Added on  2022/08/13

|11
|1722
|33
Report
AI Summary
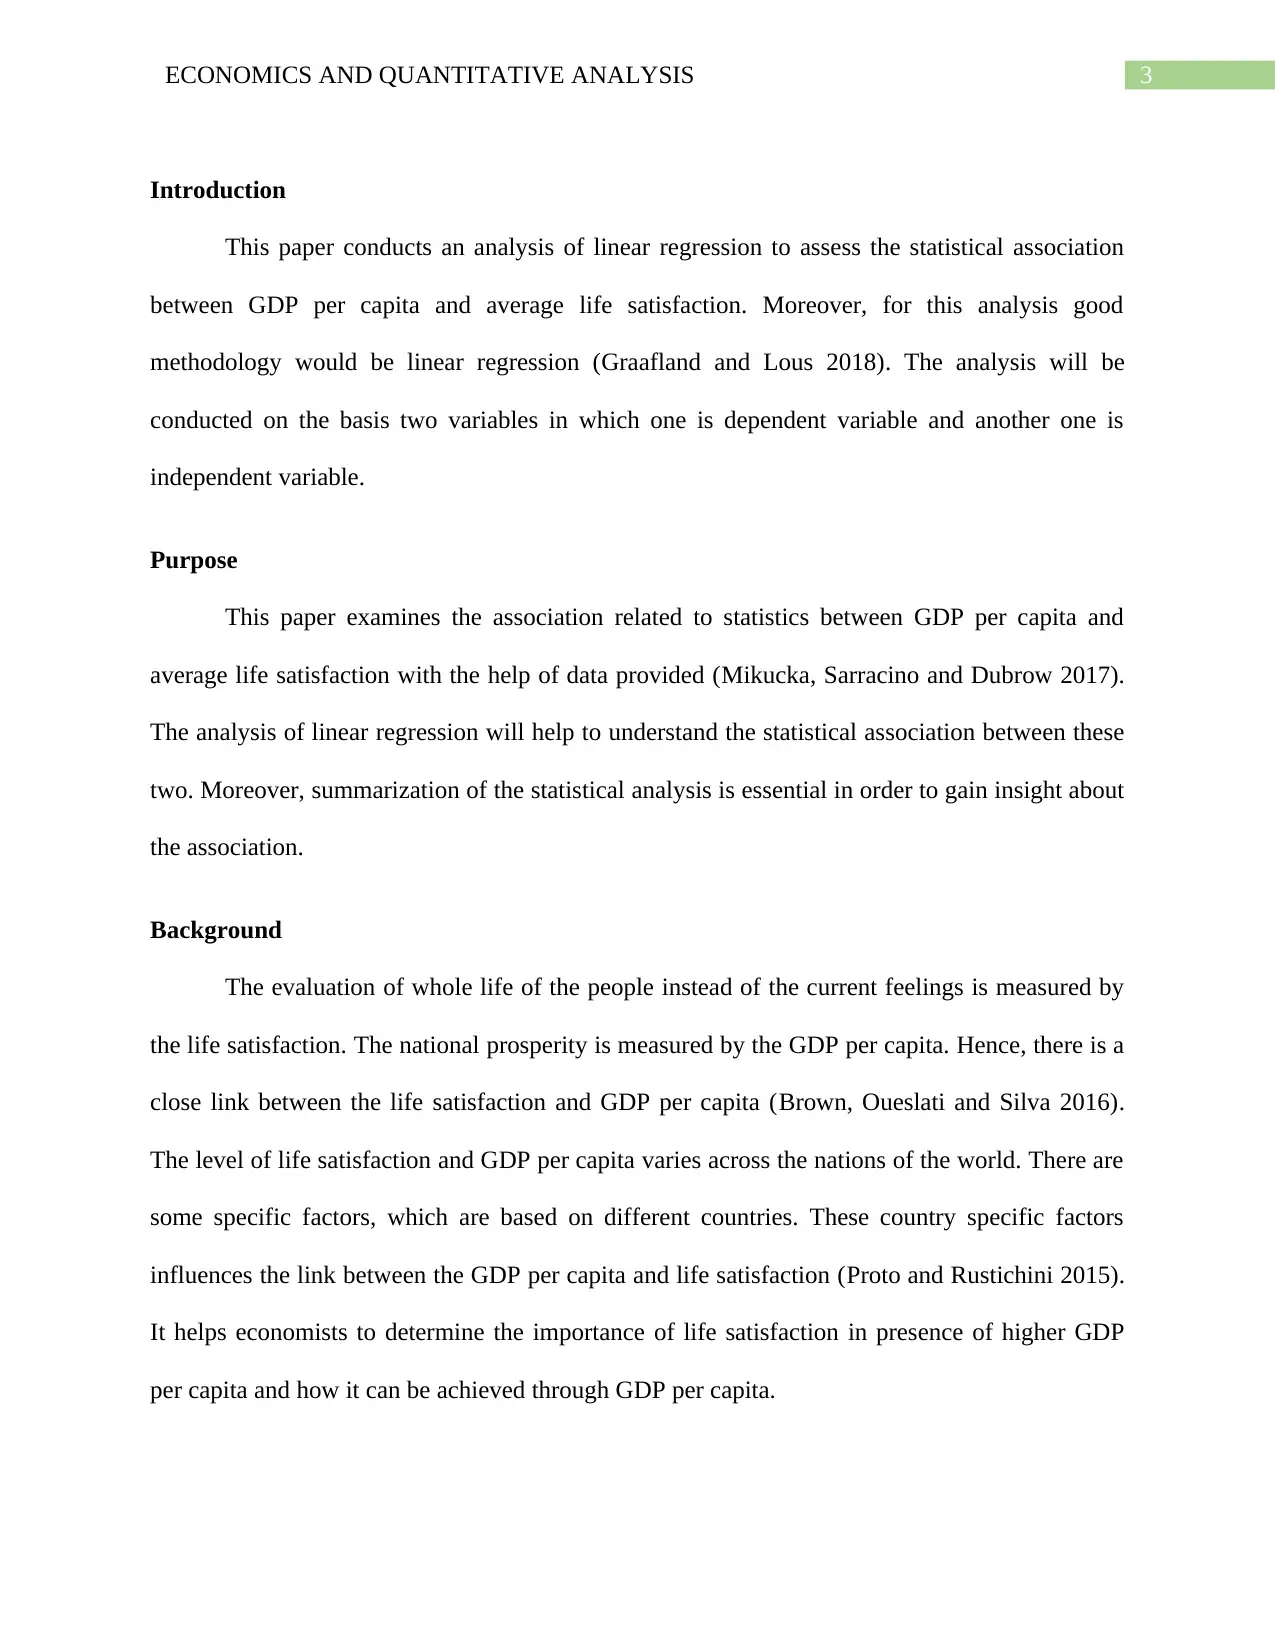
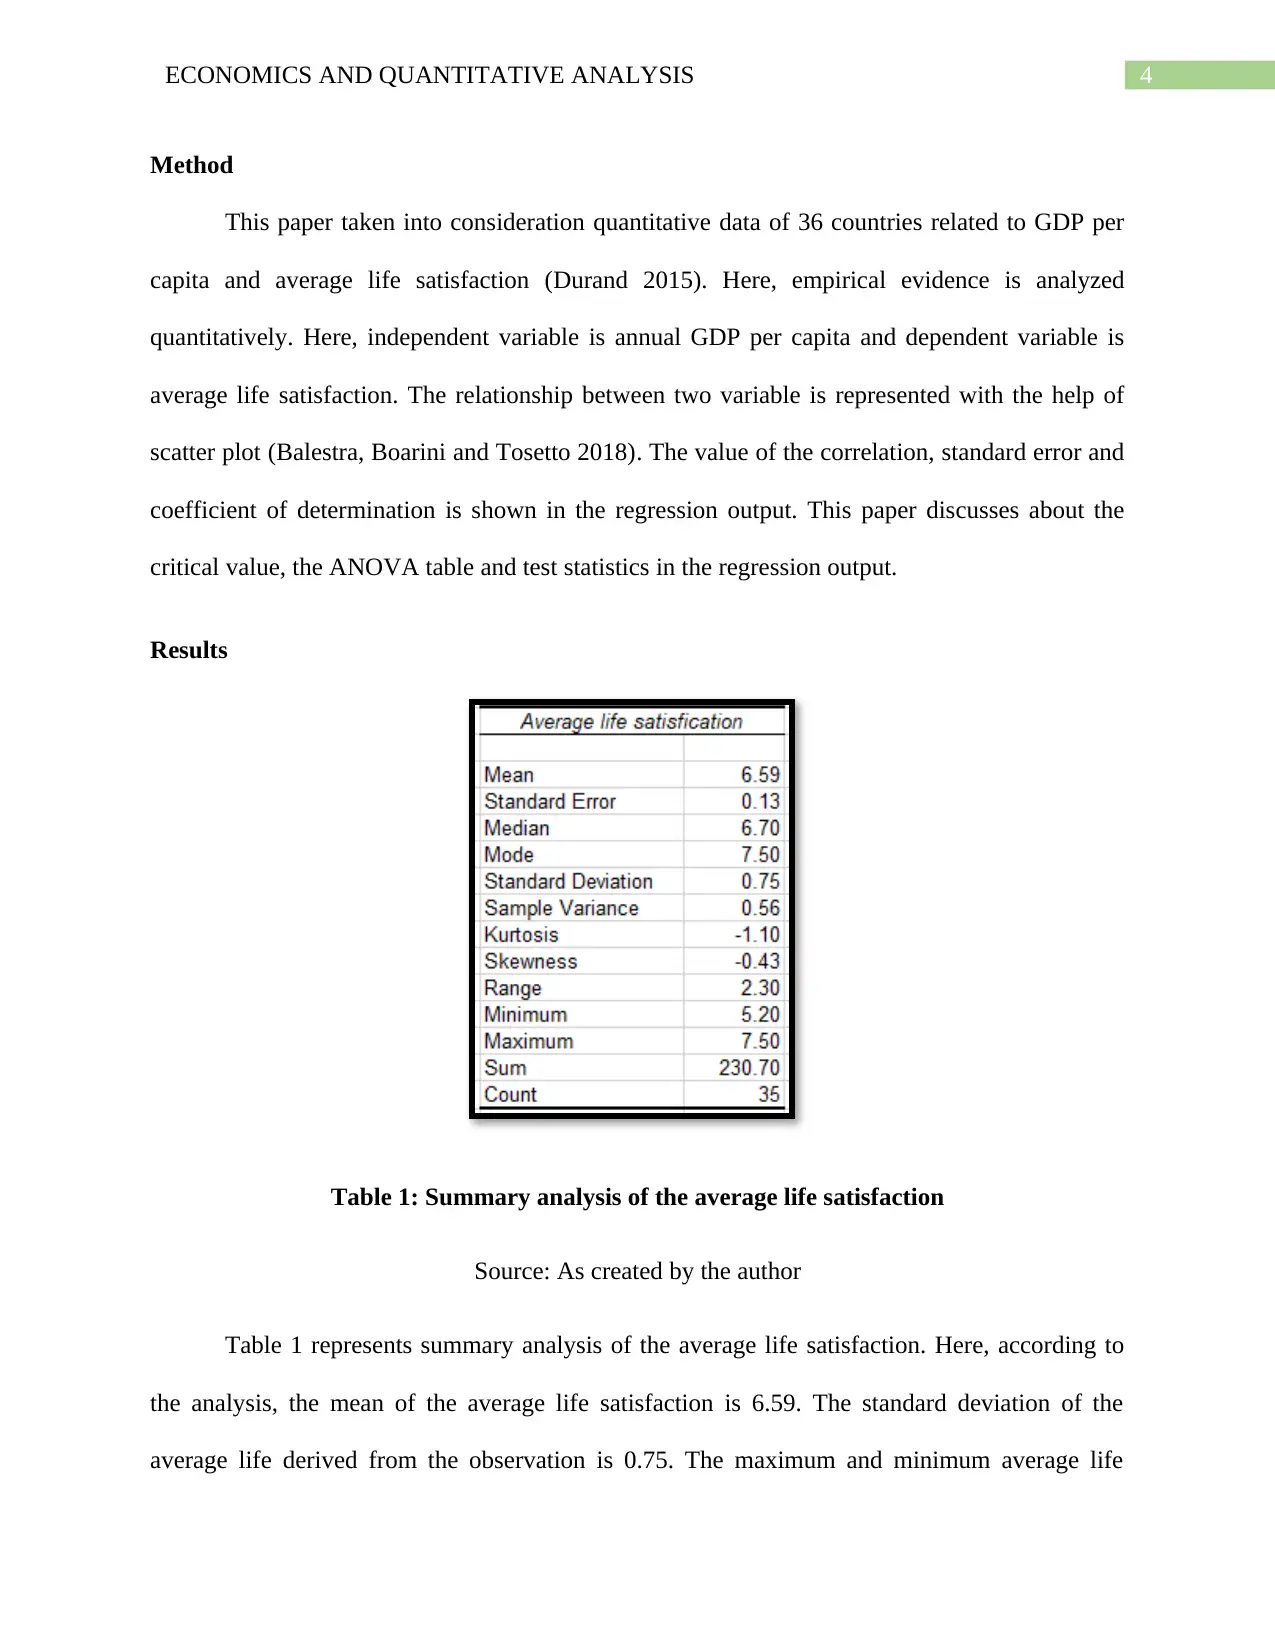
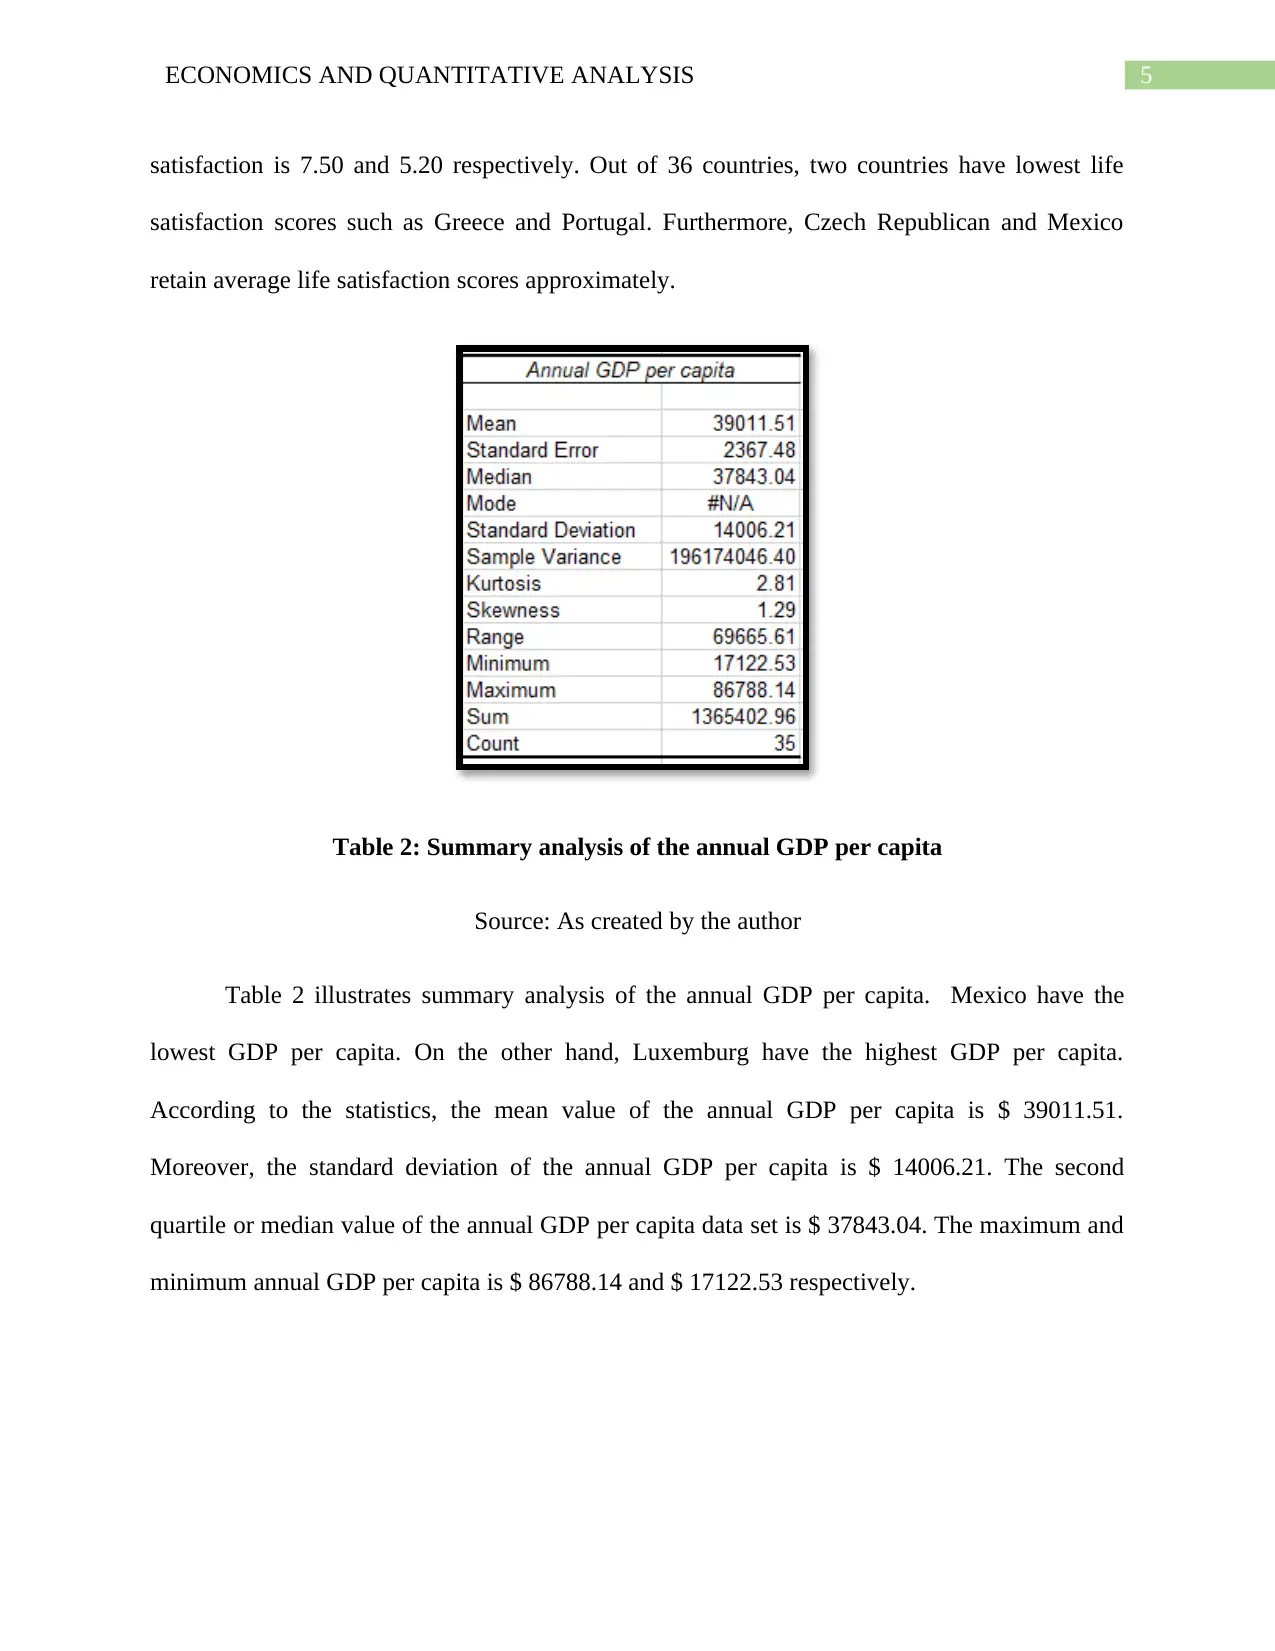
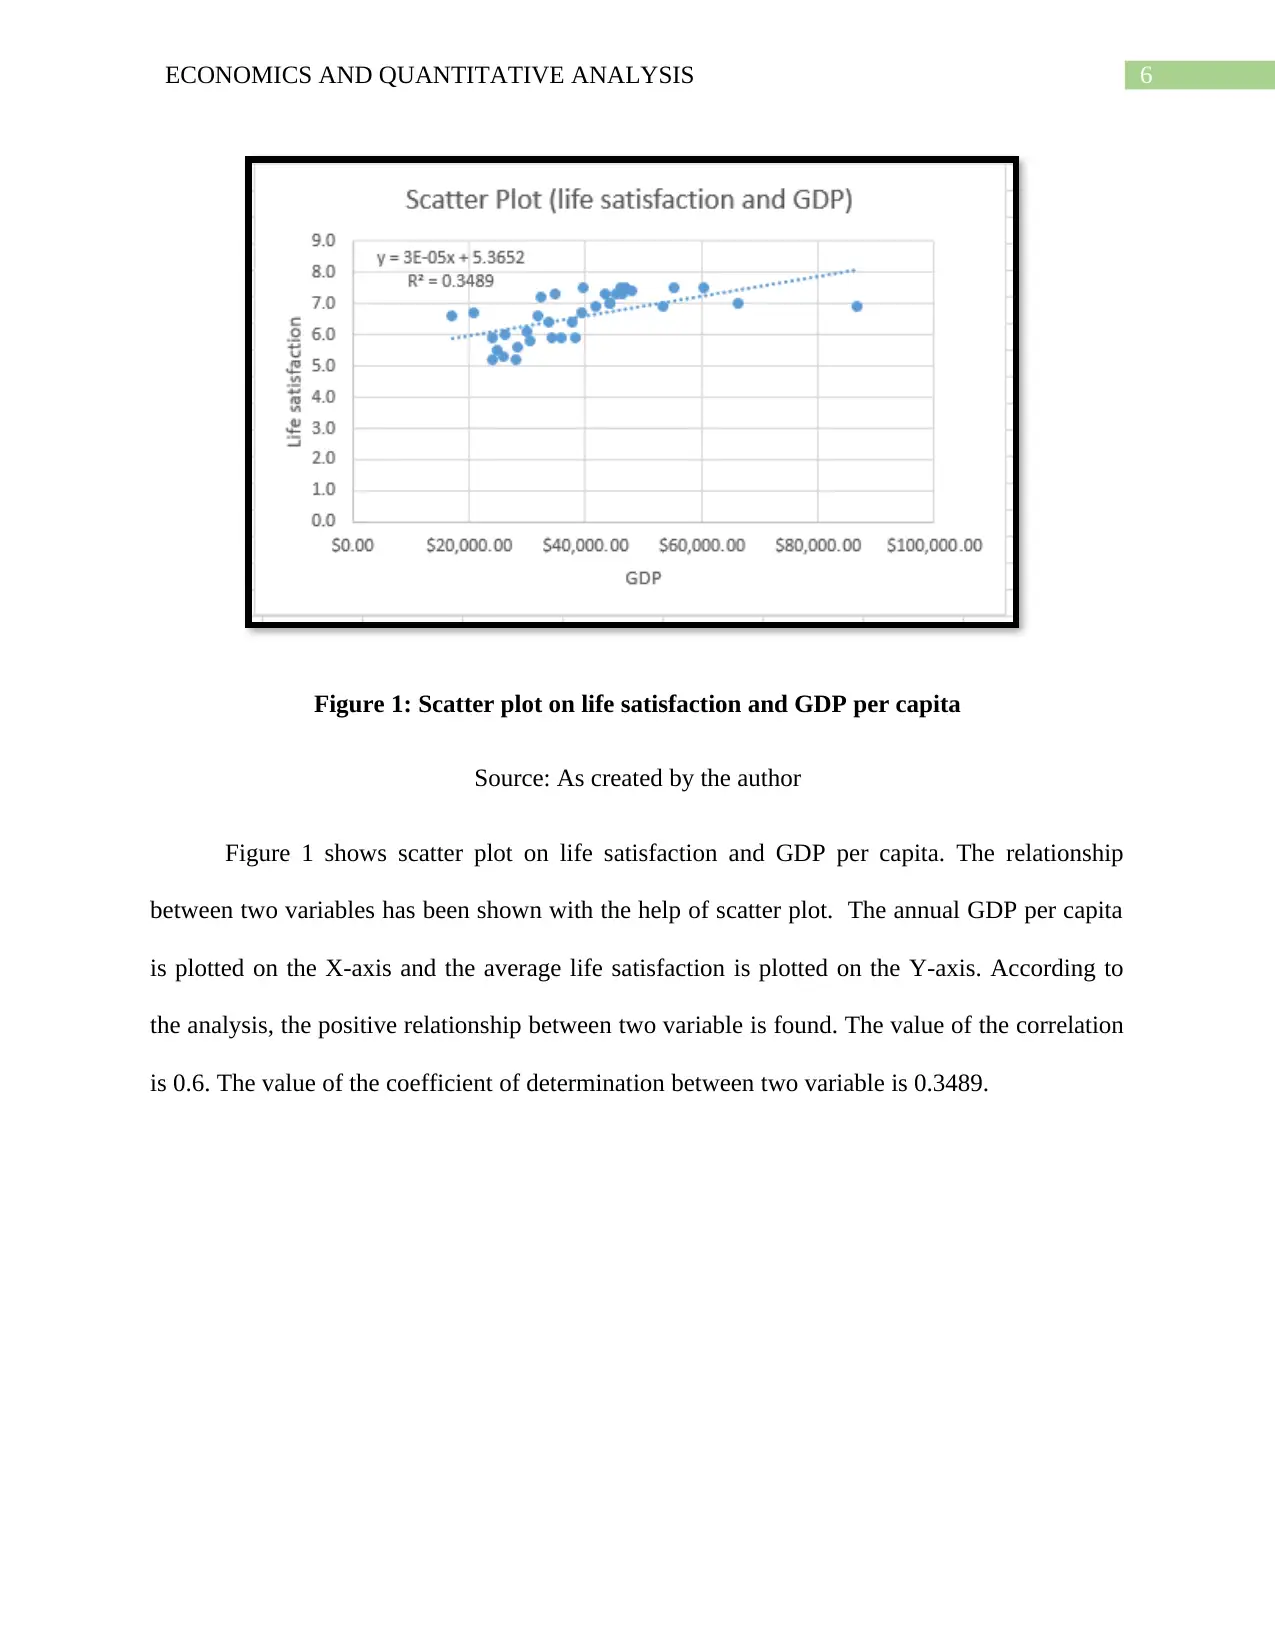
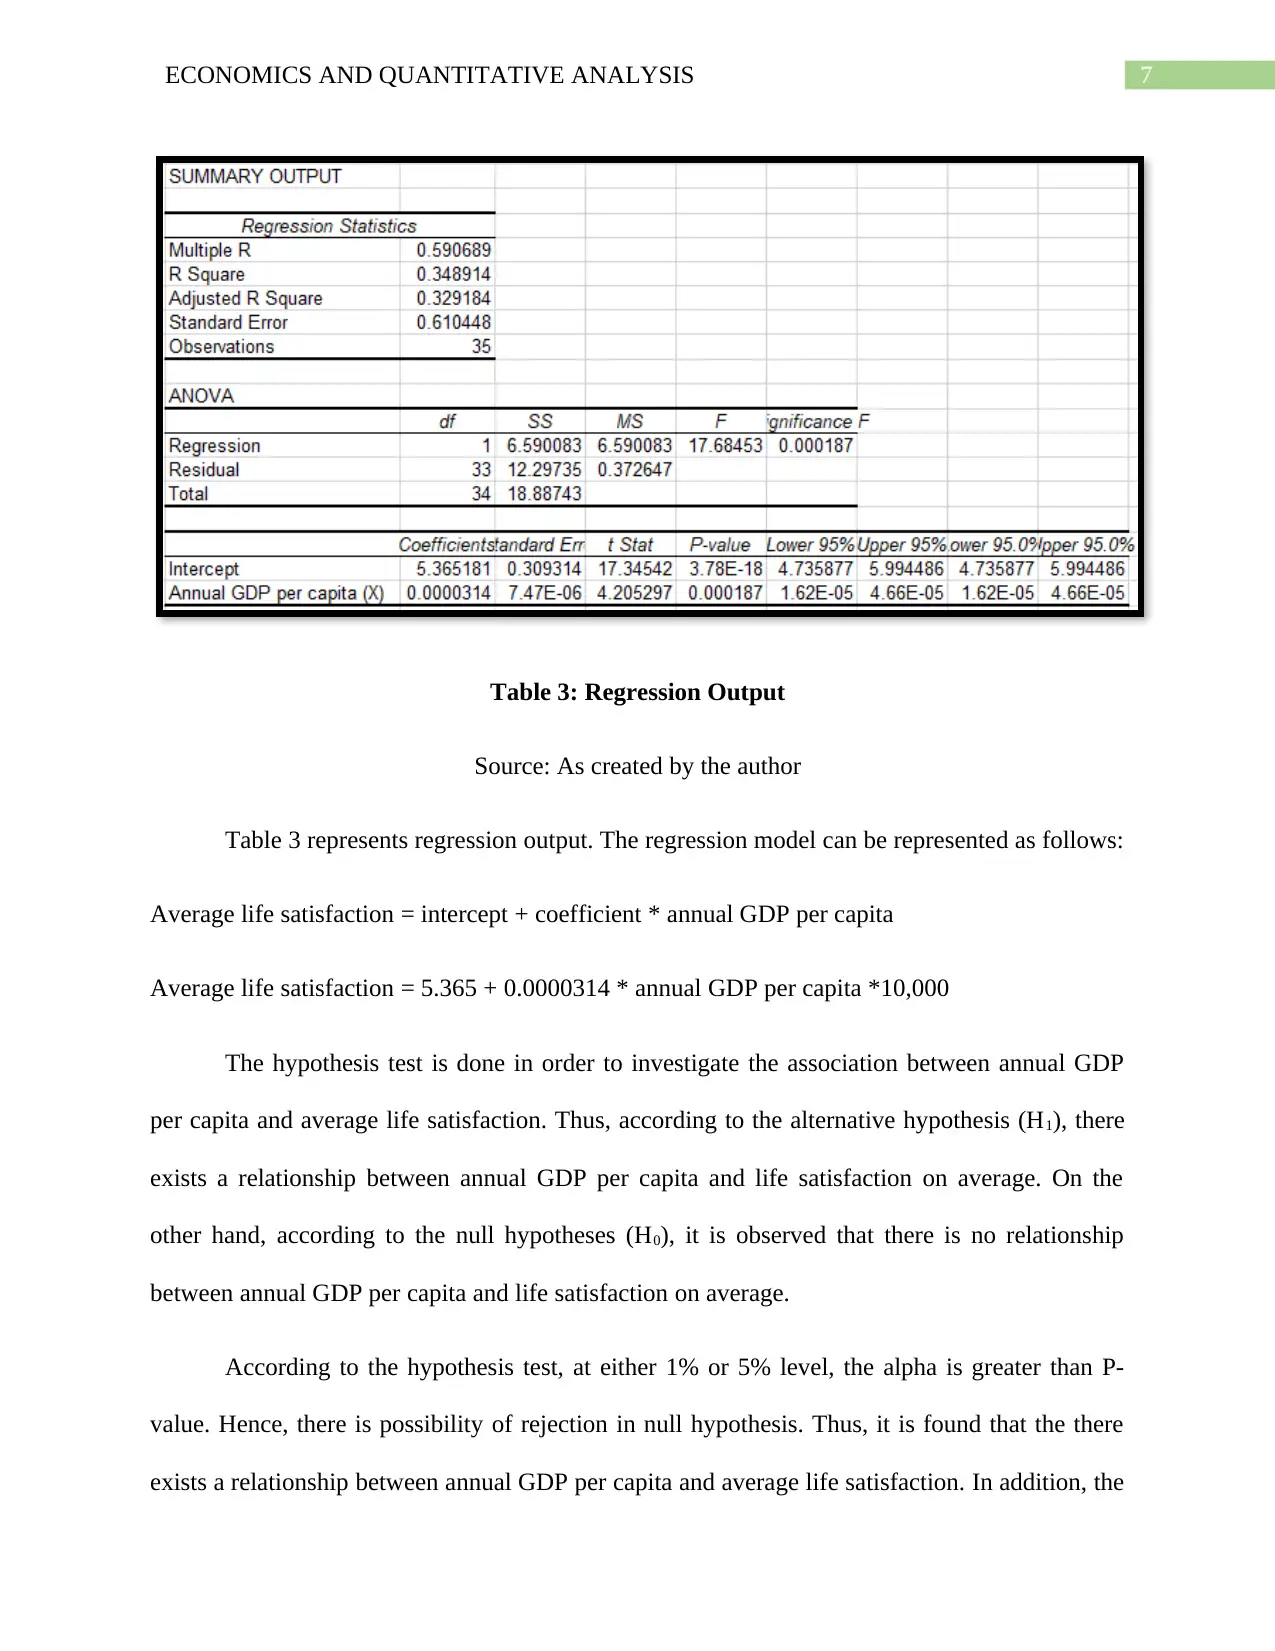
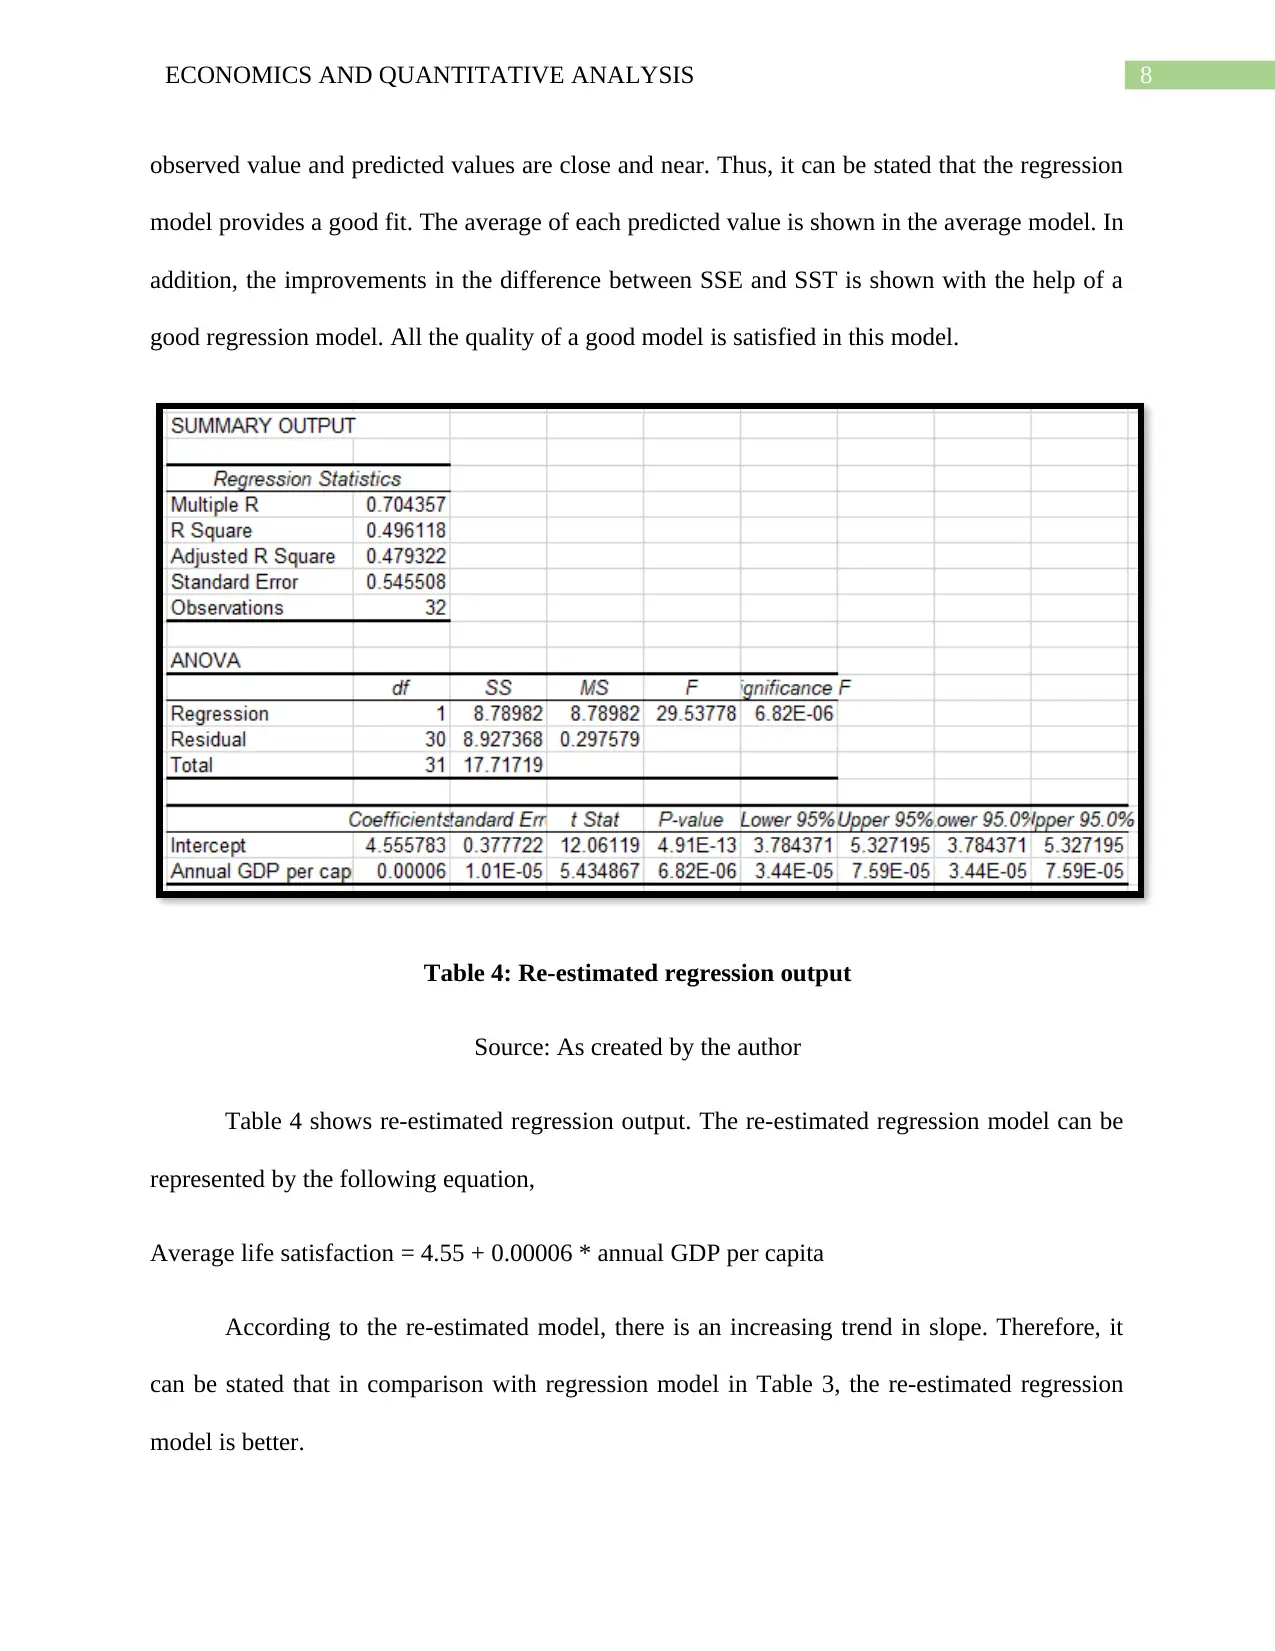
This report examines the statistical association between annual GDP per capita and average life satisfaction using linear regression analysis. The report begins with an executive summary, followed by an introduction that states the purpose of the study, which is to understand the relationship between the two variables. The background section provides a literature review on the link between life satisfaction and GDP. The methodology section details the quantitative data from 36 countries, employing linear regression to assess the relationship. The results section presents descriptive statistics (mean, standard deviation, minimum, and maximum) for both variables, along with a scatter plot and regression output, including hypothesis testing. A re-estimated regression output is also included. The discussion section highlights the strengths and weaknesses of the analysis, and the recommendation section suggests policy implications for countries with low life satisfaction scores. The report concludes with a summary of the findings and references. The analysis reveals a positive correlation between GDP per capita and life satisfaction across OECD countries, though other factors such as human capital are also important.
Document Page
Running head: ECONOMICS AND QUANTITATIVE ANALYSIS
Economics and Quantitative Analysis
Name of the Student
Name of the University
Author note
tabler-icon-diamond-filled.svg

Paraphrase This Document

Need a fresh take? Get an instant paraphrase of this document with our AI Paraphraser
Document Page
1ECONOMICS AND QUANTITATIVE ANALYSIS
EXECUTIVE SUMMARY
This paper intends to conduct an analysis of linear regression to examine the statistical
association between the annual GDP per capita and average life satisfaction. It helps to define the
relationship between two variables. This paper evaluates the descriptive statistics and inferential
statistics.
Document Page
2ECONOMICS AND QUANTITATIVE ANALYSIS
Table of Contents
Introduction......................................................................................................................................3
Purpose............................................................................................................................................3
Background......................................................................................................................................3
Method.............................................................................................................................................3
Results..............................................................................................................................................4
Discussion........................................................................................................................................9
Recommendation.............................................................................................................................9
Conclusion.......................................................................................................................................9
References and Bibliographies......................................................................................................10
Document Page
3ECONOMICS AND QUANTITATIVE ANALYSIS
Introduction
This paper conducts an analysis of linear regression to assess the statistical association
between GDP per capita and average life satisfaction. Moreover, for this analysis good
methodology would be linear regression (Graafland and Lous 2018). The analysis will be
conducted on the basis two variables in which one is dependent variable and another one is
independent variable.
Purpose
This paper examines the association related to statistics between GDP per capita and
average life satisfaction with the help of data provided (Mikucka, Sarracino and Dubrow 2017).
The analysis of linear regression will help to understand the statistical association between these
two. Moreover, summarization of the statistical analysis is essential in order to gain insight about
the association.
Background
The evaluation of whole life of the people instead of the current feelings is measured by
the life satisfaction. The national prosperity is measured by the GDP per capita. Hence, there is a
close link between the life satisfaction and GDP per capita (Brown, Oueslati and Silva 2016).
The level of life satisfaction and GDP per capita varies across the nations of the world. There are
some specific factors, which are based on different countries. These country specific factors
influences the link between the GDP per capita and life satisfaction (Proto and Rustichini 2015).
It helps economists to determine the importance of life satisfaction in presence of higher GDP
per capita and how it can be achieved through GDP per capita.
tabler-icon-diamond-filled.svg

Paraphrase This Document

Need a fresh take? Get an instant paraphrase of this document with our AI Paraphraser
Document Page
4ECONOMICS AND QUANTITATIVE ANALYSIS
Method
This paper taken into consideration quantitative data of 36 countries related to GDP per
capita and average life satisfaction (Durand 2015). Here, empirical evidence is analyzed
quantitatively. Here, independent variable is annual GDP per capita and dependent variable is
average life satisfaction. The relationship between two variable is represented with the help of
scatter plot (Balestra, Boarini and Tosetto 2018). The value of the correlation, standard error and
coefficient of determination is shown in the regression output. This paper discusses about the
critical value, the ANOVA table and test statistics in the regression output.
Results
Table 1: Summary analysis of the average life satisfaction
Source: As created by the author
Table 1 represents summary analysis of the average life satisfaction. Here, according to
the analysis, the mean of the average life satisfaction is 6.59. The standard deviation of the
average life derived from the observation is 0.75. The maximum and minimum average life
Document Page
5ECONOMICS AND QUANTITATIVE ANALYSIS
satisfaction is 7.50 and 5.20 respectively. Out of 36 countries, two countries have lowest life
satisfaction scores such as Greece and Portugal. Furthermore, Czech Republican and Mexico
retain average life satisfaction scores approximately.
Table 2: Summary analysis of the annual GDP per capita
Source: As created by the author
Table 2 illustrates summary analysis of the annual GDP per capita. Mexico have the
lowest GDP per capita. On the other hand, Luxemburg have the highest GDP per capita.
According to the statistics, the mean value of the annual GDP per capita is $ 39011.51.
Moreover, the standard deviation of the annual GDP per capita is $ 14006.21. The second
quartile or median value of the annual GDP per capita data set is $ 37843.04. The maximum and
minimum annual GDP per capita is $ 86788.14 and $ 17122.53 respectively.
Document Page
6ECONOMICS AND QUANTITATIVE ANALYSIS
Figure 1: Scatter plot on life satisfaction and GDP per capita
Source: As created by the author
Figure 1 shows scatter plot on life satisfaction and GDP per capita. The relationship
between two variables has been shown with the help of scatter plot. The annual GDP per capita
is plotted on the X-axis and the average life satisfaction is plotted on the Y-axis. According to
the analysis, the positive relationship between two variable is found. The value of the correlation
is 0.6. The value of the coefficient of determination between two variable is 0.3489.
tabler-icon-diamond-filled.svg

Paraphrase This Document

Need a fresh take? Get an instant paraphrase of this document with our AI Paraphraser
Document Page
7ECONOMICS AND QUANTITATIVE ANALYSIS
Table 3: Regression Output
Source: As created by the author
Table 3 represents regression output. The regression model can be represented as follows:
Average life satisfaction = intercept + coefficient * annual GDP per capita
Average life satisfaction = 5.365 + 0.0000314 * annual GDP per capita *10,000
The hypothesis test is done in order to investigate the association between annual GDP
per capita and average life satisfaction. Thus, according to the alternative hypothesis (H1), there
exists a relationship between annual GDP per capita and life satisfaction on average. On the
other hand, according to the null hypotheses (H0), it is observed that there is no relationship
between annual GDP per capita and life satisfaction on average.
According to the hypothesis test, at either 1% or 5% level, the alpha is greater than P-
value. Hence, there is possibility of rejection in null hypothesis. Thus, it is found that the there
exists a relationship between annual GDP per capita and average life satisfaction. In addition, the
Document Page
8ECONOMICS AND QUANTITATIVE ANALYSIS
observed value and predicted values are close and near. Thus, it can be stated that the regression
model provides a good fit. The average of each predicted value is shown in the average model. In
addition, the improvements in the difference between SSE and SST is shown with the help of a
good regression model. All the quality of a good model is satisfied in this model.
Table 4: Re-estimated regression output
Source: As created by the author
Table 4 shows re-estimated regression output. The re-estimated regression model can be
represented by the following equation,
Average life satisfaction = 4.55 + 0.00006 * annual GDP per capita
According to the re-estimated model, there is an increasing trend in slope. Therefore, it
can be stated that in comparison with regression model in Table 3, the re-estimated regression
model is better.
Document Page
9ECONOMICS AND QUANTITATIVE ANALYSIS
Discussion
The linear relationship between the variables can be represented by the analysis.
However, it failed to represent the non-linear relationship. The major strength of the regression
analysis are trend forecasting and forecasting an effect (Balestra, Boarini and Tosetto 2018).
According to the previous studies, there is no relationship between aggregate income and
happiness in time-series analysis. It is observed in case of some countries that GDP per capita is
not sufficient to achieve life satisfaction. Other factors such as human capital and structural
development are important. Hence, these factors should be taken into consideration to achieve
life satisfaction.
Recommendation
Greece recorded lowest life satisfaction scores among all OECD countries. Thus,
government should take necessary steps to boost the confidence of the vast population and
investors. Unemployment level should be reduced to revive the economic condition of the
country. Another important tool is to increase the public social expenditure. Despite, significant
growth in GDP per capita, there was no such improvements in the life satisfaction of the UK.
Thus, the country should focus on other factors of the economy to boost life satisfaction. One of
the essential factor that can influence the life satisfaction is environment (Orru et al. 2016).
Conclusion
The statistical association among all OECD countries resulted in positive relationship
between GDP per capita and life satisfaction according to the data set (Peiró-Palomino and
Picazo-Tadeo 2018). However, the linear regression analysis took only one dependent variable.
tabler-icon-diamond-filled.svg

Paraphrase This Document

Need a fresh take? Get an instant paraphrase of this document with our AI Paraphraser
Document Page
10ECONOMICS AND QUANTITATIVE ANALYSIS
References and Bibliographies
Balestra, C., Boarini, R. and Tosetto, E., 2018. What matters most to people? Evidence from the
OECD better life index users’ responses. Social Indicators Research, 136(3), pp.907-930.
Brown, Z.S., Oueslati, W. and Silva, J., 2016. Links between urban structure and life satisfaction
in a cross-section of OECD metro areas. Ecological economics, 129, pp.112-121.
Durand, M., 2015. The OECD better life initiative: How's life? and the measurement of well‐
being. Review of Income and Wealth, 61(1), pp.4-17.
Graafland, J. and Lous, B., 2018. Economic freedom, income inequality and life satisfaction in
OECD countries. Journal of Happiness Studies, 19(7), pp.2071-2093.
Mikucka, M., Sarracino, F. and Dubrow, J.K., 2017. When does economic growth improve life
satisfaction? Multilevel analysis of the roles of social trust and income inequality in 46 countries,
1981–2012. World Development, 93, pp.447-459.
Orru, K., Orru, H., Maasikmets, M., Hendrikson, R. and Ainsaar, M., 2016. Well-being and
environmental quality: Does pollution affect life satisfaction?. Quality of Life Research, 25(3),
pp.699-705.
Peiró-Palomino, J. and Picazo-Tadeo, A.J., 2018. OECD: One or many? Ranking countries with
a composite well-being indicator. Social Indicators Research, 139(3), pp.847-869.
Proto, E. and Rustichini, A., 2015. Life satisfaction, income and personality. Journal of
Economic Psychology, 48, pp.17-32.
chevron_up_icon
1 out of 11
circle_padding
hide_on_mobile
zoom_out_icon
[object Object]