Southern Cross University: Economics and Regression Analysis Report

Verified

Added on  2022/08/14

|8
|1649
|20
Report
AI Summary
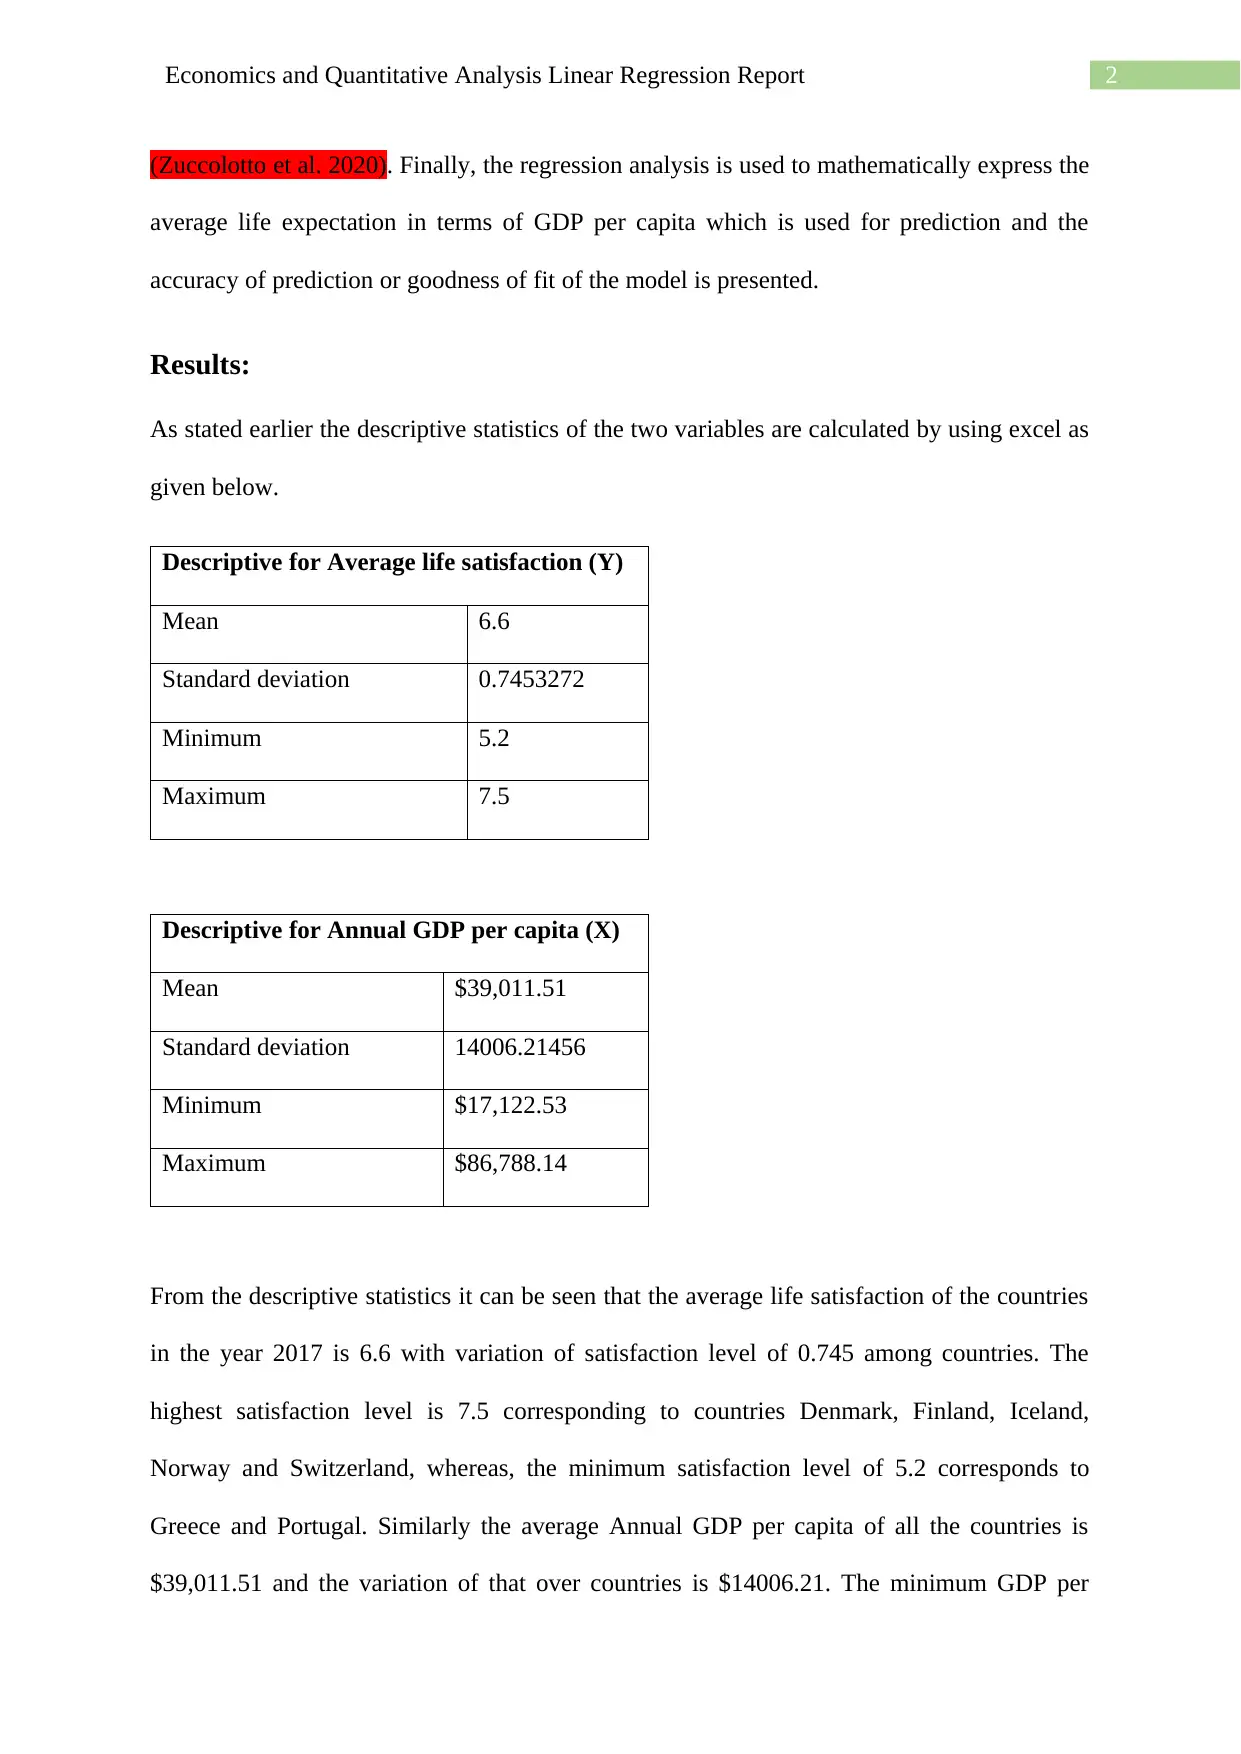
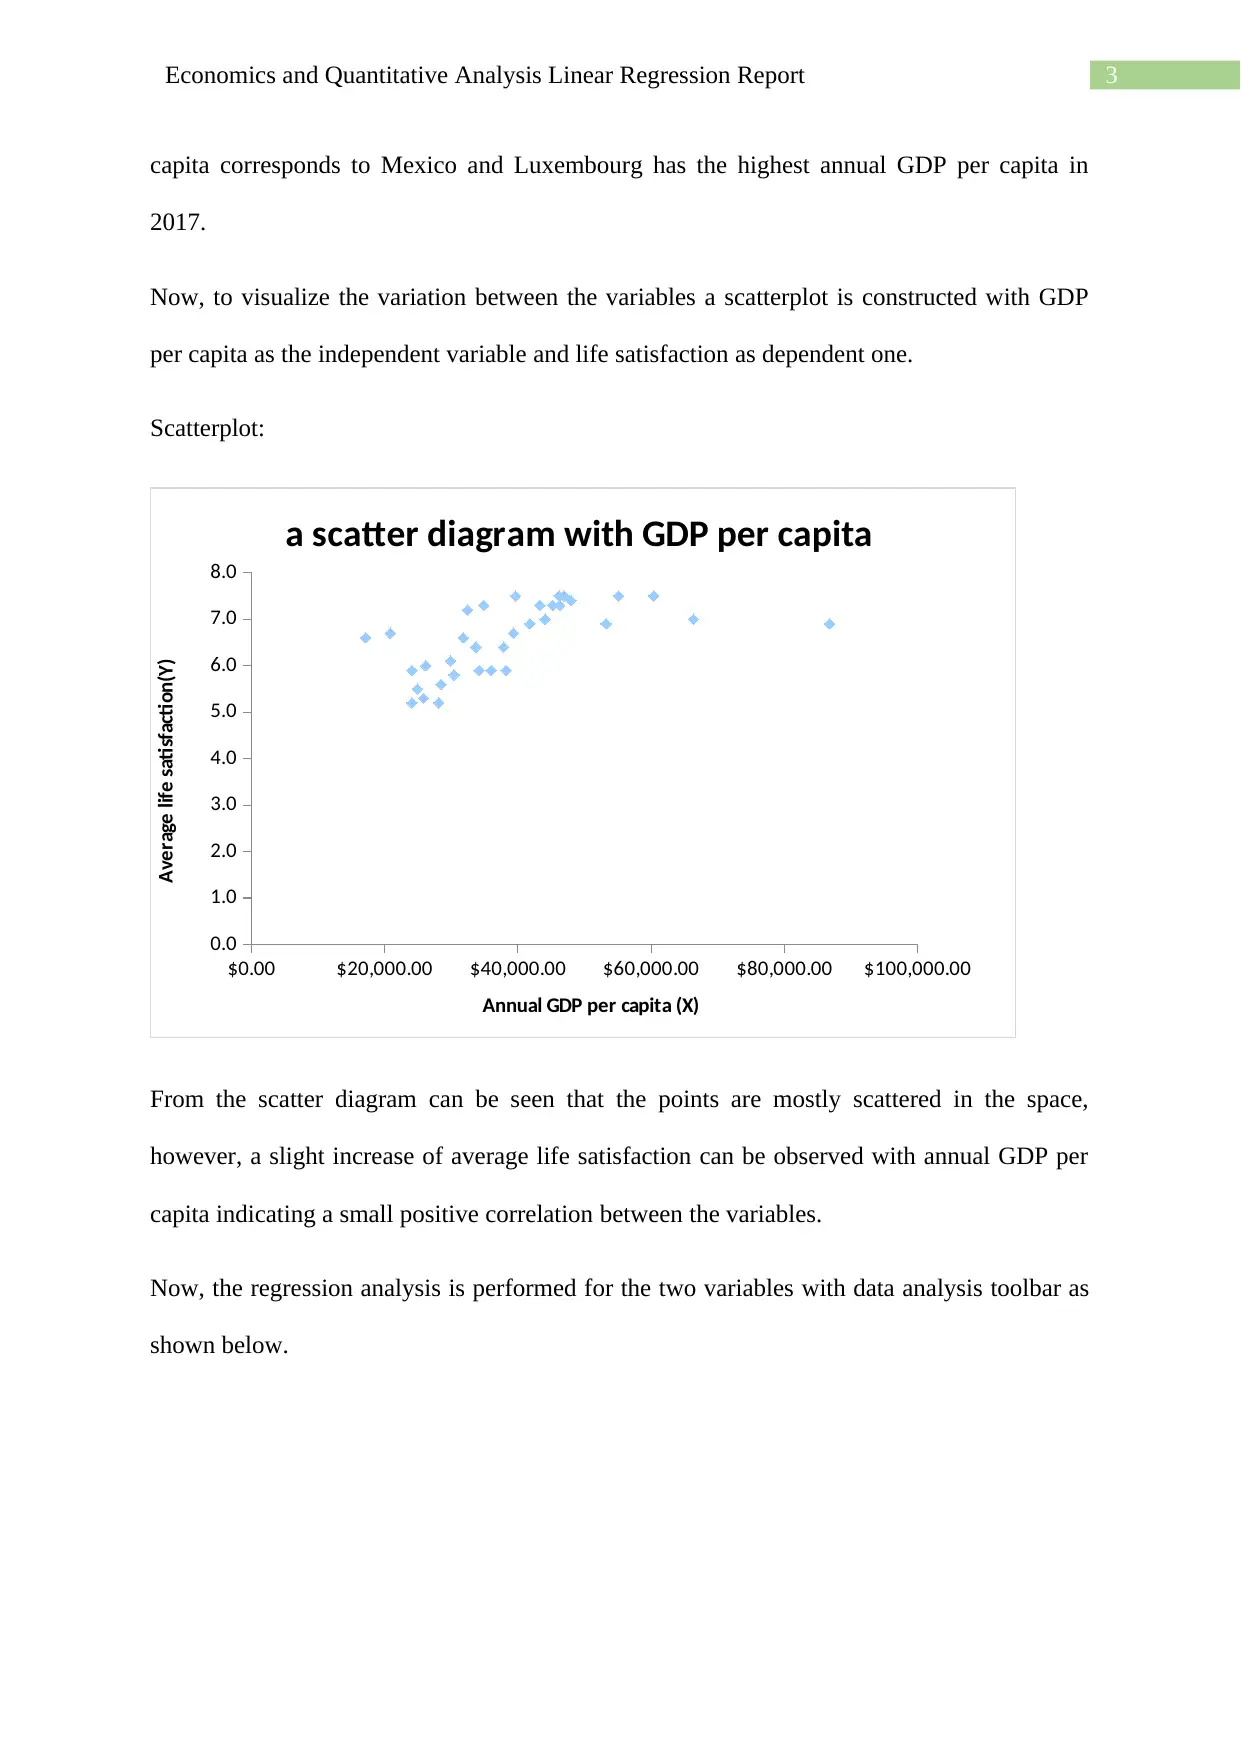
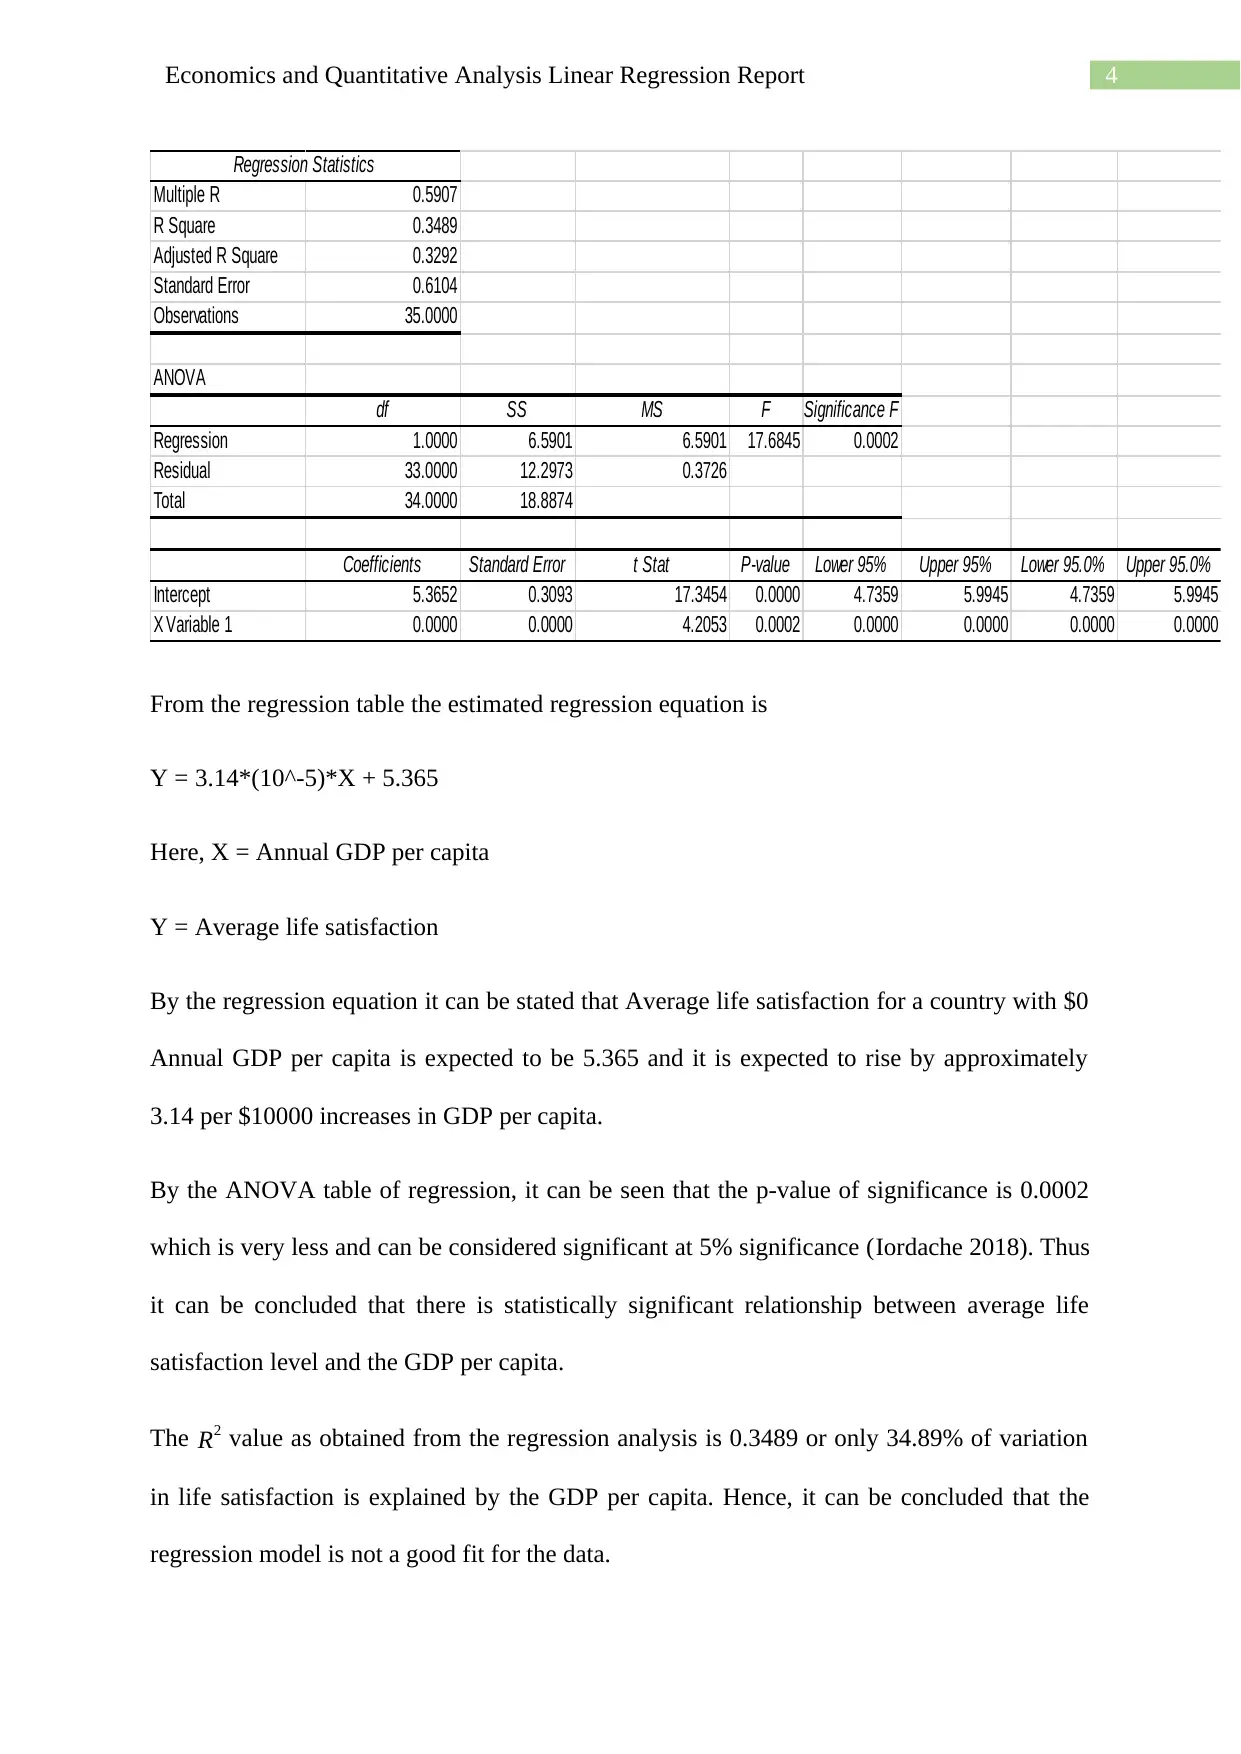
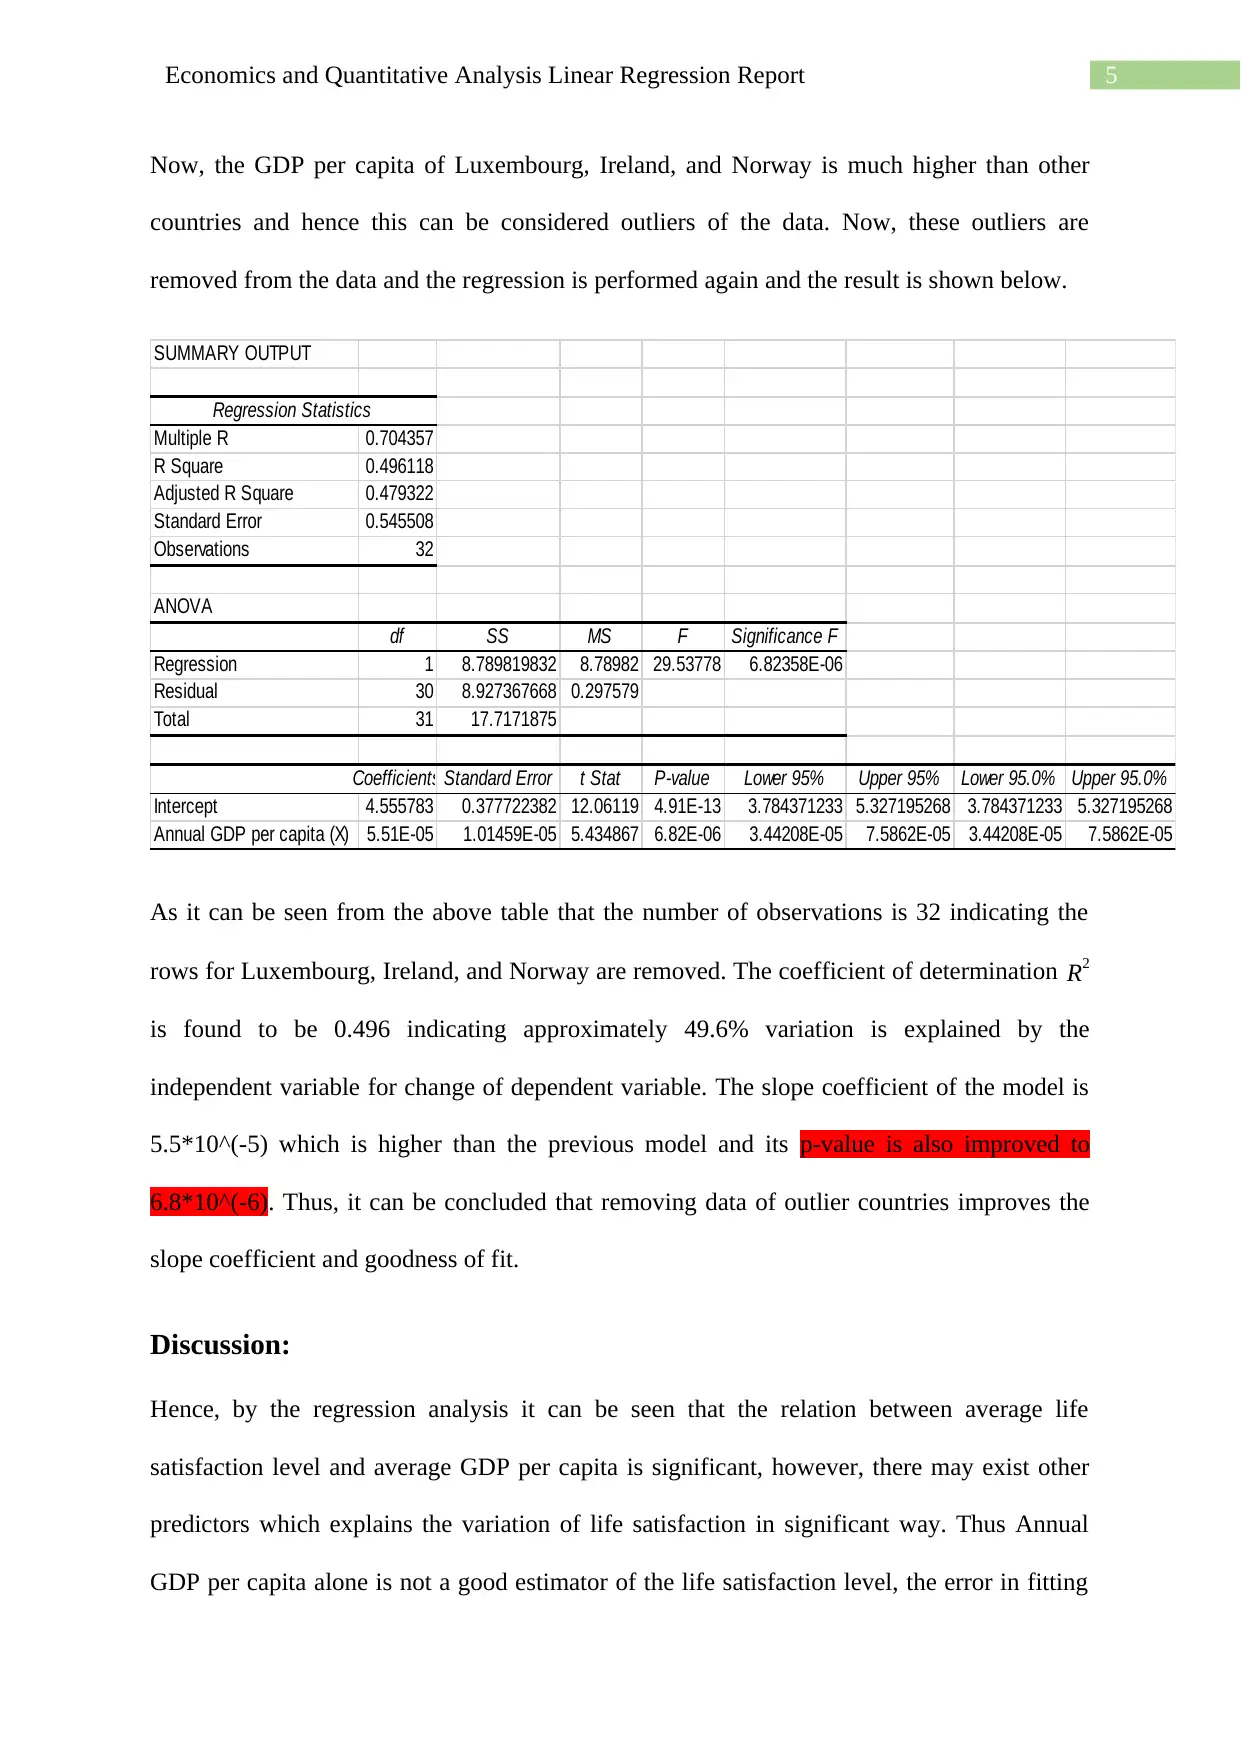
This report examines the statistical association between average life satisfaction and GDP per capita using linear regression analysis. The report begins with an introduction that clearly states the purpose of the study and provides background information on the significance of GDP and GDP per capita as economic indicators and their relationship to life satisfaction. The methodology section details the data source, which consists of data from the World Health Organization, and the statistical methods used, including descriptive statistics, visualization through scatterplots, and linear regression analysis. The results section presents descriptive statistics for both variables, including mean, standard deviation, minimum, and maximum values. It also presents a scatter plot visualizing the relationship between the variables and the results of the linear regression analysis. The report includes the regression equation, ANOVA table and p-value. Furthermore, the report considers the impact of outliers and presents regression results after removing outliers. The discussion section interprets the findings, discussing the significance of the relationship, limitations of the model, and potential predictors of life satisfaction. The report concludes with recommendations for future research and policy implications, suggesting that improving GDP per capita can significantly improve life satisfaction and recommending further research to identify other variables related to life satisfaction. Finally, the report suggests further research with more recent data and a larger sample size.
Document Page
Running head: Economics and Quantitative Analysis Linear Regression Report
Economics and Quantitative Analysis Linear Regression Report
Name of the Student
Name of the University
Author Note
tabler-icon-diamond-filled.svg

Paraphrase This Document

Need a fresh take? Get an instant paraphrase of this document with our AI Paraphraser
Document Page
1Economics and Quantitative Analysis Linear Regression Report
Purpose:
The report mainly aims to find the relationship between average life satisfaction and the GDP
per capita and conclude whether the relationship is significant. Linear regression analysis
which is also known as least square method is used to predict the average life satisfaction in
terms of GDP per capita and the relevance of the regression model is analyzed.
Background:
GDP stands for gross domestic product which signifies the total monetary value of all the
finished goods and services in a country within a specific period of time which is typically
one year. Thus GDP is an indicator of the size of economy of the country and change in GDP
in a year indicate the positive or negative growth of economy. Now, GDP per capita is the
monetary value allocated to each person in country on an average (Zhou and Xie 2016). Thus
higher GDP per capita indicates people in the country are in a financial good position. Now,
as financial situation of a person or family is related to their well beings, hence, it is expected
that people with good financial situation or a country with large GDP per capita have higher
average life satisfaction as per the economists.
Method:
The entire data of average GDP per capita and average life satisfaction index for 35 countries
is collected from the world health organization report in the 2017. The dataset has no missing
instances and hence the effective sample size for regression analysis is 35. Now, before
finding the association between variables the useful descriptive measures of the variables like
the average, standard deviation, minimum and maximum are produced to provide an
overview of the data. Then suitable visualizations are produced to understand the change of
the average life expectation with respect to average annual GDP per capita in the year 2017
Document Page
2Economics and Quantitative Analysis Linear Regression Report
(Zuccolotto et al. 2020). Finally, the regression analysis is used to mathematically express the
average life expectation in terms of GDP per capita which is used for prediction and the
accuracy of prediction or goodness of fit of the model is presented.
Results:
As stated earlier the descriptive statistics of the two variables are calculated by using excel as
given below.
Descriptive for Average life satisfaction (Y)
Mean 6.6
Standard deviation 0.7453272
Minimum 5.2
Maximum 7.5
Descriptive for Annual GDP per capita (X)
Mean $39,011.51
Standard deviation 14006.21456
Minimum $17,122.53
Maximum $86,788.14
From the descriptive statistics it can be seen that the average life satisfaction of the countries
in the year 2017 is 6.6 with variation of satisfaction level of 0.745 among countries. The
highest satisfaction level is 7.5 corresponding to countries Denmark, Finland, Iceland,
Norway and Switzerland, whereas, the minimum satisfaction level of 5.2 corresponds to
Greece and Portugal. Similarly the average Annual GDP per capita of all the countries is
$39,011.51 and the variation of that over countries is $14006.21. The minimum GDP per
Document Page
3Economics and Quantitative Analysis Linear Regression Report
capita corresponds to Mexico and Luxembourg has the highest annual GDP per capita in
2017.
Now, to visualize the variation between the variables a scatterplot is constructed with GDP
per capita as the independent variable and life satisfaction as dependent one.
Scatterplot:
$0.00 $20,000.00 $40,000.00 $60,000.00 $80,000.00 $100,000.00
0.0
1.0
2.0
3.0
4.0
5.0
6.0
7.0
8.0
a scatter diagram with GDP per capita
Annual GDP per capita (X)
Average life satisfaction(Y)
From the scatter diagram can be seen that the points are mostly scattered in the space,
however, a slight increase of average life satisfaction can be observed with annual GDP per
capita indicating a small positive correlation between the variables.
Now, the regression analysis is performed for the two variables with data analysis toolbar as
shown below.
tabler-icon-diamond-filled.svg

Paraphrase This Document

Need a fresh take? Get an instant paraphrase of this document with our AI Paraphraser
Document Page
4Economics and Quantitative Analysis Linear Regression Report
Regression Statistics
Multiple R 0.5907
R Square 0.3489
Adjusted R Square 0.3292
Standard Error 0.6104
Observations 35.0000
ANOVA
df SS MS F Significance F
Regression 1.0000 6.5901 6.5901 17.6845 0.0002
Residual 33.0000 12.2973 0.3726
Total 34.0000 18.8874
Coefficients Standard Error t Stat P-value Lower 95% Upper 95% Lower 95.0% Upper 95.0%
Intercept 5.3652 0.3093 17.3454 0.0000 4.7359 5.9945 4.7359 5.9945
X Variable 1 0.0000 0.0000 4.2053 0.0002 0.0000 0.0000 0.0000 0.0000
From the regression table the estimated regression equation is
Y = 3.14*(10^-5)*X + 5.365
Here, X = Annual GDP per capita
Y = Average life satisfaction
By the regression equation it can be stated that Average life satisfaction for a country with $0
Annual GDP per capita is expected to be 5.365 and it is expected to rise by approximately
3.14 per $10000 increases in GDP per capita.
By the ANOVA table of regression, it can be seen that the p-value of significance is 0.0002
which is very less and can be considered significant at 5% significance (Iordache 2018). Thus
it can be concluded that there is statistically significant relationship between average life
satisfaction level and the GDP per capita.
The R2 value as obtained from the regression analysis is 0.3489 or only 34.89% of variation
in life satisfaction is explained by the GDP per capita. Hence, it can be concluded that the
regression model is not a good fit for the data.
Document Page
5Economics and Quantitative Analysis Linear Regression Report
Now, the GDP per capita of Luxembourg, Ireland, and Norway is much higher than other
countries and hence this can be considered outliers of the data. Now, these outliers are
removed from the data and the regression is performed again and the result is shown below.
SUMMARY OUTPUT
Regression Statistics
Multiple R 0.704357
R Square 0.496118
Adjusted R Square 0.479322
Standard Error 0.545508
Observations 32
ANOVA
df SS MS F Significance F
Regression 1 8.789819832 8.78982 29.53778 6.82358E-06
Residual 30 8.927367668 0.297579
Total 31 17.7171875
Coefficients Standard Error t Stat P-value Lower 95% Upper 95% Lower 95.0% Upper 95.0%
Intercept 4.555783 0.377722382 12.06119 4.91E-13 3.784371233 5.327195268 3.784371233 5.327195268
Annual GDP per capita (X) 5.51E-05 1.01459E-05 5.434867 6.82E-06 3.44208E-05 7.5862E-05 3.44208E-05 7.5862E-05
As it can be seen from the above table that the number of observations is 32 indicating the
rows for Luxembourg, Ireland, and Norway are removed. The coefficient of determination R2
is found to be 0.496 indicating approximately 49.6% variation is explained by the
independent variable for change of dependent variable. The slope coefficient of the model is
5.5*10^(-5) which is higher than the previous model and its p-value is also improved to
6.8*10^(-6). Thus, it can be concluded that removing data of outlier countries improves the
slope coefficient and goodness of fit.
Discussion:
Hence, by the regression analysis it can be seen that the relation between average life
satisfaction level and average GDP per capita is significant, however, there may exist other
predictors which explains the variation of life satisfaction in significant way. Thus Annual
GDP per capita alone is not a good estimator of the life satisfaction level, the error in fitting
Document Page
6Economics and Quantitative Analysis Linear Regression Report
may exist because of other type of significant prediction model with different predictors or
for greater random error as indicated in several other research studies by different authors.
Also, as the fitted regression model has a small R2 value it is not advised to predict life
satisfaction in terms of known GDP per capita with the model, but a trend or range of life
satisfaction can be obtained with model (Bar-Gera 2017). The model is formed by using only
data of 35 countries which is low and thus this model can give significant sampling error if
used for predicting average life satisfies of countries with GDP per capita outside the
sampling range of GDP per capita.
Recommendations:
The findings of this research suggest that life satisfaction can be significantly improved by
improving the GDP per capita of countries and the economic conditions. Thus it is
recommended to form policies by the government to improve overall economy of countries
by providing assistance to poorer sections more than the rich people to increase overall
happiness of people in the country. This is because several researches show that the poor
section is wider than the rich section in the world and thus providing assistance to poor
section will contribute more towards improvement of life satisfaction. Further the analysis
revealed that there may exist other significant predictors like IQ level and/or literacy for
average life satisfaction as most of the percentage of it is unexplained by the predictor (dos
Santos 2019). Thus it is recommended to research further to find other variables related to life
satisfaction and do the analysis again for obtaining better results. Lastly, the data is collected
for 35 countries in the world in the year 2017 and hence recent variation of GDP per capita
and life satisfaction maybe different and there exist large sampling error. Thus it is also
recommended to conduct research with large or all countries’ data in the recent year that can
provide better overview and explanation of the life satisfaction with new model.
tabler-icon-diamond-filled.svg

Paraphrase This Document

Need a fresh take? Get an instant paraphrase of this document with our AI Paraphraser
Document Page
7Economics and Quantitative Analysis Linear Regression Report
References:
Bar-Gera, H., 2017. The target parameter of adjusted R-squared in fixed-design
experiments. The American Statistician, 71(2), pp.112-119.
Iordache, A.M.M., 2018. TAKING DECISION BASED ON THE REGRESSION MODEL
USING EXCEL 2016. Journal of Information Systems & Operations Management, pp.391-
399.
dos Santos, P.I.V., de Carvalho, C.M.S., Parreira, J.Í.L., dos Santos Costa, P.J. and Parreira,
P.M.D., 2019, April. Emotional Intelligence and Life Satisfaction in Adulthood.
In Gerontechnology: First International Workshop, IWoG 2018, Cáceres, Spain, and Évora,
Portugal, 14 and 17 December, 2018, Revised Selected Papers (Vol. 1016, p. 201). Springer.
Zuccolotto, P., Manisera, M., Sandri, M. and Messina, E., 2020. Data and Basic Statistical
Analyses. In Basketball Data Science (pp. 17-54). Chapman and Hall/CRC.
Zhou, J. and Xie, Y., 2016. Does economic development affect life satisfaction? A spatial–
temporal contextual analysis in China. Journal of Happiness Studies, 17(2), pp.643-658.
chevron_up_icon
1 out of 8
circle_padding
hide_on_mobile
zoom_out_icon
[object Object]