Economic and Quantitative Analysis: Life Satisfaction and GDP Report

Verified

Added on  2022/08/12

|10
|1481
|18
Report
AI Summary
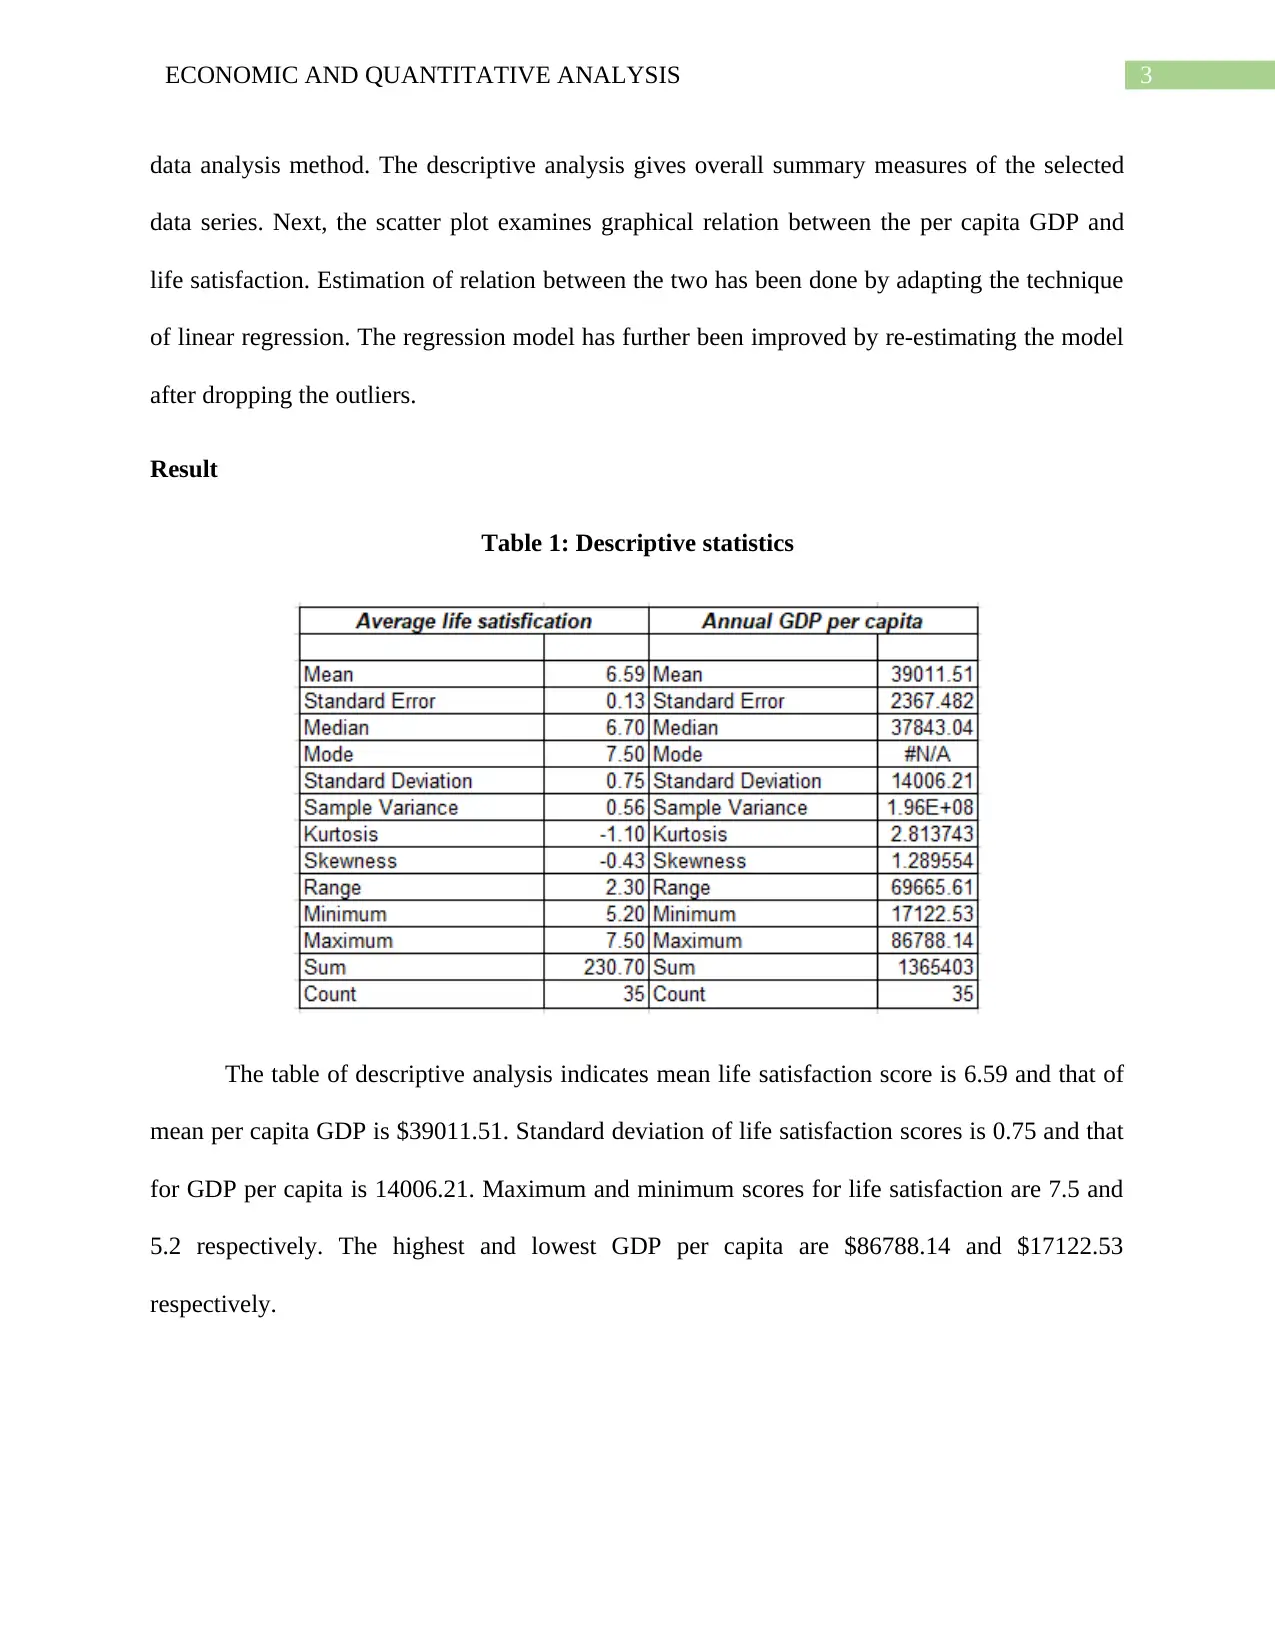
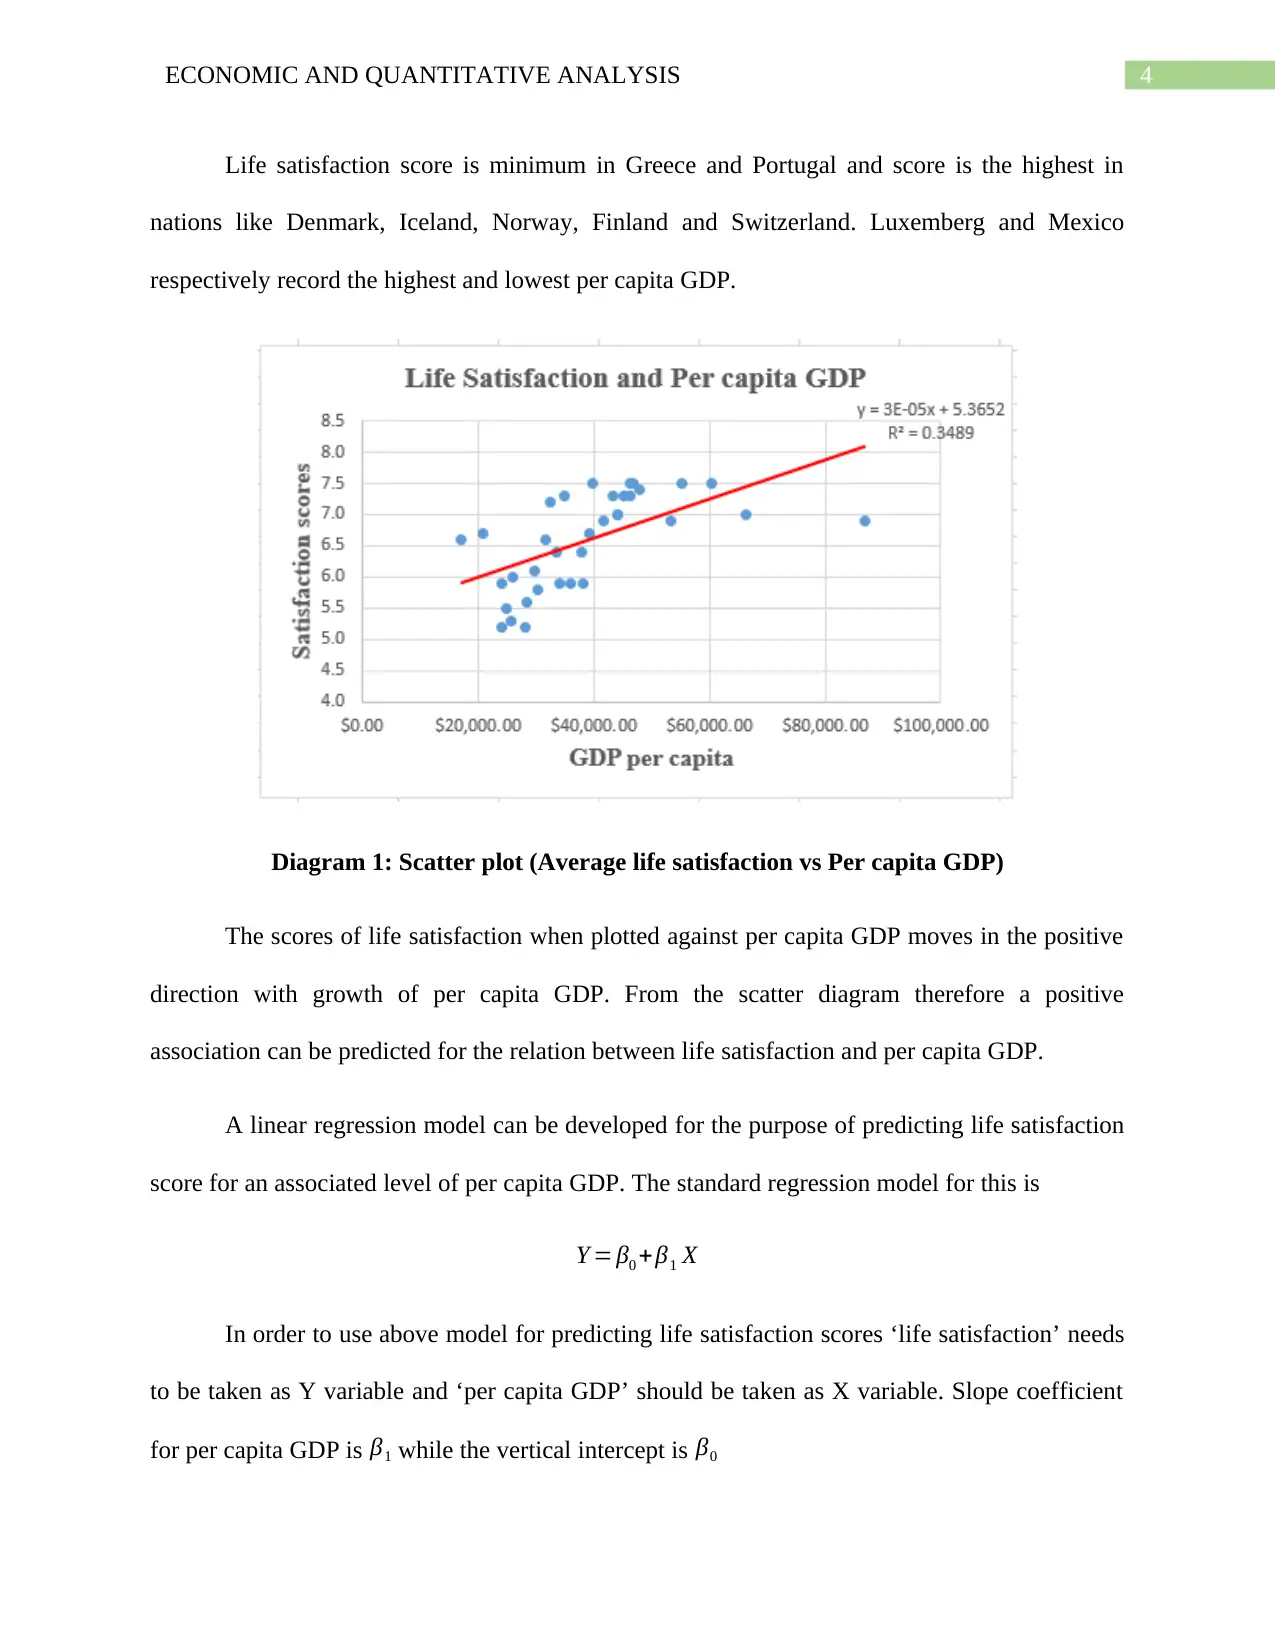
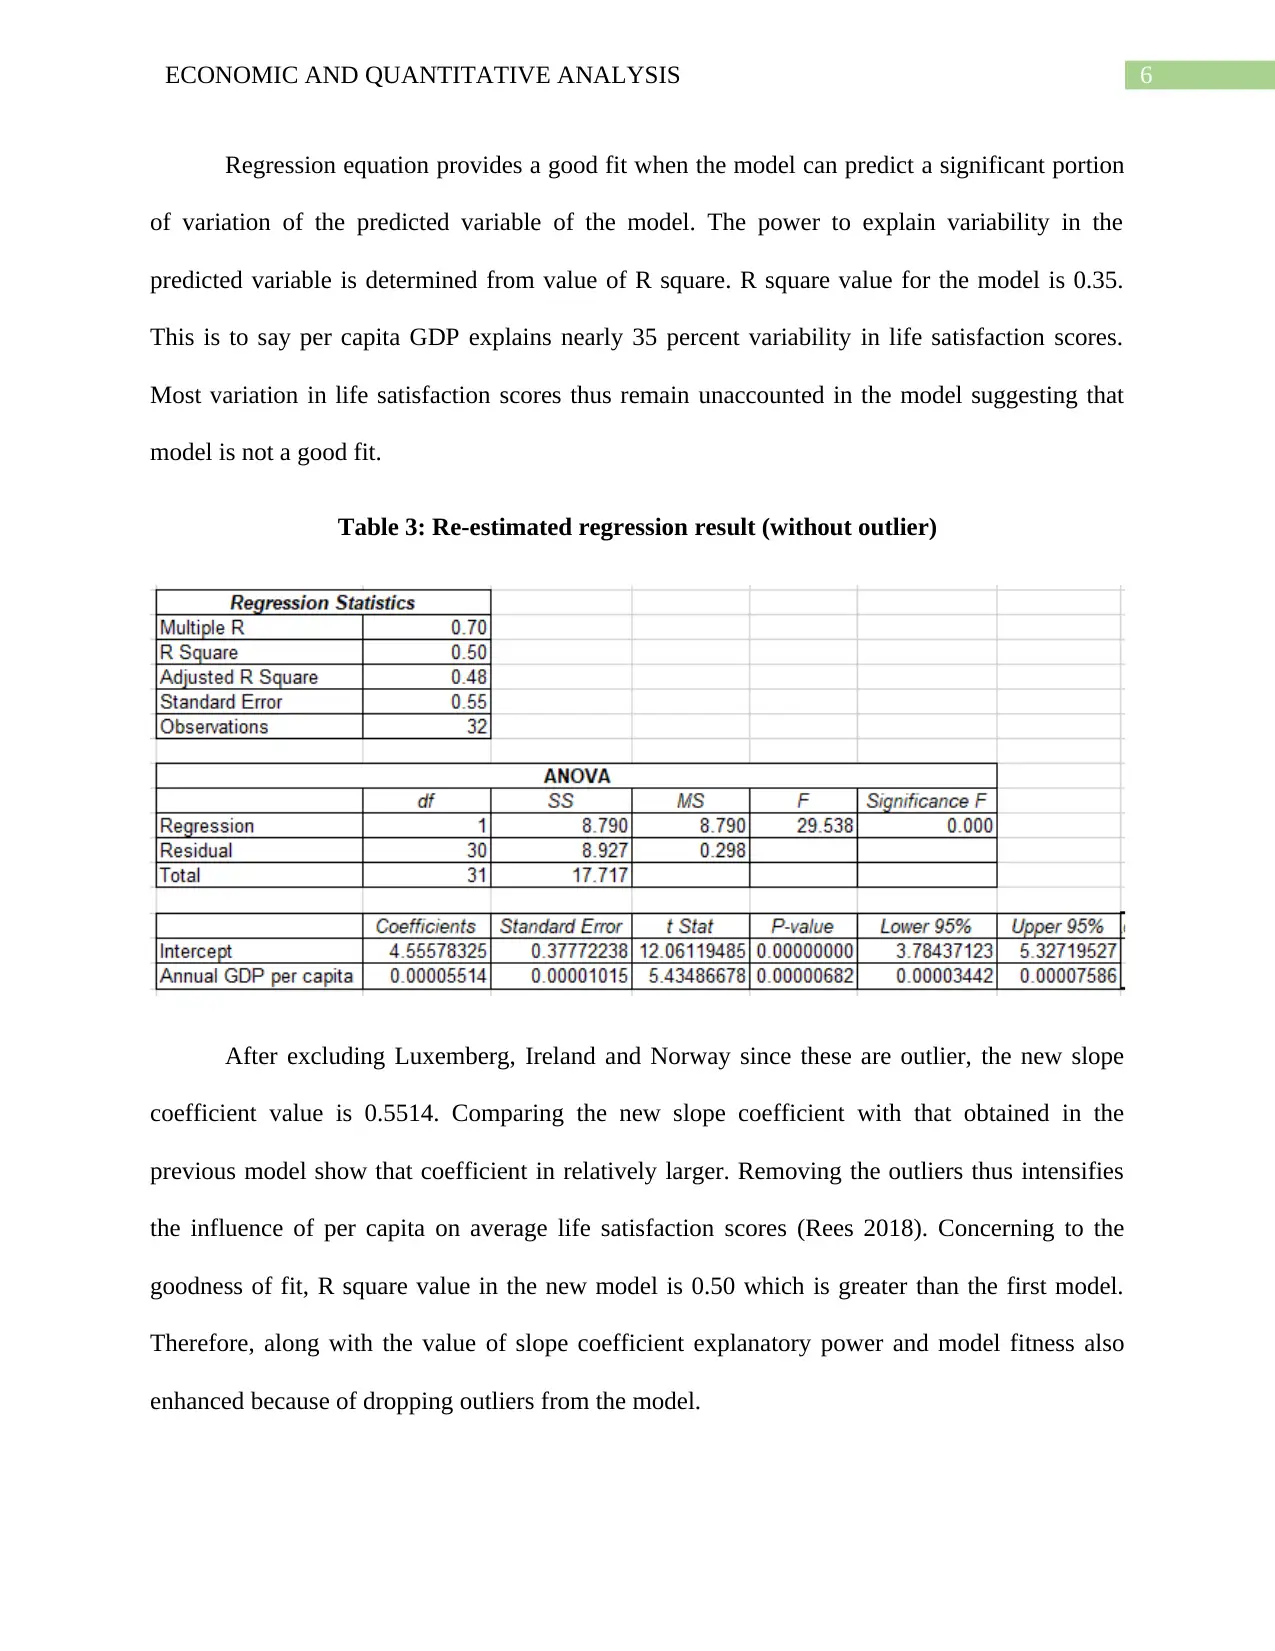
This report presents an economic study analyzing the relationship between average life satisfaction and GDP per capita using linear regression. The report begins with a background on the debate surrounding the determinants of life satisfaction, particularly the role of economic factors like GDP. It then details the methodology, using OECD statistical data from 35 countries, descriptive analysis, scatter plots, and linear regression to examine the correlation. The results section provides descriptive statistics, a scatter plot illustrating the positive association, and regression estimates, including slope coefficients and R-squared values. The analysis reveals a positive and statistically significant relationship between GDP per capita and life satisfaction, with an increased impact after excluding outliers. The discussion interprets these findings, acknowledging the study's strengths and limitations. Finally, the report recommends that governments, particularly in low-income economies, focus on supporting income growth and economic development, while considering qualitative factors like literacy and health, to improve life satisfaction. The report concludes that GDP is a significant factor in determining life satisfaction.
tabler-icon-diamond-filled.svg

Contribute Materials

Your contribution can guide someone’s learning journey. Share your documents today.
Document Page
Running head: ECONOMIC AND QUANTITATIVE ANALYSIS
Economic And Quantitative Analysis
Name of the Student
Name of the University
Author note
tabler-icon-diamond-filled.svg

Secure Best Marks with AI Grader

Need help grading? Try our AI Grader for instant feedback on your assignments.
Document Page
1ECONOMIC AND QUANTITATIVE ANALYSIS
Table of Contents
Purpose............................................................................................................................................2
Background......................................................................................................................................2
Method.............................................................................................................................................2
Result...............................................................................................................................................3
Discussion........................................................................................................................................7
Recommendation.............................................................................................................................7
References list..................................................................................................................................9
Document Page
2ECONOMIC AND QUANTITATIVE ANALYSIS
Purpose
The report conducts an economic study to relate average life satisfaction and GDP per
capita using statistical tool of linear regression.
Background
The determinants of level of life satisfaction still remain unclear and is a subject of
intense debate among economists, social scientists and policy makers. The reliance on only
economic factors like GDP or income in determining happiness does not always give satisfactory
result and indicate actual picture of happiness. Economic data on life satisfaction are highly
questioned. On famous paper in 1974 showed increase un GDP does not necessarily correlated
with happiness (Strulik 2015). This paradox encouraged more researchers to study well-being of
a nation. GDP though is not the only determinant it still however remains an important
determinant of life satisfaction. Some previous researchers were of the view that GDP influences
life satisfaction within a given range of income. As per Stevenson and Wolfers, the positive
influence of GDP on wealth is valid for a per capita GDP of below $15,000 (Stevenson and
Wolfers 2013). Beyond this level the impact of GDP on life satisfaction flattens. Another study
made by Deaton (2008) using the regression analysis showed a significant positive relation
between life satisfaction of a country and growth rate of GDP. In view of the past studies, the
current paper conducts a separate research scrutinize the proposed relation.
Method
The paper uses OECD’s statistical data on average life satisfaction scores and annual per
capita GDP for scrutinizing the relation between two indicators. Sample data are collected across
35 countries. The sample data set is then evaluated using statistical techniques of quantitative
Document Page
3ECONOMIC AND QUANTITATIVE ANALYSIS
data analysis method. The descriptive analysis gives overall summary measures of the selected
data series. Next, the scatter plot examines graphical relation between the per capita GDP and
life satisfaction. Estimation of relation between the two has been done by adapting the technique
of linear regression. The regression model has further been improved by re-estimating the model
after dropping the outliers.
Result
Table 1: Descriptive statistics
The table of descriptive analysis indicates mean life satisfaction score is 6.59 and that of
mean per capita GDP is $39011.51. Standard deviation of life satisfaction scores is 0.75 and that
for GDP per capita is 14006.21. Maximum and minimum scores for life satisfaction are 7.5 and
5.2 respectively. The highest and lowest GDP per capita are $86788.14 and $17122.53
respectively.
tabler-icon-diamond-filled.svg

Secure Best Marks with AI Grader

Need help grading? Try our AI Grader for instant feedback on your assignments.
Document Page
4ECONOMIC AND QUANTITATIVE ANALYSIS
Life satisfaction score is minimum in Greece and Portugal and score is the highest in
nations like Denmark, Iceland, Norway, Finland and Switzerland. Luxemberg and Mexico
respectively record the highest and lowest per capita GDP.
Diagram 1: Scatter plot (Average life satisfaction vs Per capita GDP)
The scores of life satisfaction when plotted against per capita GDP moves in the positive
direction with growth of per capita GDP. From the scatter diagram therefore a positive
association can be predicted for the relation between life satisfaction and per capita GDP.
A linear regression model can be developed for the purpose of predicting life satisfaction
score for an associated level of per capita GDP. The standard regression model for this is
Y = β0 +β1 X
In order to use above model for predicting life satisfaction scores ‘life satisfaction’ needs
to be taken as Y variable and ‘per capita GDP’ should be taken as X variable. Slope coefficient
for per capita GDP is β1 while the vertical intercept is β0
Document Page
5ECONOMIC AND QUANTITATIVE ANALYSIS
Table 2: Regression estimates
The estimated model for predicting life satisfaction score is the following
^Life satisfaction=5.3652+(0.000031× GDP per capita)
Slope coefficient in the linear regression model indicates the direction and magnitude of
change in the predicted variable given unit change in predictor variable. Slope coefficient of the
model is 0.3143. Positive slope coefficient meaning increase in per capita GDP brings a positive
change in life satisfaction. Change in life satisfaction score is 0.31 units for unit change in per
capita GDP.
In order to make any valid conclusion regarding the relation between the two variables
the relation needs to be statistically significant. The p value approach is a convenient way to
examine statistical validity of the relation (Pyrczak 2016). For the coefficient, the p value is
0.0002. Given the p value lower than significance level, the coefficient can be considered as
statistically significant. This suggests the coefficient is different from zero and therefore, the
obtained association is statistically significant.
Document Page
6ECONOMIC AND QUANTITATIVE ANALYSIS
Regression equation provides a good fit when the model can predict a significant portion
of variation of the predicted variable of the model. The power to explain variability in the
predicted variable is determined from value of R square. R square value for the model is 0.35.
This is to say per capita GDP explains nearly 35 percent variability in life satisfaction scores.
Most variation in life satisfaction scores thus remain unaccounted in the model suggesting that
model is not a good fit.
Table 3: Re-estimated regression result (without outlier)
After excluding Luxemberg, Ireland and Norway since these are outlier, the new slope
coefficient value is 0.5514. Comparing the new slope coefficient with that obtained in the
previous model show that coefficient in relatively larger. Removing the outliers thus intensifies
the influence of per capita on average life satisfaction scores (Rees 2018). Concerning to the
goodness of fit, R square value in the new model is 0.50 which is greater than the first model.
Therefore, along with the value of slope coefficient explanatory power and model fitness also
enhanced because of dropping outliers from the model.
tabler-icon-diamond-filled.svg

Paraphrase This Document

Need a fresh take? Get an instant paraphrase of this document with our AI Paraphraser
Document Page
7ECONOMIC AND QUANTITATIVE ANALYSIS
Discussion
The paper estimates a positive causality between per capita GDP and life satisfaction.
The paper thus suggests life satisfaction increases to some extent when people experience a
growth in income. The impact of per capita GDP on life satisfaction even increase when
countries with larger per capita GDP has been eliminated.
Strength of the paper is the application of systematic quantitative analysis technique to
arrive at the result. Before making conclusion on the relation the paper conducts significance test
using p value approach. Use of simple linear regression and easy interpretation add to the
strength of the paper (Patten and Newhart 2017). Ignoring other factors influencing life
satisfaction is one limitation of the study. Limited size of the sample is another limitation.
The paper support the basis hypothesis that asserts GDP as one vital constituent of life
satisfaction. The result opposes the finding of Easterlin and some others where life satisfaction
was taken an independent of GDP (Ngamaba 2016). Since the paper shows statistically
significant association between income and per capita GDP policy conclusion can be made based
on the finding.
Recommendation
The paper has confirmed income to be a significant constituent of life satisfaction.
Therefore, government especially in the low income economies should focus on supporting
income (directly or indirectly) to increase satisfaction.
Increasing GDP and boosting economic growth enable people to enjoy a greater income
and increase life satisfaction. Improvement in productivity through increasing efficiency in
Document Page
8ECONOMIC AND QUANTITATIVE ANALYSIS
resource utilization, infrastructural development and other can contribute to a higher GDP and
better satisfaction.
While focusing on improving quantitative indicators qualitative indicators like literacy,
health, cultural and social factors should not be ignored since these factors also determine life
satisfaction.
Document Page
9ECONOMIC AND QUANTITATIVE ANALYSIS
References list
Ngamaba, K.H., 2016. Happiness and life satisfaction in Rwanda. Journal of Psychology in
Africa, 26(5), pp.407-414.
Patten, M.L. and Newhart, M., 2017. Understanding research methods: An overview of the
essentials. Routledge.
Pyrczak, F., 2016. Making sense of statistics: A conceptual overview. Routledge.
Rees, D.G., 2018. Essential statistics. Chapman and Hall/CRC.
Stevenson, B. and Wolfers, J., 2013. Subjective well-being and income: Is there any evidence of
satiation?. American Economic Review, 103(3), pp.598-604.
Strulik, H., 2015. Preferences, income, and life satisfaction: An equivalence
result. Mathematical Social Sciences, 75, pp.20-26.
chevron_up_icon
1 out of 10
circle_padding
hide_on_mobile
zoom_out_icon
logo.png

Your All-in-One AI-Powered Toolkit for Academic Success.

Available 24*7 on WhatsApp / Email

[object Object]