BSTA001 Business Statistics: Analyzing Life Satisfaction Factors
VerifiedAdded on 2023/03/30
|8
|1181
|92
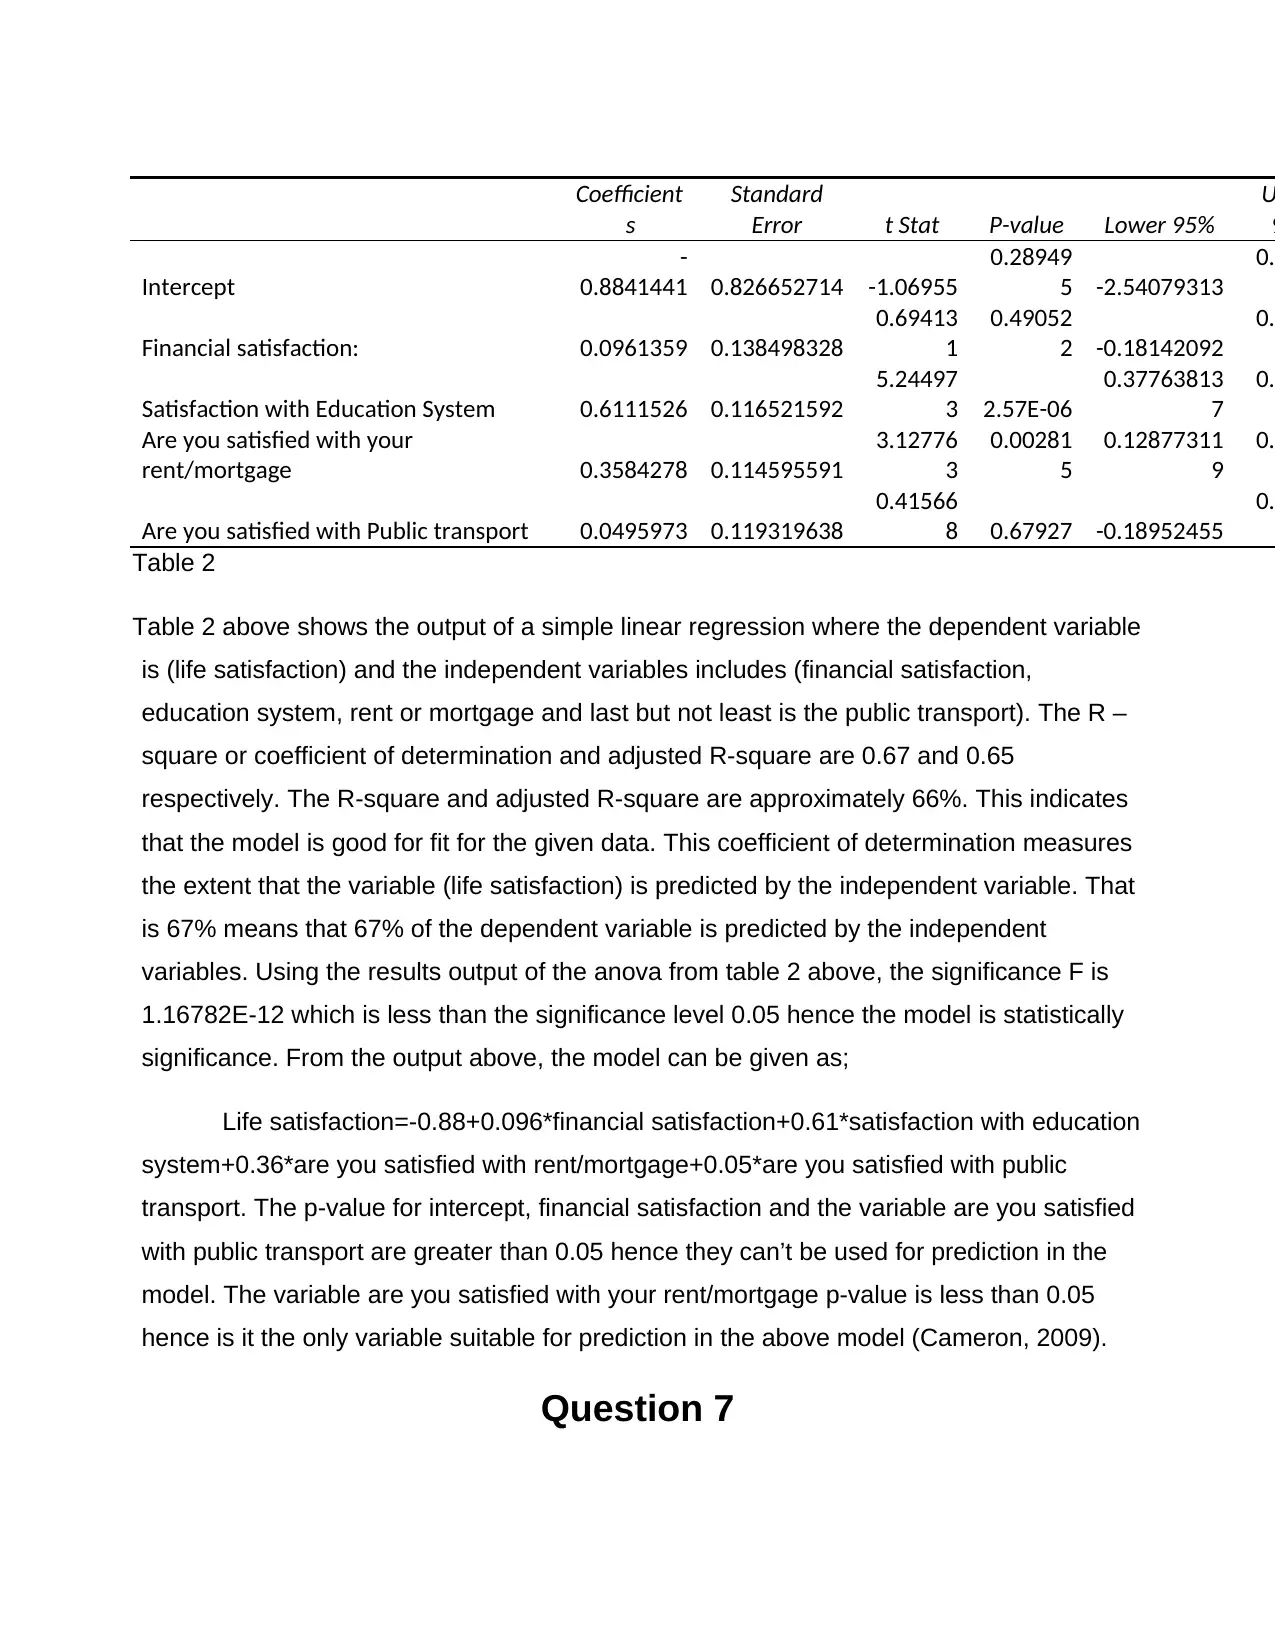
Report
AI Summary
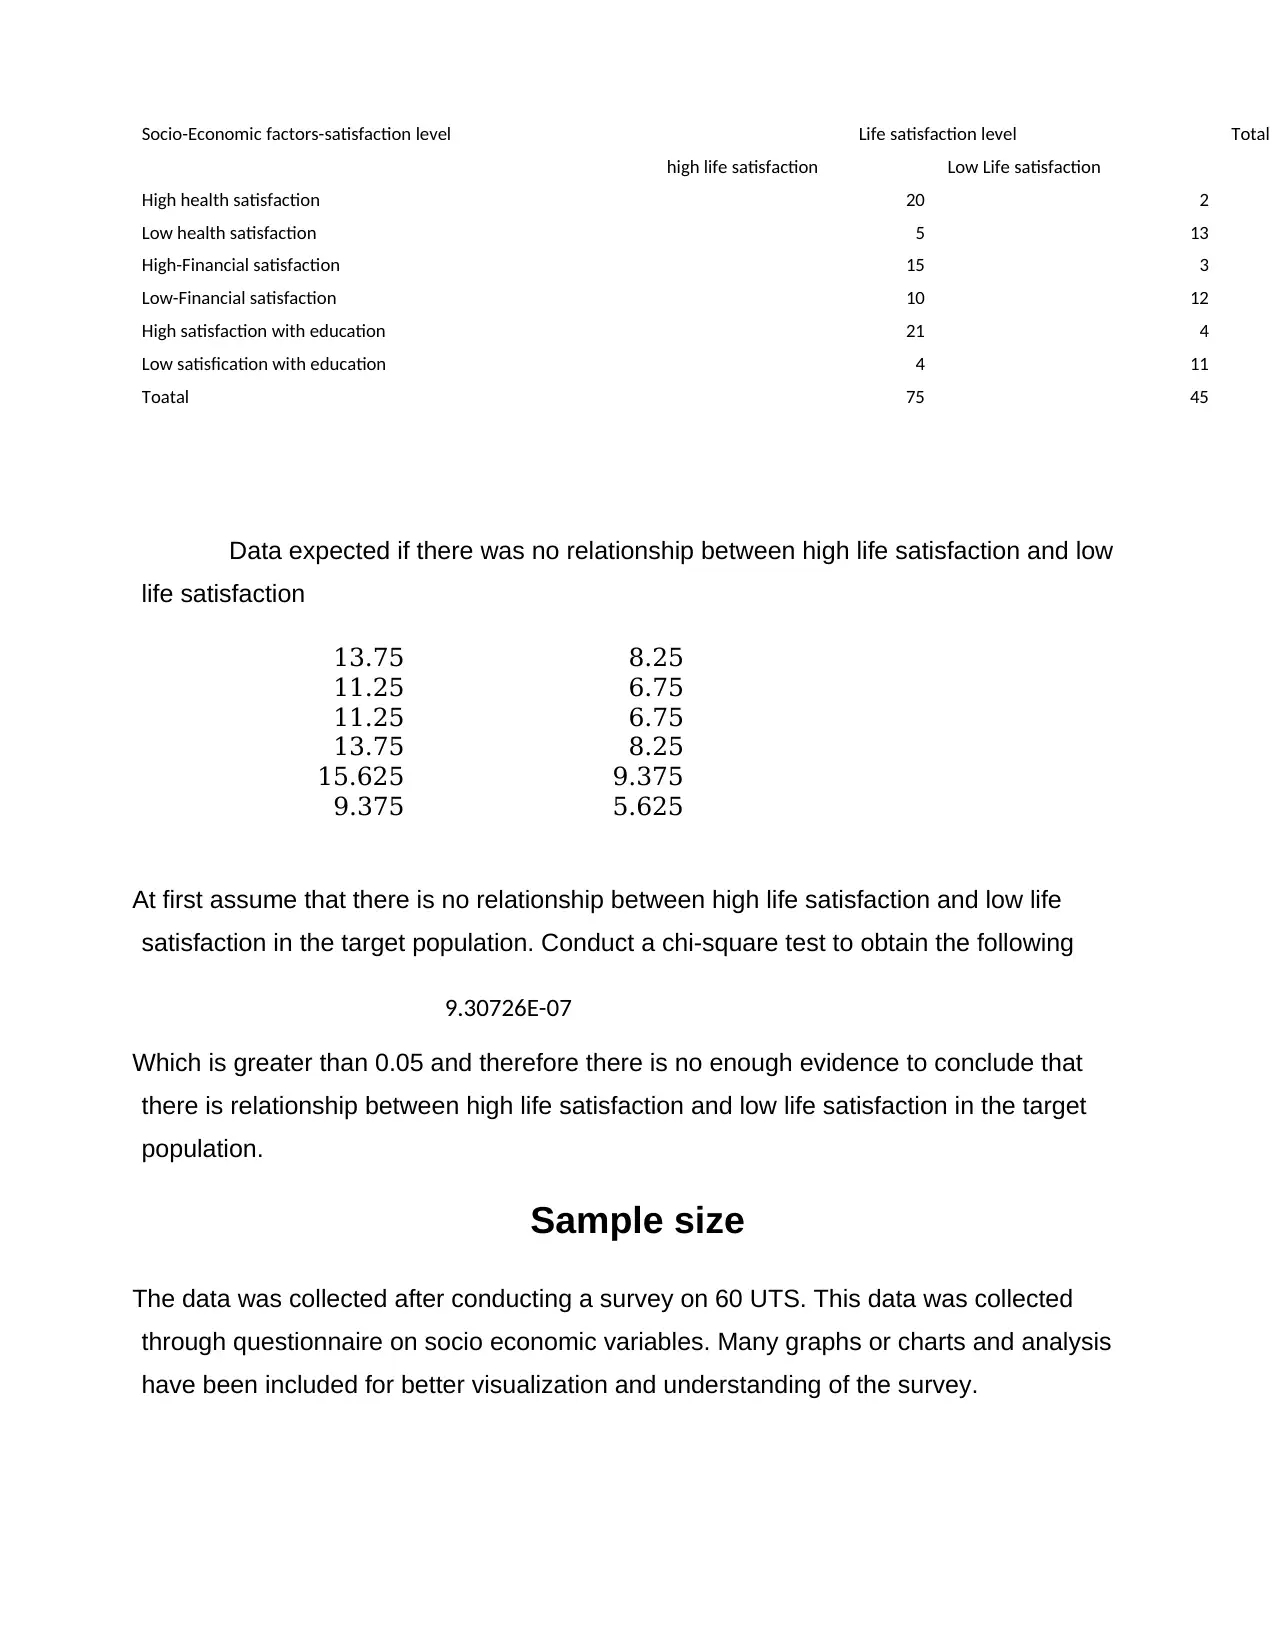
This report summarizes data on life satisfaction and socio-economic factors, based on a sample size of approximately 60. Statistical analysis, including histograms, hypothesis testing, and scatter plots, reveals that individuals with high life satisfaction are more likely to be highly satisfied with their health. The findings indicate insufficient evidence to establish a definitive relationship between life satisfaction and socio-economic factors. Regression analysis identifies financial satisfaction as a potentially significant predictor of life satisfaction, although further investigation is warranted. Hypothesis testing supports the conclusion that individuals with higher life satisfaction are more likely to report higher health satisfaction. A chi-square test suggests no significant relationship between life satisfaction levels and socio-economic factors within the target population. The report concludes by emphasizing the need for further research incorporating additional variables to enhance the predictive power of the regression model. Desklib provides access to similar solved assignments and resources for students.


1 out of 8
Related Documents


Your All-in-One AI-Powered Toolkit for Academic Success.
+13062052269
info@desklib.com
Available 24*7 on WhatsApp / Email
![[object Object]](/_next/static/media/star-bottom.7253800d.svg)
Copyright © 2020–2026 A2Z Services. All Rights Reserved. Developed and managed by ZUCOL.