Research Method Design Report for Lincoln Christmas Market Visitors
VerifiedAdded on  2023/01/23
|34
|5482
|72
Report
AI Summary
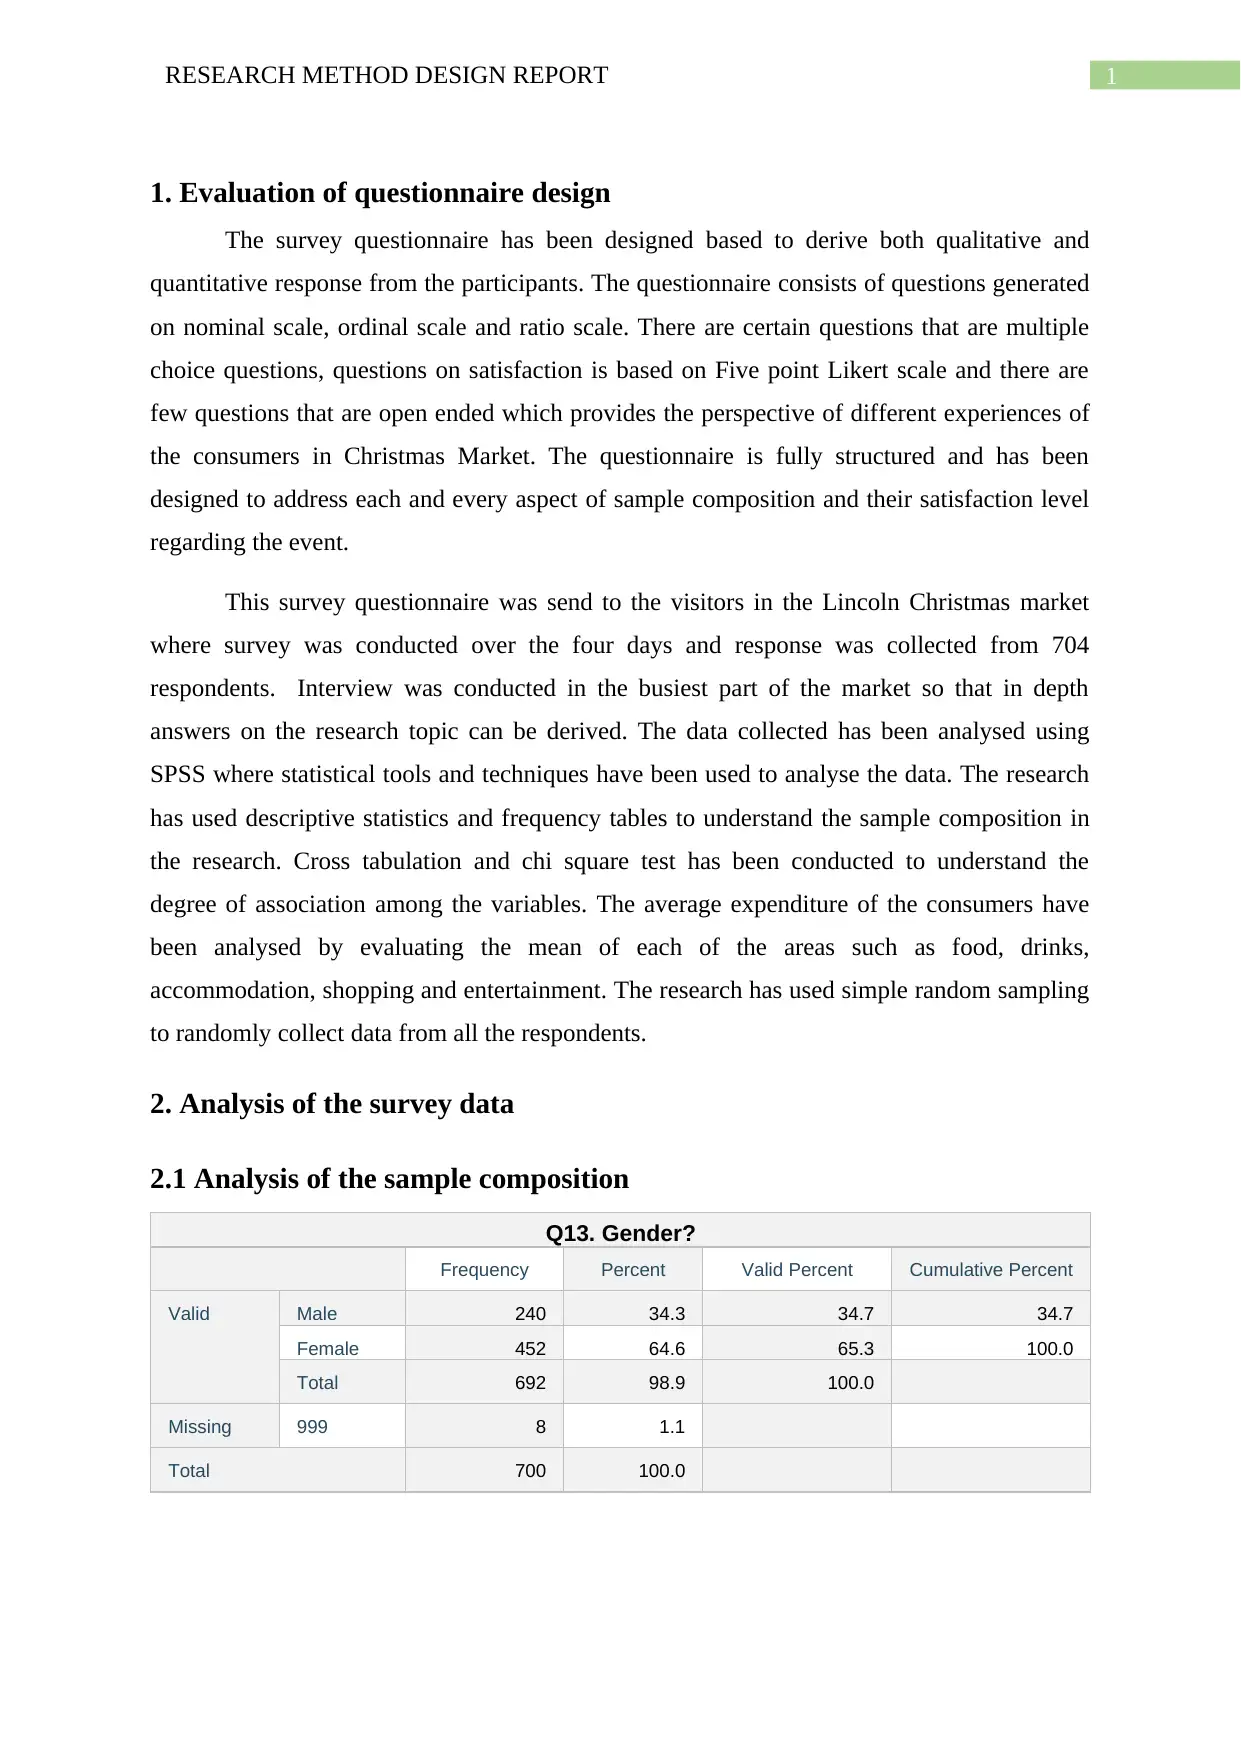
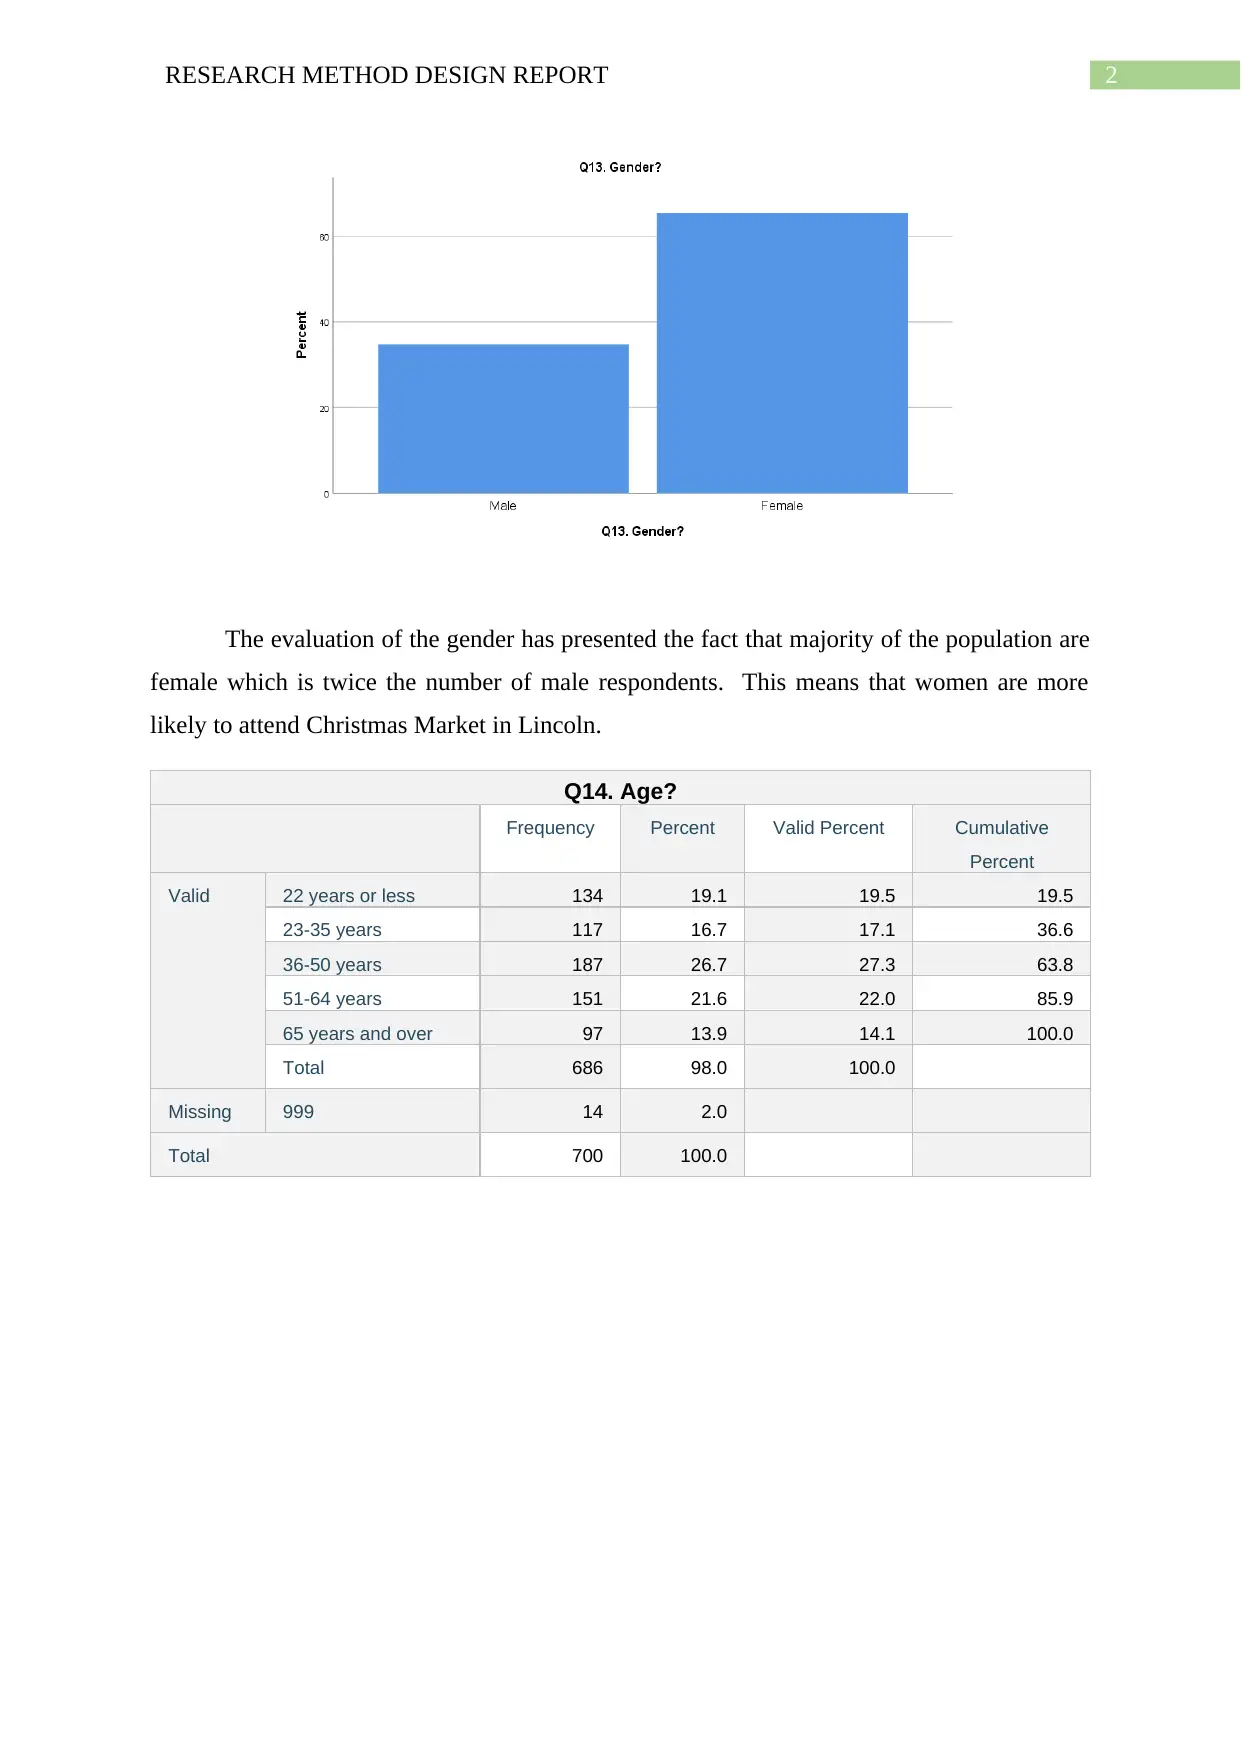
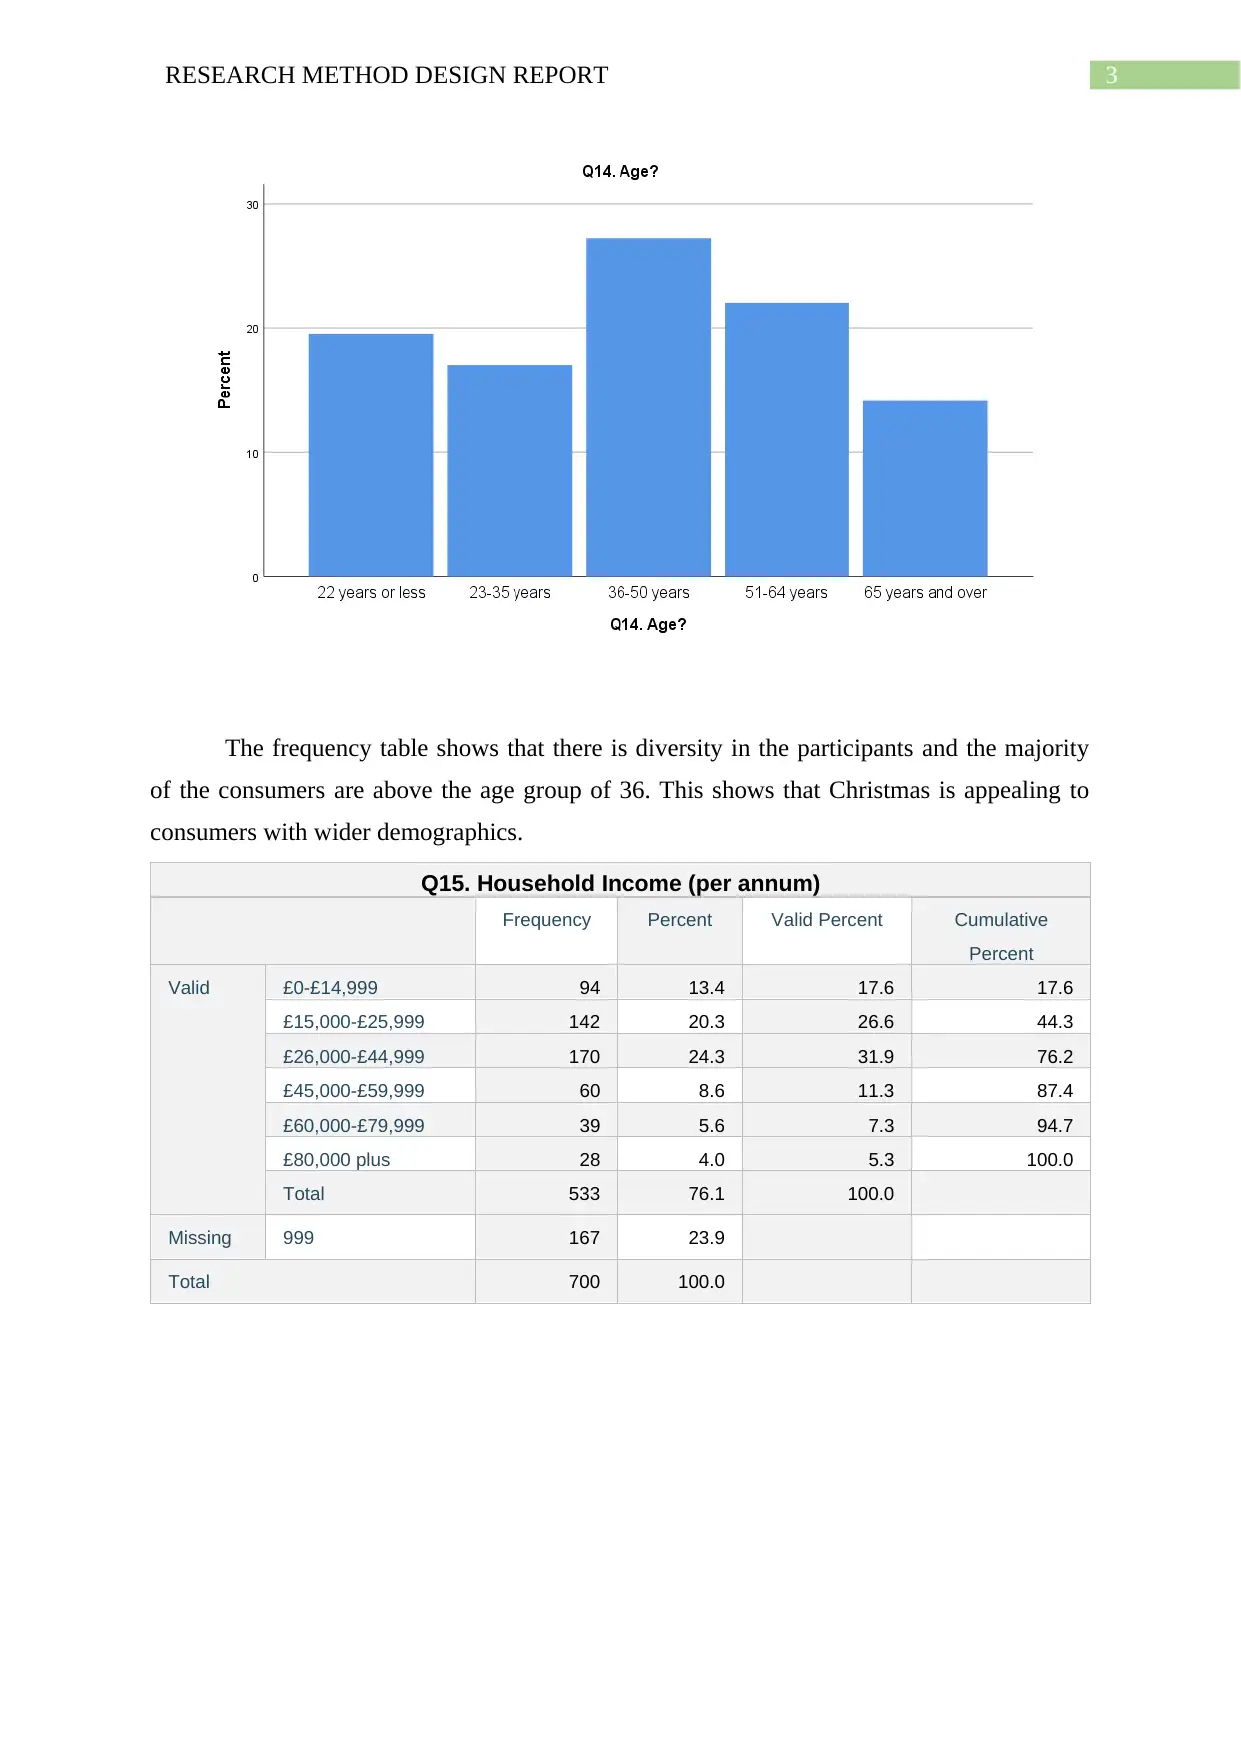
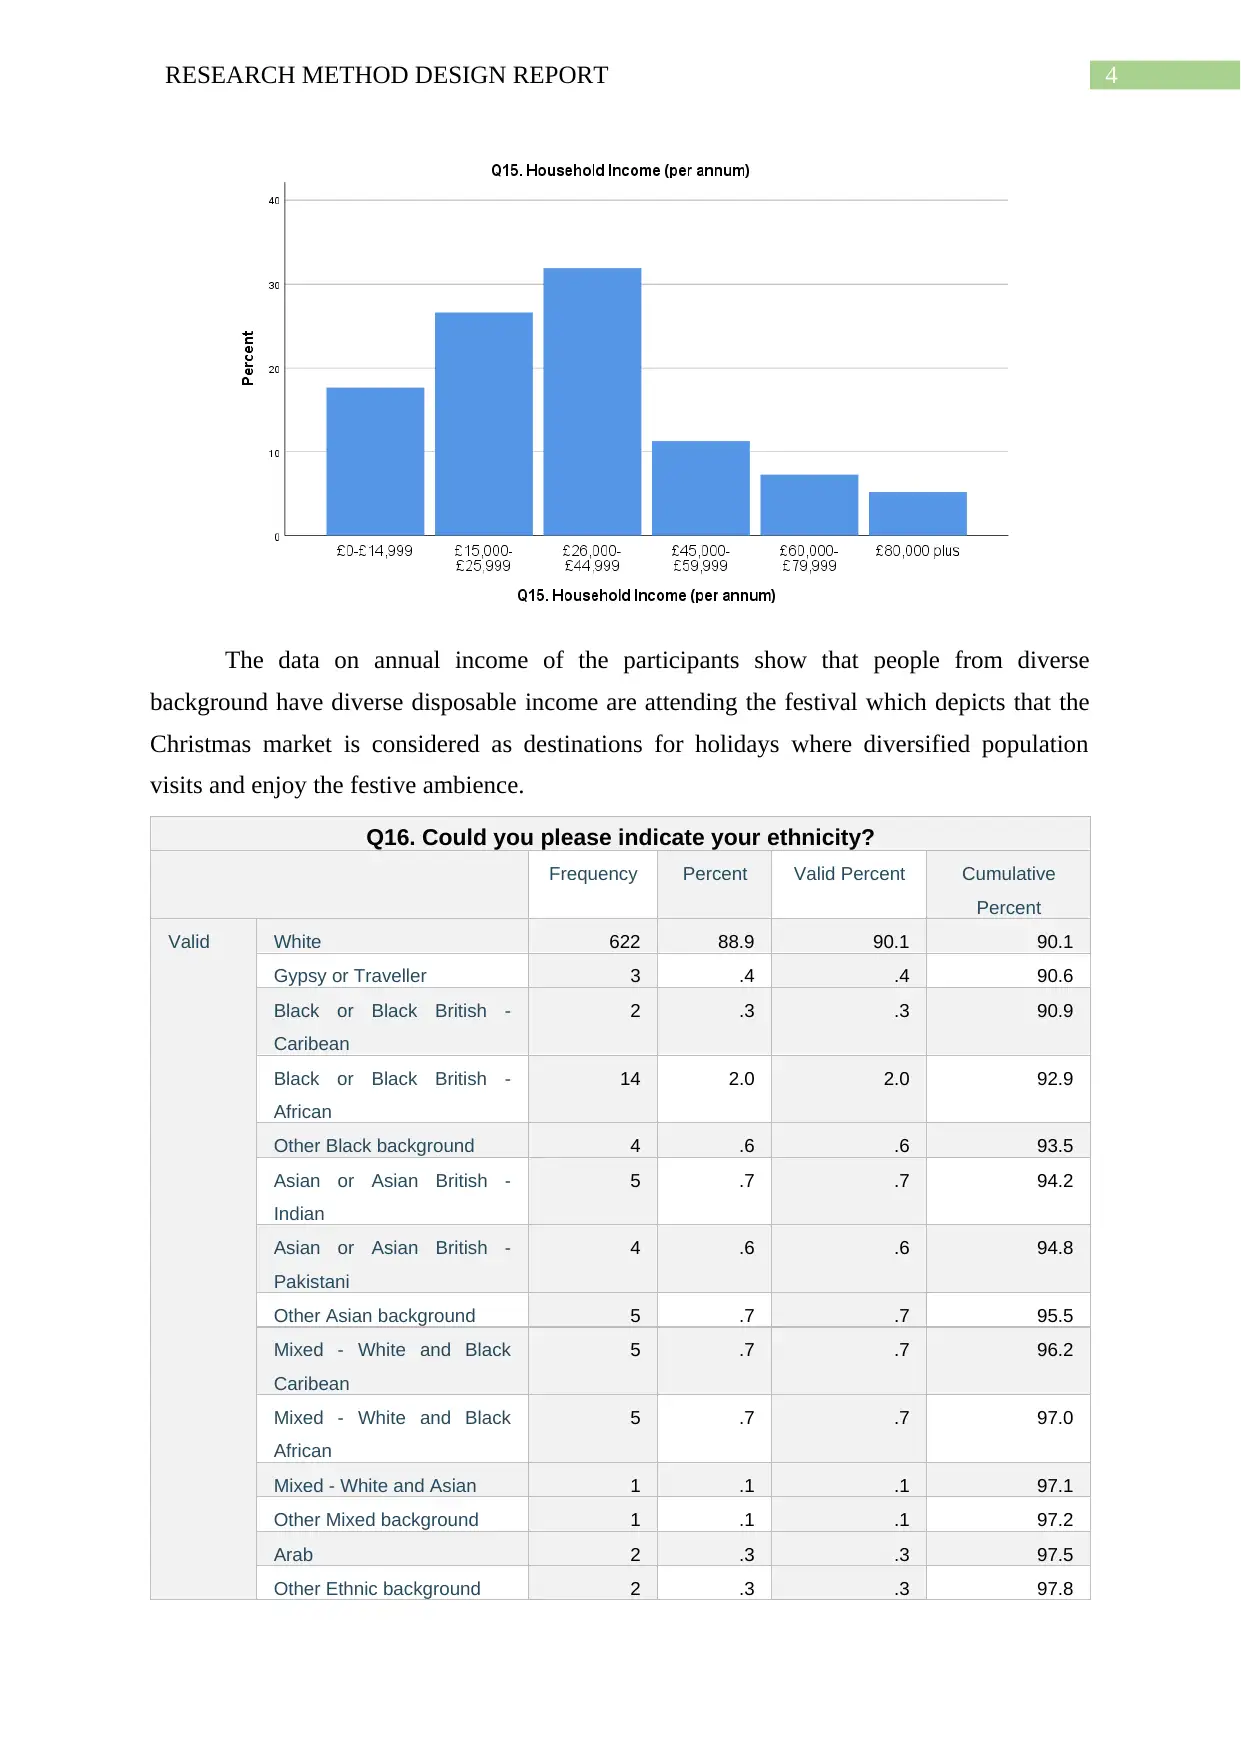
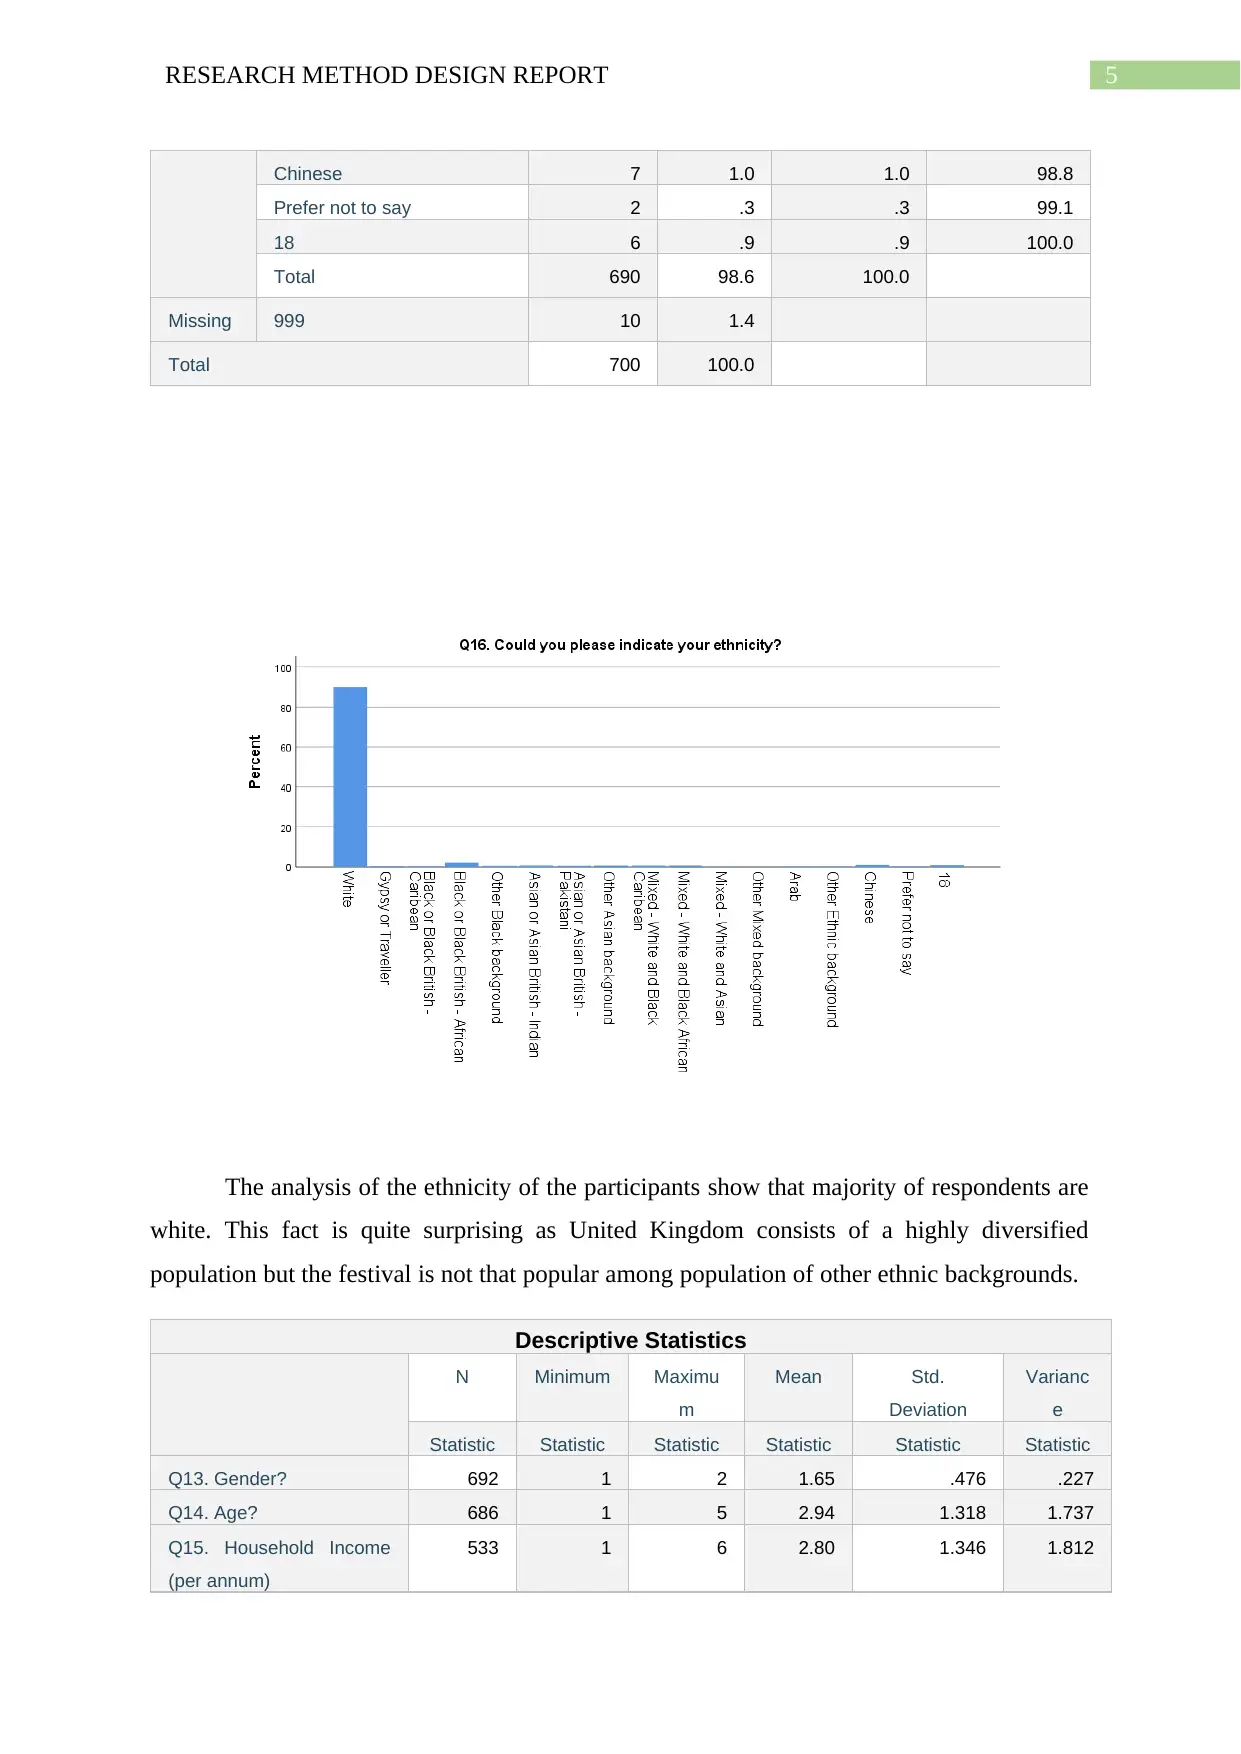
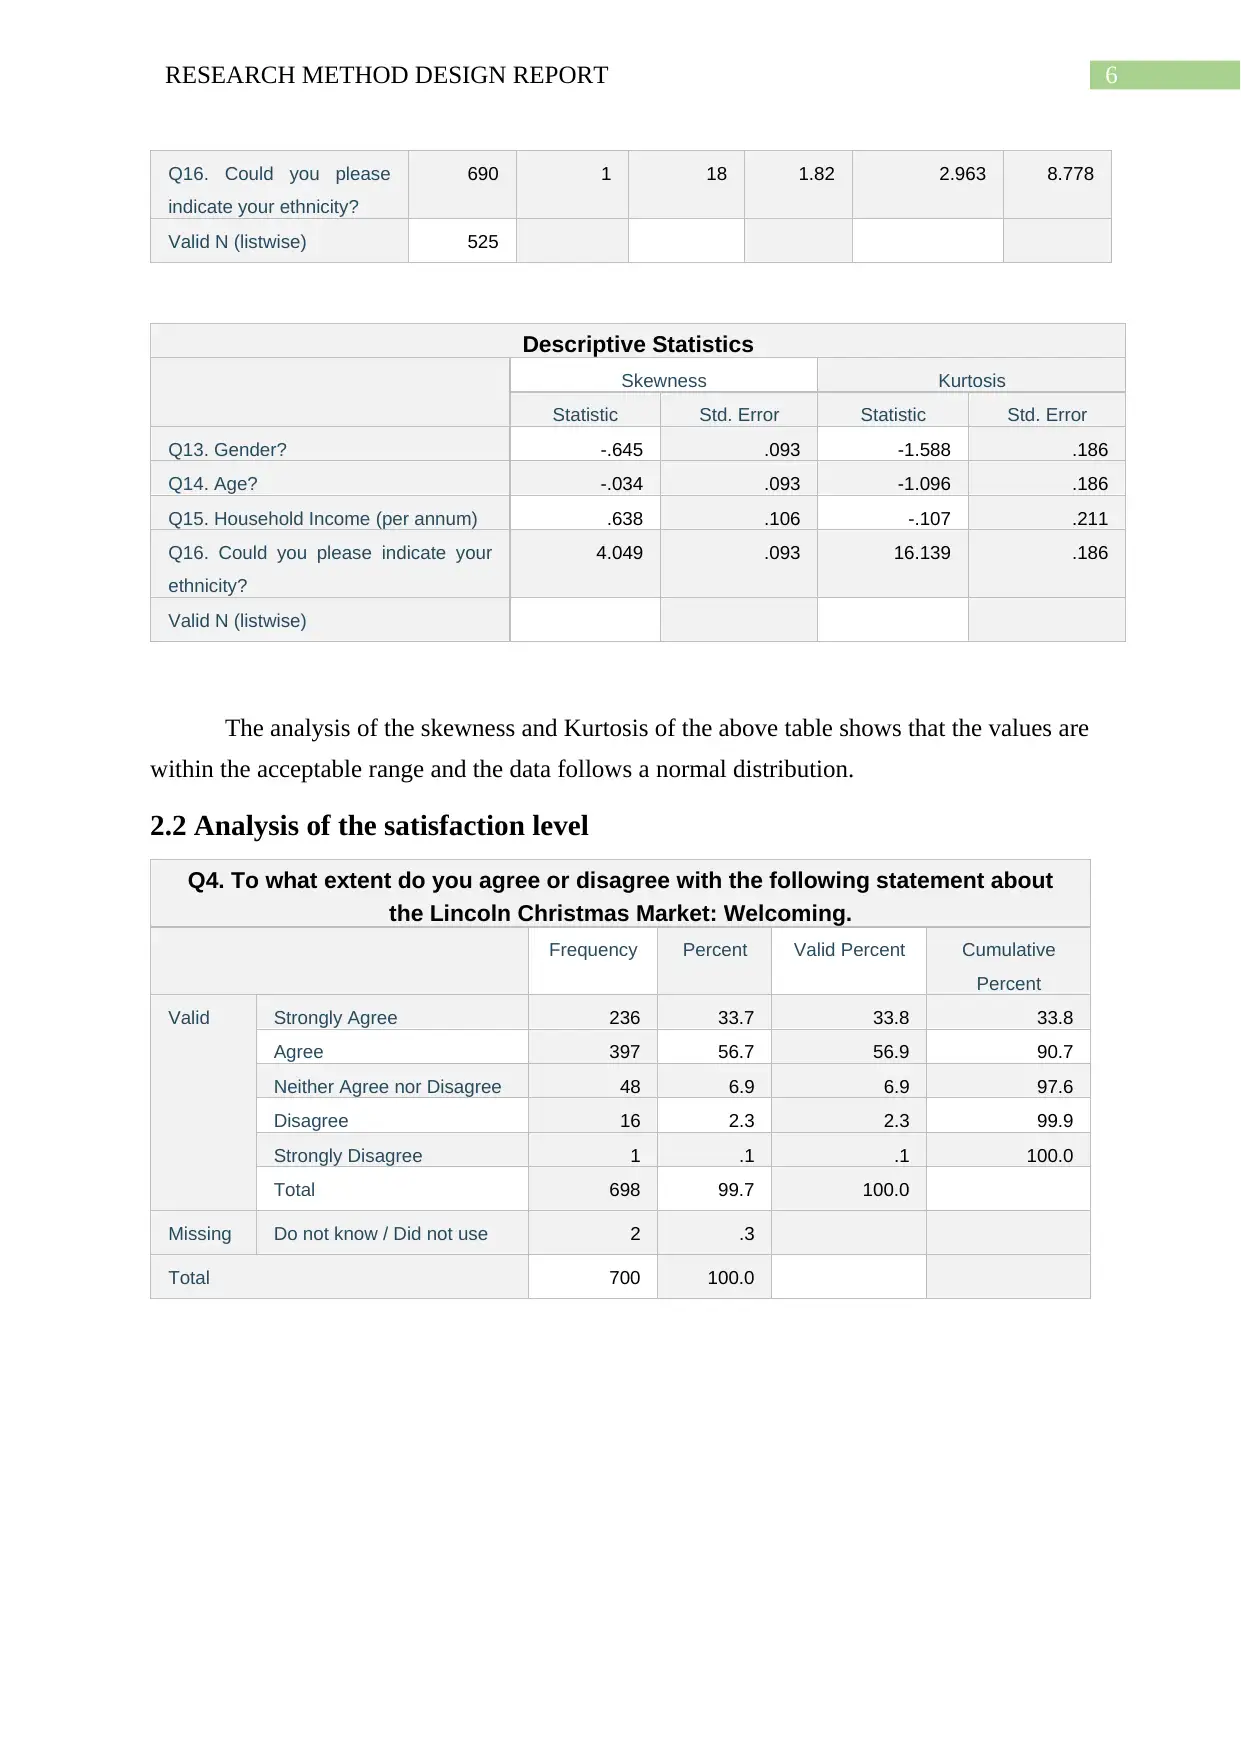
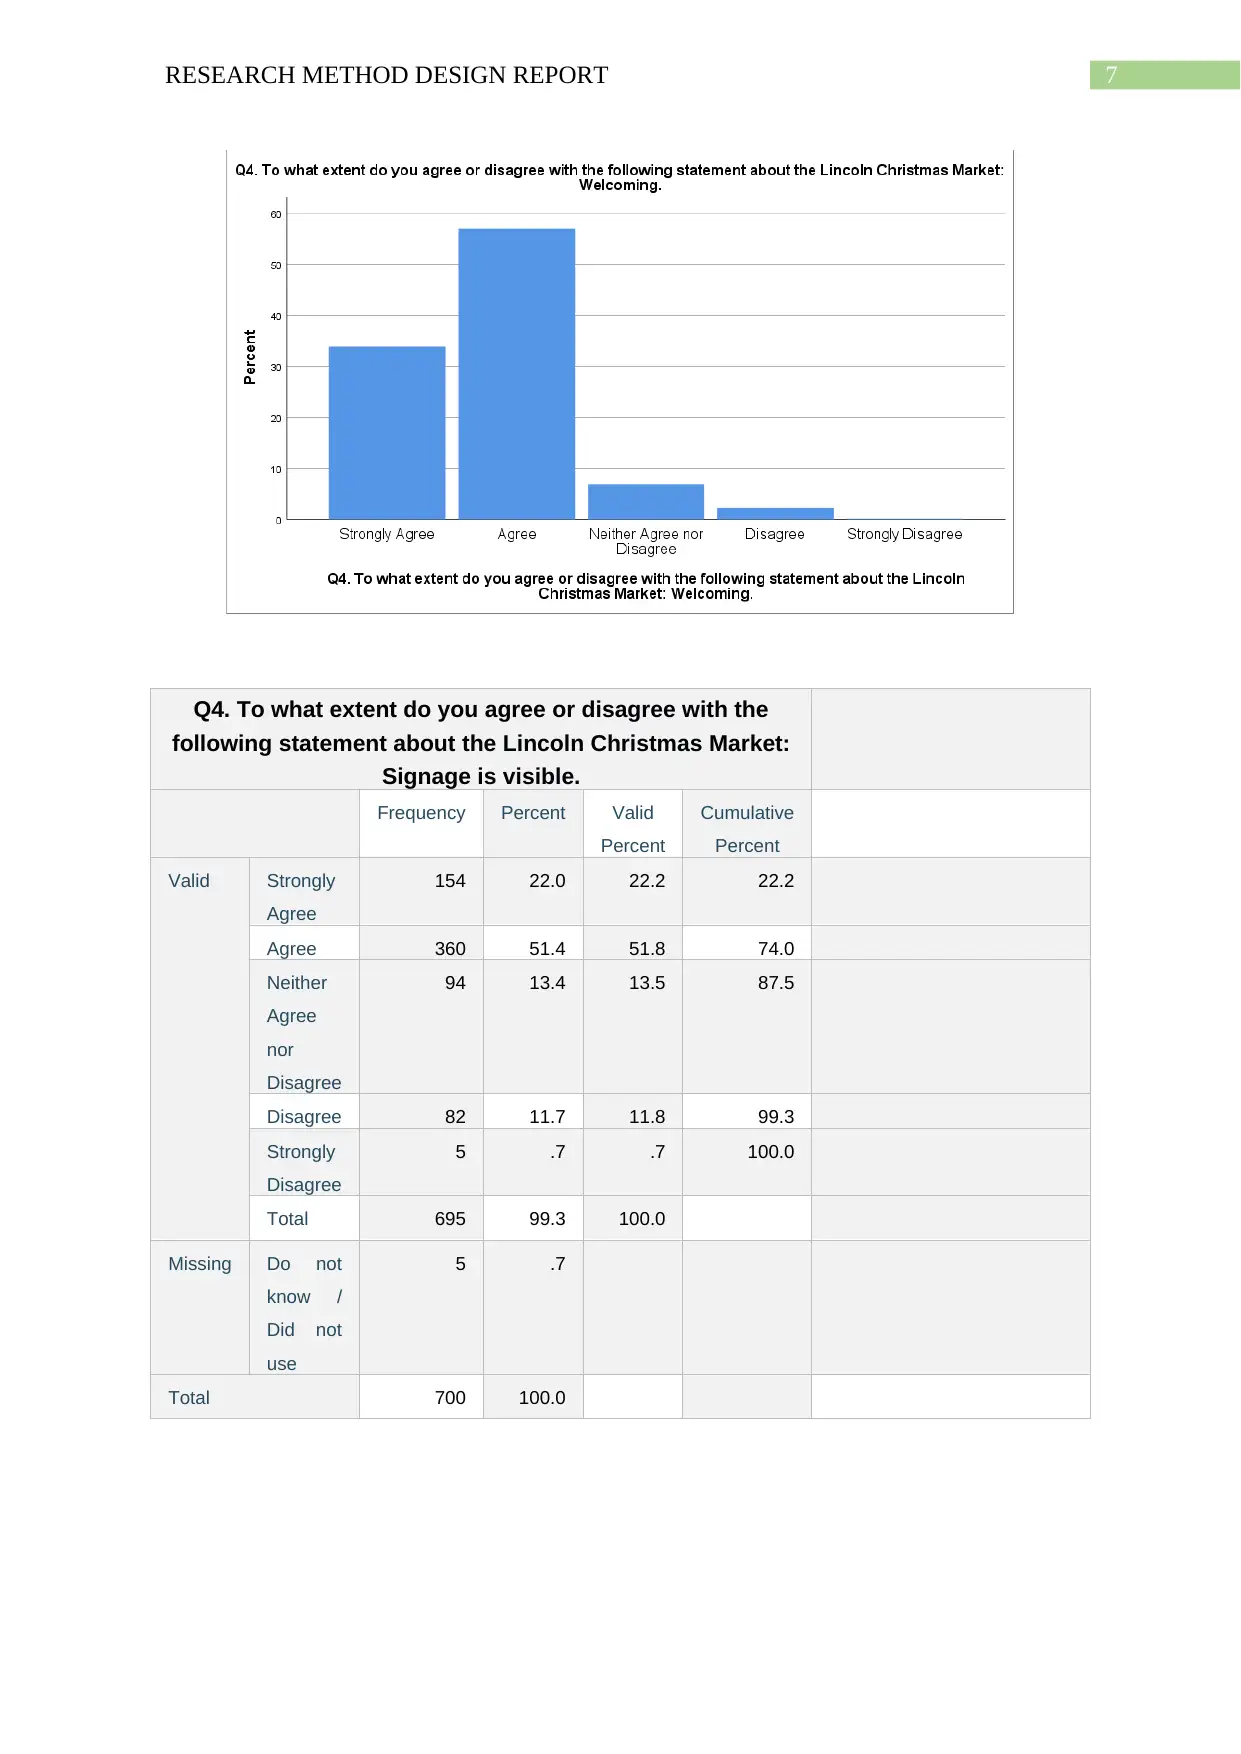
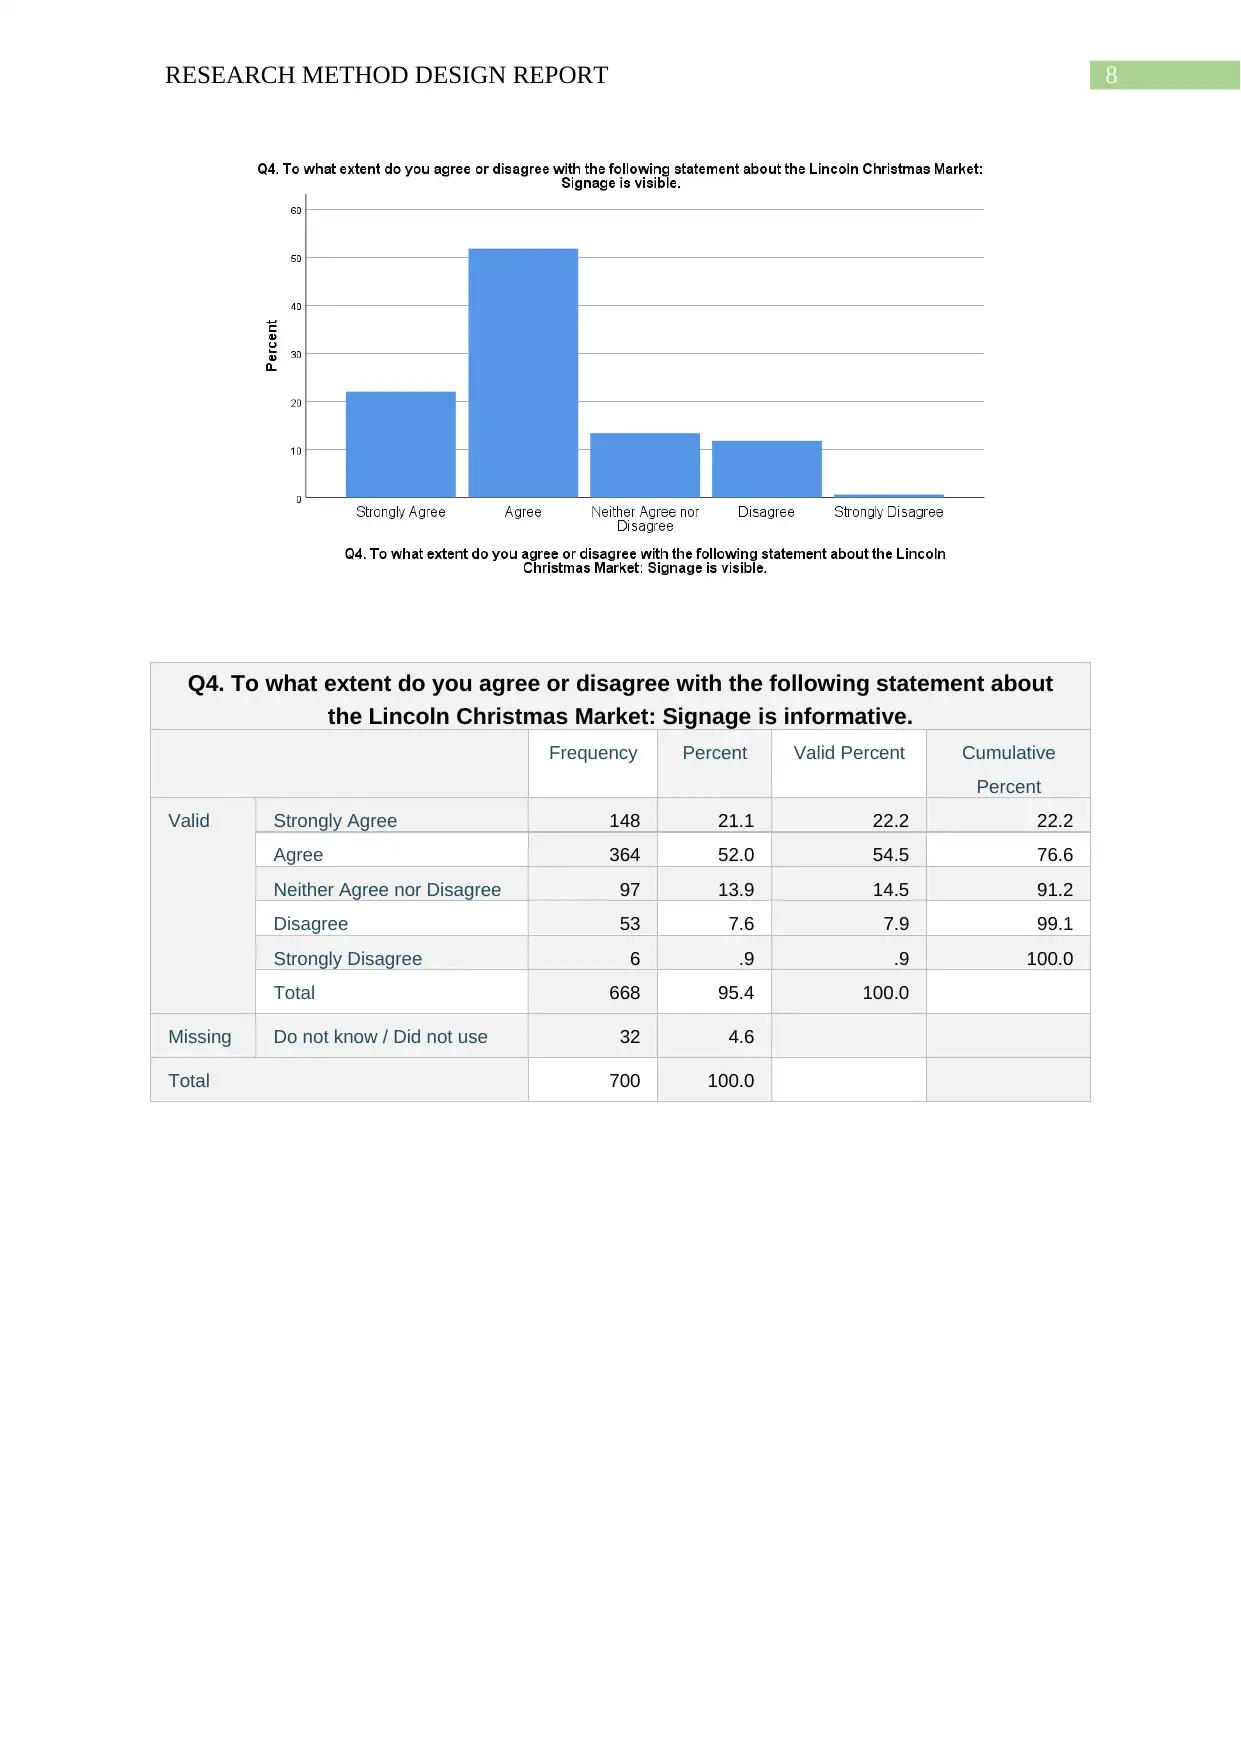
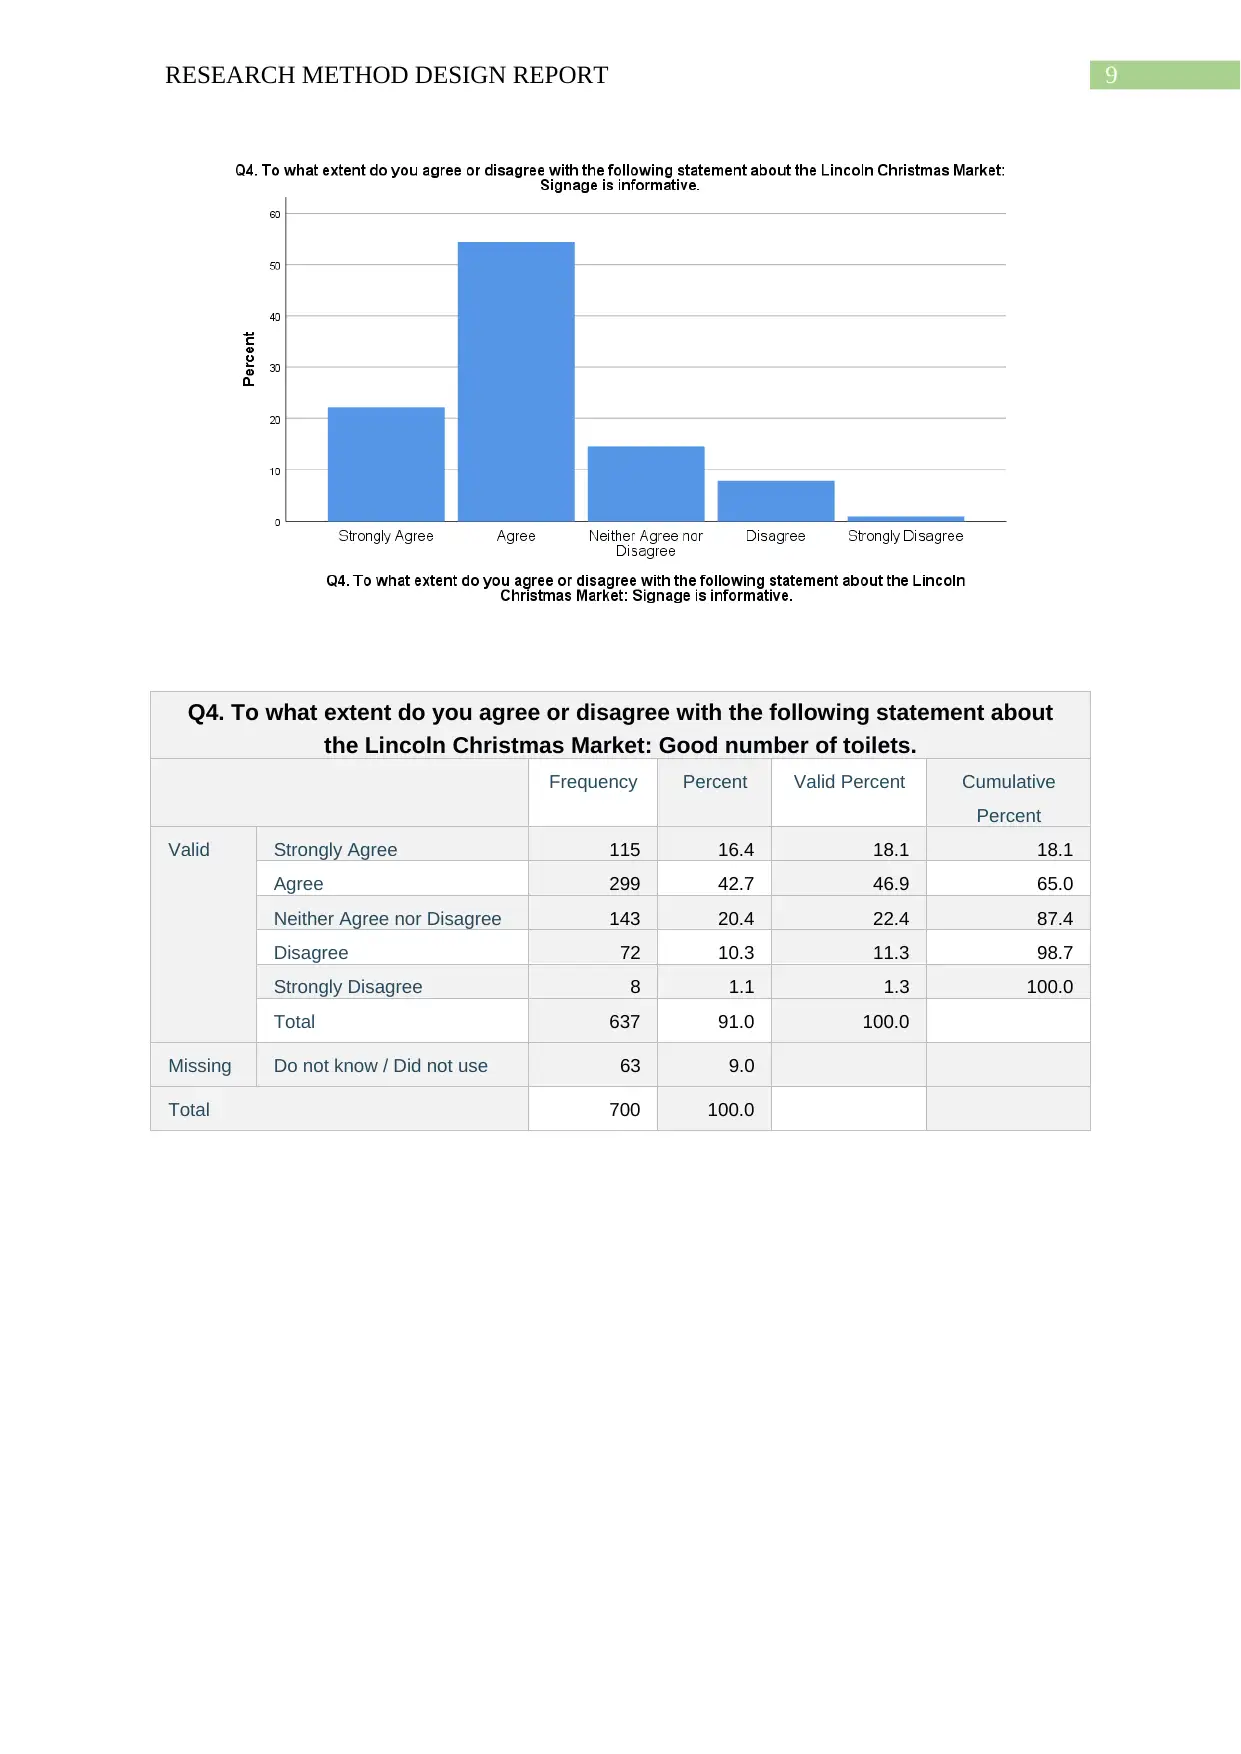
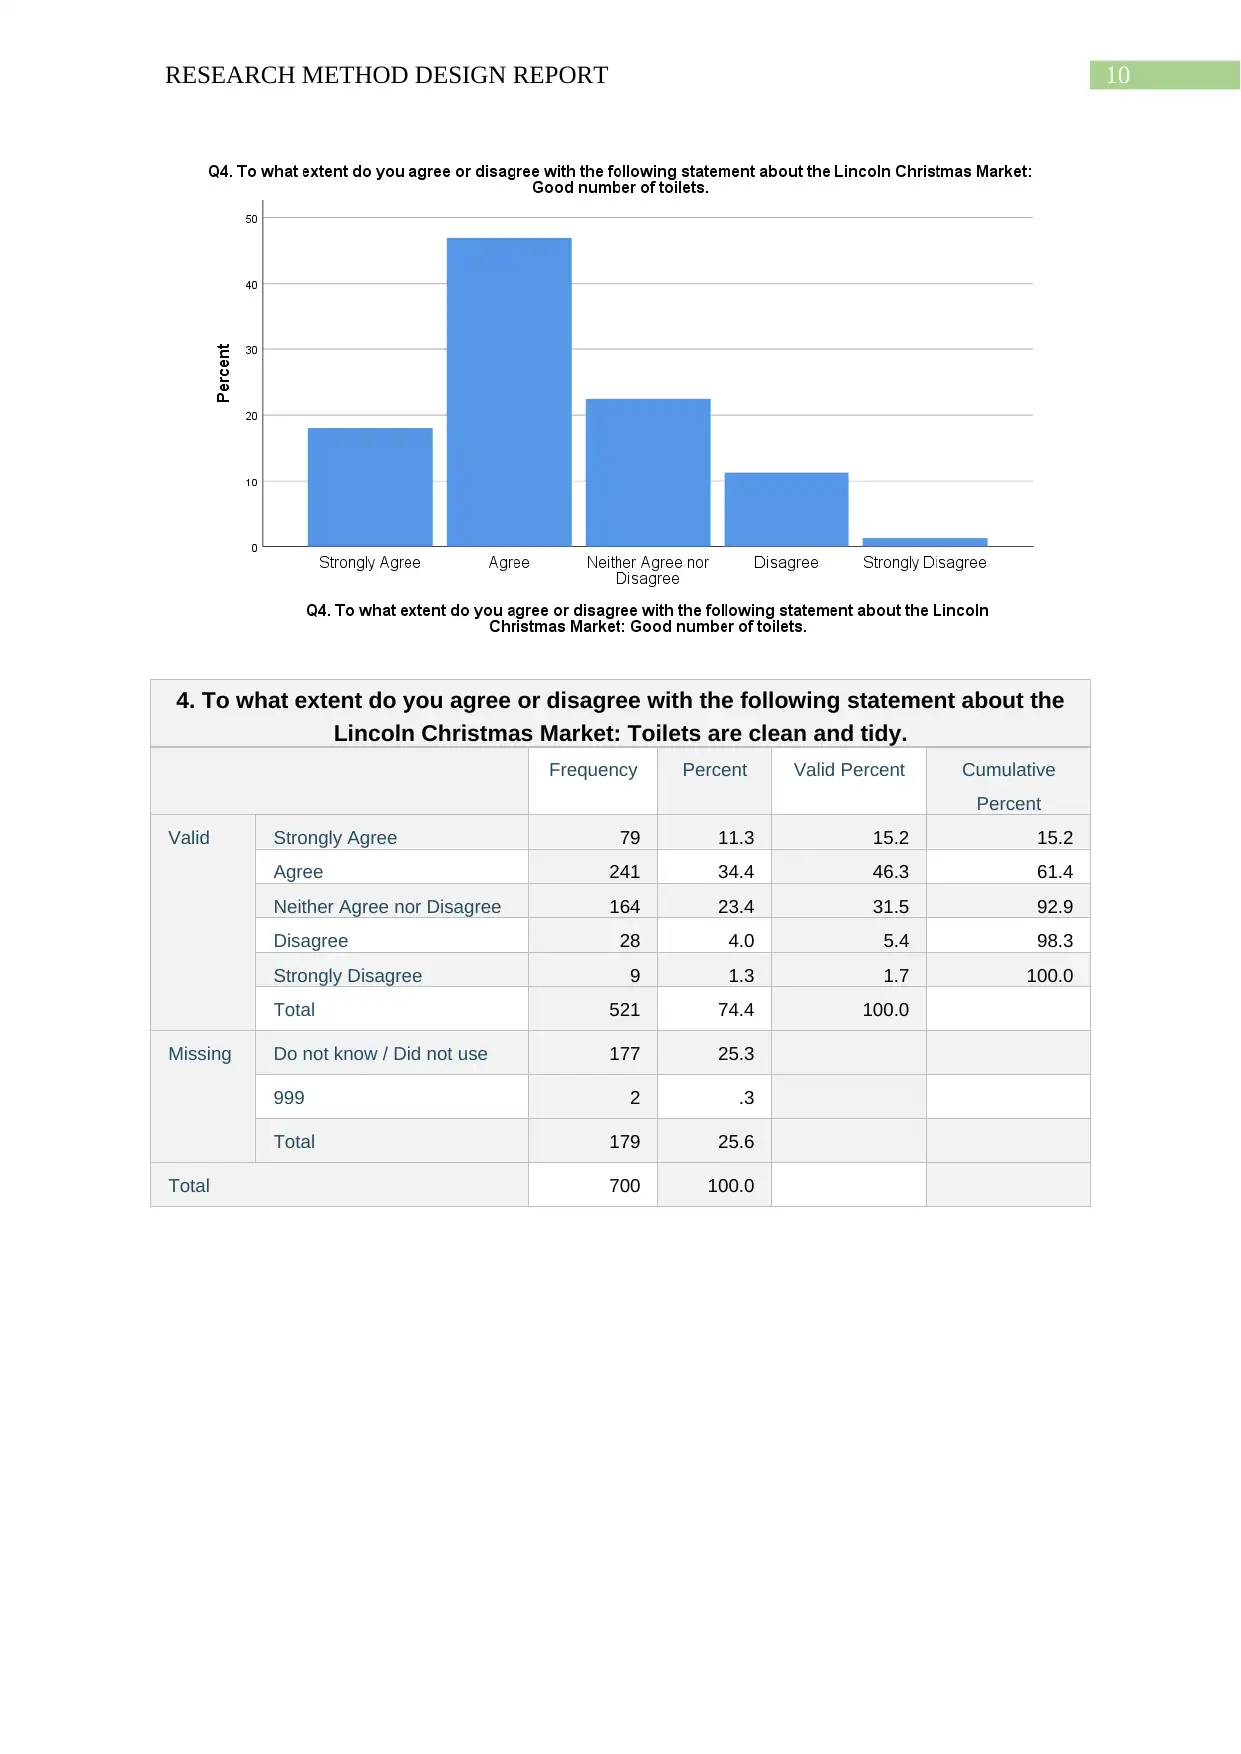
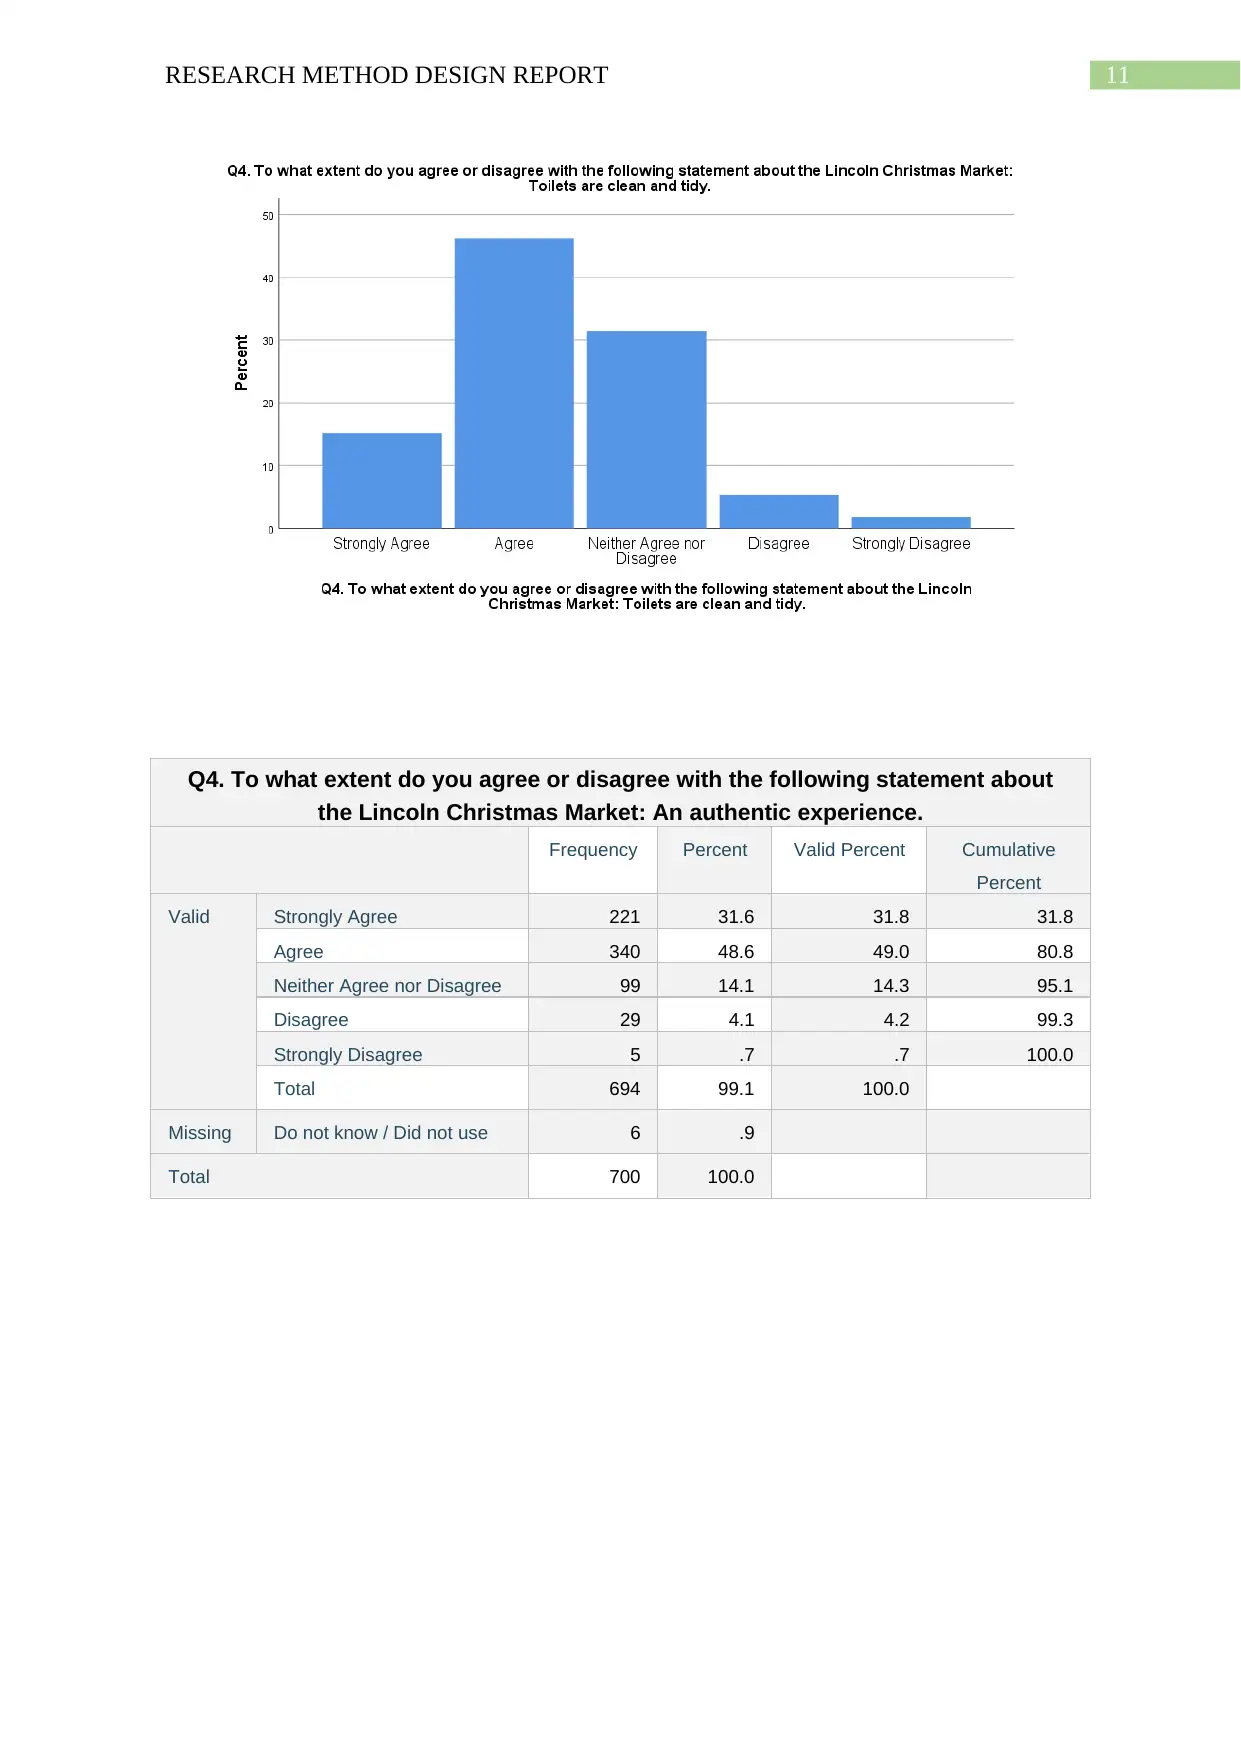
This research method design report details a survey conducted at the Lincoln Christmas Market, aiming to gather both qualitative and quantitative data from visitors. The questionnaire, designed with nominal, ordinal, and ratio scales, included multiple-choice, Likert scale, and open-ended questions to capture diverse consumer experiences. Data was collected over four days from 704 respondents and analyzed using SPSS, employing descriptive statistics, frequency tables, cross-tabulation, and chi-square tests to understand sample composition and satisfaction levels. The analysis revealed a predominantly female demographic, diverse age groups, and varied household incomes among attendees. The report also evaluates visitor satisfaction with aspects such as signage, toilets, atmosphere, and the quality of stalls. Statistical analysis included skewness and kurtosis evaluations to ensure data normality, offering insights into consumer perceptions and the market's appeal to a broad audience.

Running head: RESEARCH METHOD DESIGN REPORT
Research method design report
Name of the student
Name of the university
Author note
Research method design report
Name of the student
Name of the university
Author note
Paraphrase This Document
Need a fresh take? Get an instant paraphrase of this document with our AI Paraphraser

1RESEARCH METHOD DESIGN REPORT
1. Evaluation of questionnaire design
The survey questionnaire has been designed based to derive both qualitative and
quantitative response from the participants. The questionnaire consists of questions generated
on nominal scale, ordinal scale and ratio scale. There are certain questions that are multiple
choice questions, questions on satisfaction is based on Five point Likert scale and there are
few questions that are open ended which provides the perspective of different experiences of
the consumers in Christmas Market. The questionnaire is fully structured and has been
designed to address each and every aspect of sample composition and their satisfaction level
regarding the event.
This survey questionnaire was send to the visitors in the Lincoln Christmas market
where survey was conducted over the four days and response was collected from 704
respondents. Interview was conducted in the busiest part of the market so that in depth
answers on the research topic can be derived. The data collected has been analysed using
SPSS where statistical tools and techniques have been used to analyse the data. The research
has used descriptive statistics and frequency tables to understand the sample composition in
the research. Cross tabulation and chi square test has been conducted to understand the
degree of association among the variables. The average expenditure of the consumers have
been analysed by evaluating the mean of each of the areas such as food, drinks,
accommodation, shopping and entertainment. The research has used simple random sampling
to randomly collect data from all the respondents.
2. Analysis of the survey data
2.1 Analysis of the sample composition
Q13. Gender?
Frequency Percent Valid Percent Cumulative Percent
Valid Male 240 34.3 34.7 34.7
Female 452 64.6 65.3 100.0
Total 692 98.9 100.0
Missing 999 8 1.1
Total 700 100.0

2RESEARCH METHOD DESIGN REPORT
The evaluation of the gender has presented the fact that majority of the population are
female which is twice the number of male respondents. This means that women are more
likely to attend Christmas Market in Lincoln.
Q14. Age?
Frequency Percent Valid Percent Cumulative
Percent
Valid 22 years or less 134 19.1 19.5 19.5
23-35 years 117 16.7 17.1 36.6
36-50 years 187 26.7 27.3 63.8
51-64 years 151 21.6 22.0 85.9
65 years and over 97 13.9 14.1 100.0
Total 686 98.0 100.0
Missing 999 14 2.0
Total 700 100.0
⊘ This is a preview!⊘
Do you want full access?
Subscribe today to unlock all pages.

Trusted by 1+ million students worldwide

3RESEARCH METHOD DESIGN REPORT
The frequency table shows that there is diversity in the participants and the majority
of the consumers are above the age group of 36. This shows that Christmas is appealing to
consumers with wider demographics.
Q15. Household Income (per annum)
Frequency Percent Valid Percent Cumulative
Percent
Valid £0-£14,999 94 13.4 17.6 17.6
£15,000-£25,999 142 20.3 26.6 44.3
£26,000-£44,999 170 24.3 31.9 76.2
£45,000-£59,999 60 8.6 11.3 87.4
£60,000-£79,999 39 5.6 7.3 94.7
£80,000 plus 28 4.0 5.3 100.0
Total 533 76.1 100.0
Missing 999 167 23.9
Total 700 100.0
Paraphrase This Document
Need a fresh take? Get an instant paraphrase of this document with our AI Paraphraser

4RESEARCH METHOD DESIGN REPORT
The data on annual income of the participants show that people from diverse
background have diverse disposable income are attending the festival which depicts that the
Christmas market is considered as destinations for holidays where diversified population
visits and enjoy the festive ambience.
Q16. Could you please indicate your ethnicity?
Frequency Percent Valid Percent Cumulative
Percent
Valid White 622 88.9 90.1 90.1
Gypsy or Traveller 3 .4 .4 90.6
Black or Black British -
Caribean
2 .3 .3 90.9
Black or Black British -
African
14 2.0 2.0 92.9
Other Black background 4 .6 .6 93.5
Asian or Asian British -
Indian
5 .7 .7 94.2
Asian or Asian British -
Pakistani
4 .6 .6 94.8
Other Asian background 5 .7 .7 95.5
Mixed - White and Black
Caribean
5 .7 .7 96.2
Mixed - White and Black
African
5 .7 .7 97.0
Mixed - White and Asian 1 .1 .1 97.1
Other Mixed background 1 .1 .1 97.2
Arab 2 .3 .3 97.5
Other Ethnic background 2 .3 .3 97.8

5RESEARCH METHOD DESIGN REPORT
Chinese 7 1.0 1.0 98.8
Prefer not to say 2 .3 .3 99.1
18 6 .9 .9 100.0
Total 690 98.6 100.0
Missing 999 10 1.4
Total 700 100.0
The analysis of the ethnicity of the participants show that majority of respondents are
white. This fact is quite surprising as United Kingdom consists of a highly diversified
population but the festival is not that popular among population of other ethnic backgrounds.
Descriptive Statistics
N Minimum Maximu
m
Mean Std.
Deviation
Varianc
e
Statistic Statistic Statistic Statistic Statistic Statistic
Q13. Gender? 692 1 2 1.65 .476 .227
Q14. Age? 686 1 5 2.94 1.318 1.737
Q15. Household Income
(per annum)
533 1 6 2.80 1.346 1.812
⊘ This is a preview!⊘
Do you want full access?
Subscribe today to unlock all pages.

Trusted by 1+ million students worldwide

6RESEARCH METHOD DESIGN REPORT
Q16. Could you please
indicate your ethnicity?
690 1 18 1.82 2.963 8.778
Valid N (listwise) 525
Descriptive Statistics
Skewness Kurtosis
Statistic Std. Error Statistic Std. Error
Q13. Gender? -.645 .093 -1.588 .186
Q14. Age? -.034 .093 -1.096 .186
Q15. Household Income (per annum) .638 .106 -.107 .211
Q16. Could you please indicate your
ethnicity?
4.049 .093 16.139 .186
Valid N (listwise)
The analysis of the skewness and Kurtosis of the above table shows that the values are
within the acceptable range and the data follows a normal distribution.
2.2 Analysis of the satisfaction level
Q4. To what extent do you agree or disagree with the following statement about
the Lincoln Christmas Market: Welcoming.
Frequency Percent Valid Percent Cumulative
Percent
Valid Strongly Agree 236 33.7 33.8 33.8
Agree 397 56.7 56.9 90.7
Neither Agree nor Disagree 48 6.9 6.9 97.6
Disagree 16 2.3 2.3 99.9
Strongly Disagree 1 .1 .1 100.0
Total 698 99.7 100.0
Missing Do not know / Did not use 2 .3
Total 700 100.0
Paraphrase This Document
Need a fresh take? Get an instant paraphrase of this document with our AI Paraphraser

7RESEARCH METHOD DESIGN REPORT
Q4. To what extent do you agree or disagree with the
following statement about the Lincoln Christmas Market:
Signage is visible.
Frequency Percent Valid
Percent
Cumulative
Percent
Valid Strongly
Agree
154 22.0 22.2 22.2
Agree 360 51.4 51.8 74.0
Neither
Agree
nor
Disagree
94 13.4 13.5 87.5
Disagree 82 11.7 11.8 99.3
Strongly
Disagree
5 .7 .7 100.0
Total 695 99.3 100.0
Missing Do not
know /
Did not
use
5 .7
Total 700 100.0

8RESEARCH METHOD DESIGN REPORT
Q4. To what extent do you agree or disagree with the following statement about
the Lincoln Christmas Market: Signage is informative.
Frequency Percent Valid Percent Cumulative
Percent
Valid Strongly Agree 148 21.1 22.2 22.2
Agree 364 52.0 54.5 76.6
Neither Agree nor Disagree 97 13.9 14.5 91.2
Disagree 53 7.6 7.9 99.1
Strongly Disagree 6 .9 .9 100.0
Total 668 95.4 100.0
Missing Do not know / Did not use 32 4.6
Total 700 100.0
⊘ This is a preview!⊘
Do you want full access?
Subscribe today to unlock all pages.

Trusted by 1+ million students worldwide

9RESEARCH METHOD DESIGN REPORT
Q4. To what extent do you agree or disagree with the following statement about
the Lincoln Christmas Market: Good number of toilets.
Frequency Percent Valid Percent Cumulative
Percent
Valid Strongly Agree 115 16.4 18.1 18.1
Agree 299 42.7 46.9 65.0
Neither Agree nor Disagree 143 20.4 22.4 87.4
Disagree 72 10.3 11.3 98.7
Strongly Disagree 8 1.1 1.3 100.0
Total 637 91.0 100.0
Missing Do not know / Did not use 63 9.0
Total 700 100.0
Paraphrase This Document
Need a fresh take? Get an instant paraphrase of this document with our AI Paraphraser

10RESEARCH METHOD DESIGN REPORT
4. To what extent do you agree or disagree with the following statement about the
Lincoln Christmas Market: Toilets are clean and tidy.
Frequency Percent Valid Percent Cumulative
Percent
Valid Strongly Agree 79 11.3 15.2 15.2
Agree 241 34.4 46.3 61.4
Neither Agree nor Disagree 164 23.4 31.5 92.9
Disagree 28 4.0 5.4 98.3
Strongly Disagree 9 1.3 1.7 100.0
Total 521 74.4 100.0
Missing Do not know / Did not use 177 25.3
999 2 .3
Total 179 25.6
Total 700 100.0

11RESEARCH METHOD DESIGN REPORT
Q4. To what extent do you agree or disagree with the following statement about
the Lincoln Christmas Market: An authentic experience.
Frequency Percent Valid Percent Cumulative
Percent
Valid Strongly Agree 221 31.6 31.8 31.8
Agree 340 48.6 49.0 80.8
Neither Agree nor Disagree 99 14.1 14.3 95.1
Disagree 29 4.1 4.2 99.3
Strongly Disagree 5 .7 .7 100.0
Total 694 99.1 100.0
Missing Do not know / Did not use 6 .9
Total 700 100.0
⊘ This is a preview!⊘
Do you want full access?
Subscribe today to unlock all pages.

Trusted by 1+ million students worldwide
1 out of 34
Related Documents

Your All-in-One AI-Powered Toolkit for Academic Success.
 +13062052269
info@desklib.com
Available 24*7 on WhatsApp / Email
Unlock your academic potential
Copyright © 2020–2025 A2Z Services. All Rights Reserved. Developed and managed by ZUCOL.