Comprehensive Financial Ratio Analysis and Business Performance Report

Verified

Added on  2022/12/28

|8
|1265
|25
Report
AI Summary
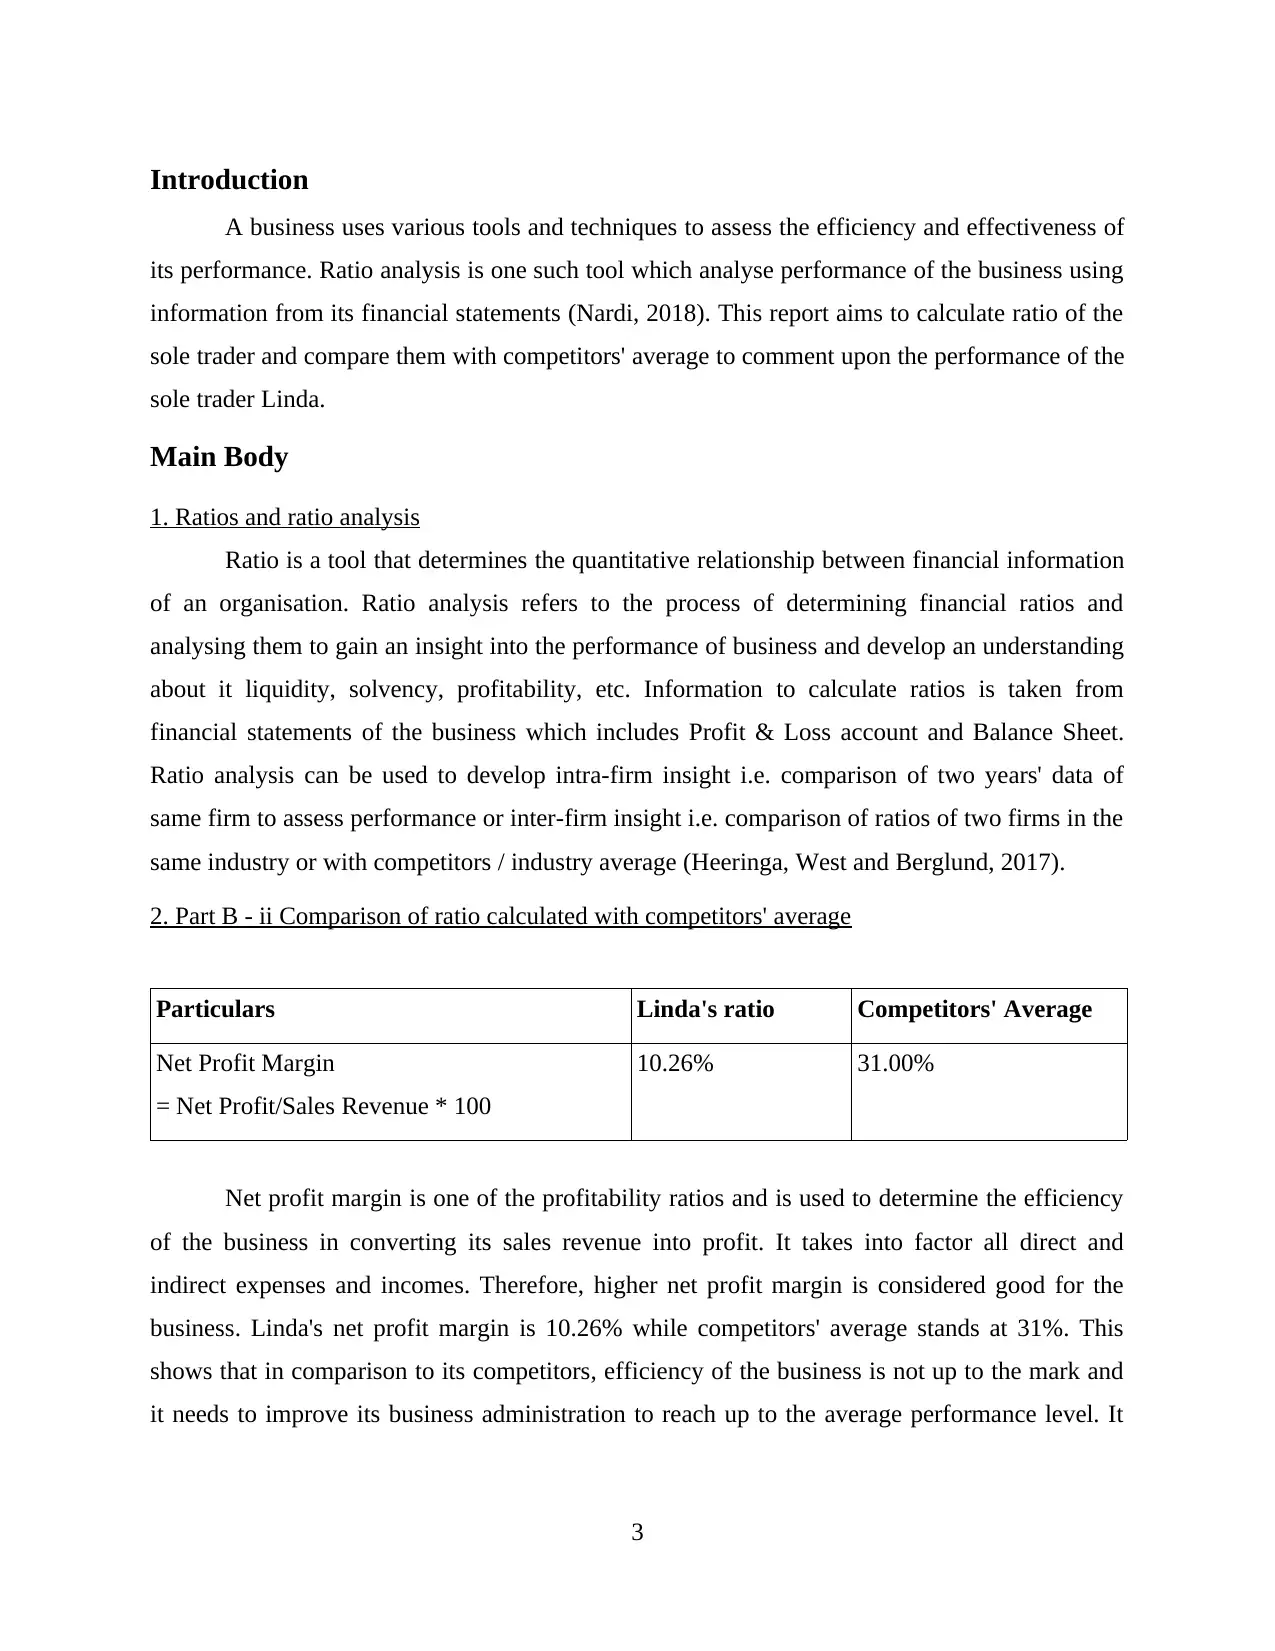
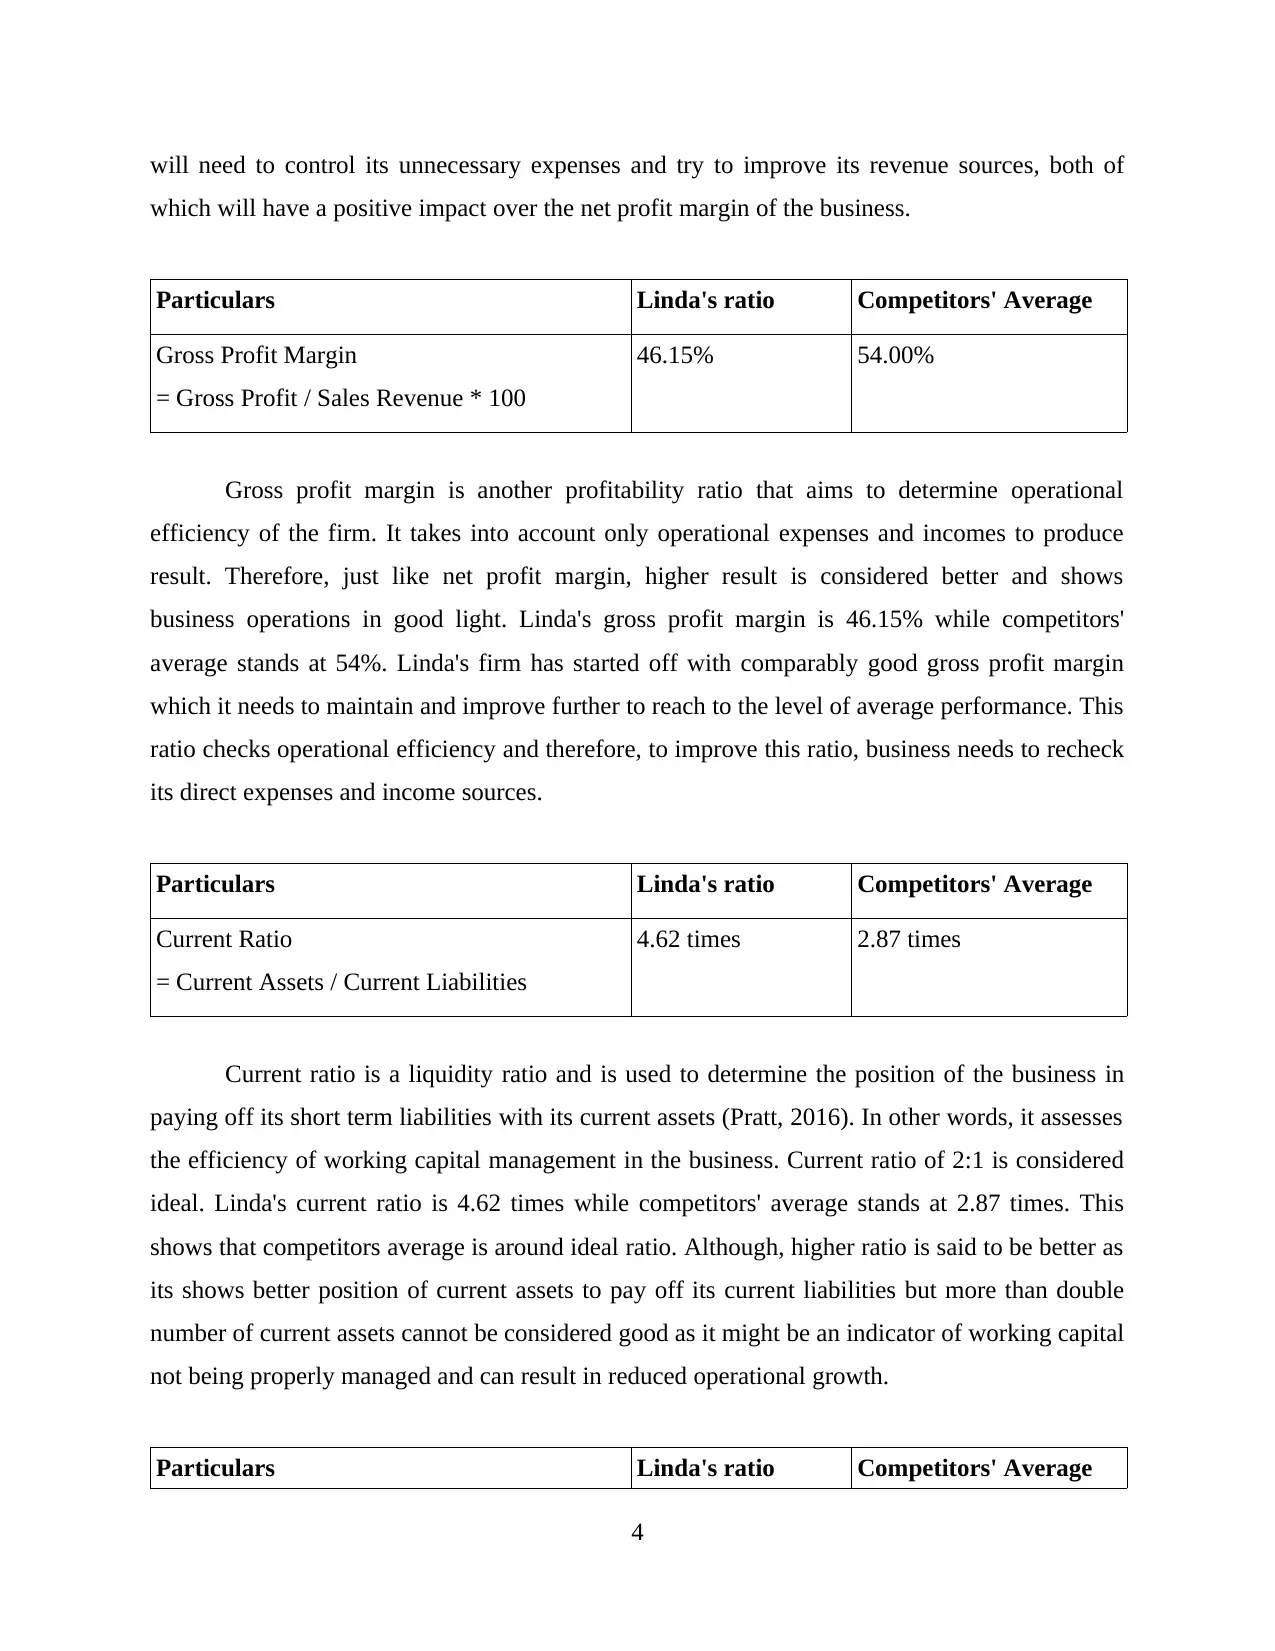
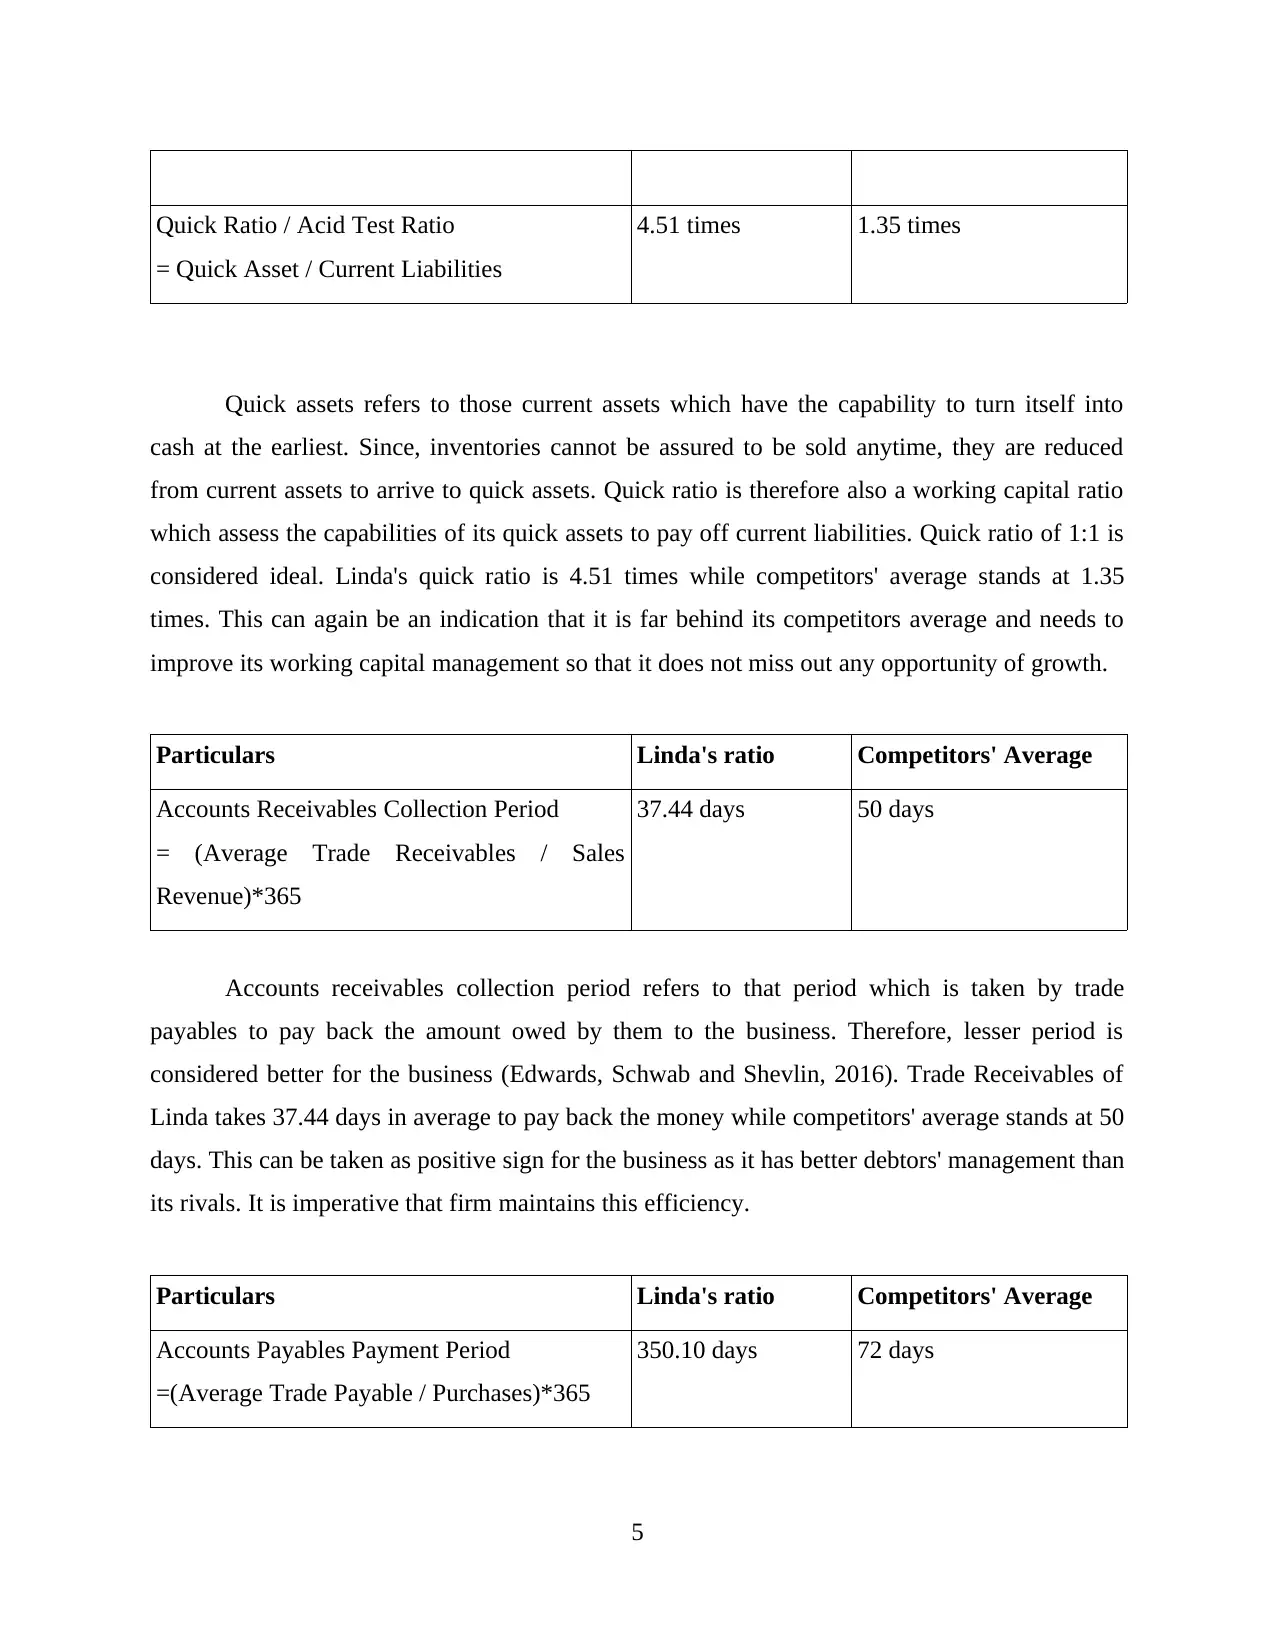
This report presents a financial ratio analysis of a sole trader named Linda, comparing her business's performance against industry averages. The analysis includes the calculation and interpretation of key financial ratios such as net profit margin, gross profit margin, current ratio, quick ratio, accounts receivables collection period, and accounts payables payment period. The report highlights Linda's strengths and weaknesses by comparing her ratios to those of her competitors. The findings indicate areas where Linda's business excels, such as accounts receivable management, and areas where improvement is needed, particularly in profitability ratios. The report concludes that ratio analysis is a valuable tool for assessing business performance, providing insights into liquidity, solvency, and profitability, and facilitating comparisons with competitors.
Document Page
Recording Business
Transaction
1
tabler-icon-diamond-filled.svg

Paraphrase This Document

Need a fresh take? Get an instant paraphrase of this document with our AI Paraphraser
Document Page
Table of Contents
Introduction......................................................................................................................................3
Main Body.......................................................................................................................................3
1. Ratio analysis..........................................................................................................................3
2. Part B - ii Comparison of ratio calculated with competitors' average.....................................3
Conclusion.......................................................................................................................................5
References........................................................................................................................................6
2
Document Page
Introduction
A business uses various tools and techniques to assess the efficiency and effectiveness of
its performance. Ratio analysis is one such tool which analyse performance of the business using
information from its financial statements (Nardi, 2018). This report aims to calculate ratio of the
sole trader and compare them with competitors' average to comment upon the performance of the
sole trader Linda.
Main Body
1. Ratios and ratio analysis
Ratio is a tool that determines the quantitative relationship between financial information
of an organisation. Ratio analysis refers to the process of determining financial ratios and
analysing them to gain an insight into the performance of business and develop an understanding
about it liquidity, solvency, profitability, etc. Information to calculate ratios is taken from
financial statements of the business which includes Profit & Loss account and Balance Sheet.
Ratio analysis can be used to develop intra-firm insight i.e. comparison of two years' data of
same firm to assess performance or inter-firm insight i.e. comparison of ratios of two firms in the
same industry or with competitors / industry average (Heeringa, West and Berglund, 2017).
2. Part B - ii Comparison of ratio calculated with competitors' average
Particulars Linda's ratio Competitors' Average
Net Profit Margin
= Net Profit/Sales Revenue * 100
10.26% 31.00%
Net profit margin is one of the profitability ratios and is used to determine the efficiency
of the business in converting its sales revenue into profit. It takes into factor all direct and
indirect expenses and incomes. Therefore, higher net profit margin is considered good for the
business. Linda's net profit margin is 10.26% while competitors' average stands at 31%. This
shows that in comparison to its competitors, efficiency of the business is not up to the mark and
it needs to improve its business administration to reach up to the average performance level. It
3
Document Page
will need to control its unnecessary expenses and try to improve its revenue sources, both of
which will have a positive impact over the net profit margin of the business.
Particulars Linda's ratio Competitors' Average
Gross Profit Margin
= Gross Profit / Sales Revenue * 100
46.15% 54.00%
Gross profit margin is another profitability ratio that aims to determine operational
efficiency of the firm. It takes into account only operational expenses and incomes to produce
result. Therefore, just like net profit margin, higher result is considered better and shows
business operations in good light. Linda's gross profit margin is 46.15% while competitors'
average stands at 54%. Linda's firm has started off with comparably good gross profit margin
which it needs to maintain and improve further to reach to the level of average performance. This
ratio checks operational efficiency and therefore, to improve this ratio, business needs to recheck
its direct expenses and income sources.
Particulars Linda's ratio Competitors' Average
Current Ratio
= Current Assets / Current Liabilities
4.62 times 2.87 times
Current ratio is a liquidity ratio and is used to determine the position of the business in
paying off its short term liabilities with its current assets (Pratt, 2016). In other words, it assesses
the efficiency of working capital management in the business. Current ratio of 2:1 is considered
ideal. Linda's current ratio is 4.62 times while competitors' average stands at 2.87 times. This
shows that competitors average is around ideal ratio. Although, higher ratio is said to be better as
its shows better position of current assets to pay off its current liabilities but more than double
number of current assets cannot be considered good as it might be an indicator of working capital
not being properly managed and can result in reduced operational growth.
Particulars Linda's ratio Competitors' Average
4
tabler-icon-diamond-filled.svg

Paraphrase This Document

Need a fresh take? Get an instant paraphrase of this document with our AI Paraphraser
Document Page
Quick Ratio / Acid Test Ratio
= Quick Asset / Current Liabilities
4.51 times 1.35 times
Quick assets refers to those current assets which have the capability to turn itself into
cash at the earliest. Since, inventories cannot be assured to be sold anytime, they are reduced
from current assets to arrive to quick assets. Quick ratio is therefore also a working capital ratio
which assess the capabilities of its quick assets to pay off current liabilities. Quick ratio of 1:1 is
considered ideal. Linda's quick ratio is 4.51 times while competitors' average stands at 1.35
times. This can again be an indication that it is far behind its competitors average and needs to
improve its working capital management so that it does not miss out any opportunity of growth.
Particulars Linda's ratio Competitors' Average
Accounts Receivables Collection Period
= (Average Trade Receivables / Sales
Revenue)*365
37.44 days 50 days
Accounts receivables collection period refers to that period which is taken by trade
payables to pay back the amount owed by them to the business. Therefore, lesser period is
considered better for the business (Edwards, Schwab and Shevlin, 2016). Trade Receivables of
Linda takes 37.44 days in average to pay back the money while competitors' average stands at 50
days. This can be taken as positive sign for the business as it has better debtors' management than
its rivals. It is imperative that firm maintains this efficiency.
Particulars Linda's ratio Competitors' Average
Accounts Payables Payment Period
=(Average Trade Payable / Purchases)*365
350.10 days 72 days
5
Document Page
Accounts payables payment period refers to that period which is taken by business to pay
off its creditors. Therefore, higher the period is, better it is considered for the business as this
means that business is able to keep the money with it for the longer period of time. Trade
payables of Linda takes 350.10 days in average to receive back the money from Linda's firm
while competitors' average stands at 72 days. Linda is better at management of its creditors also
and should focus on keeping the same momentum.
Conclusion
Above report deduces that ratio analysis is an effective measure to determine
effectiveness of business performance and to gain an insight into its liquidity, solvency and
profitability. It is also useful to compare performance of business with its competitors and
industry average.
6
Document Page
References
Books and Journal
Edwards, A., Schwab, C. and Shevlin, T., 2016. Financial constraints and cash tax savings. The
Accounting Review, 91(3), pp.859-881.
Heeringa, S.G., West, B.T. and Berglund, P.A., 2017. Applied survey data analysis. CRC press.
Nardi, P.M., 2018. Doing survey research: A guide to quantitative methods. Routledge.
Pratt, J., 2016. Financial accounting in an economic context. John Wiley & Sons.
7
tabler-icon-diamond-filled.svg

Paraphrase This Document

Need a fresh take? Get an instant paraphrase of this document with our AI Paraphraser
Document Page
8
chevron_up_icon
1 out of 8
circle_padding
hide_on_mobile
zoom_out_icon
[object Object]