Economic and Quantitative Analysis: Linear Regression Report Analysis

Verified

Added on  2022/08/11

|10
|1661
|24
Report
AI Summary
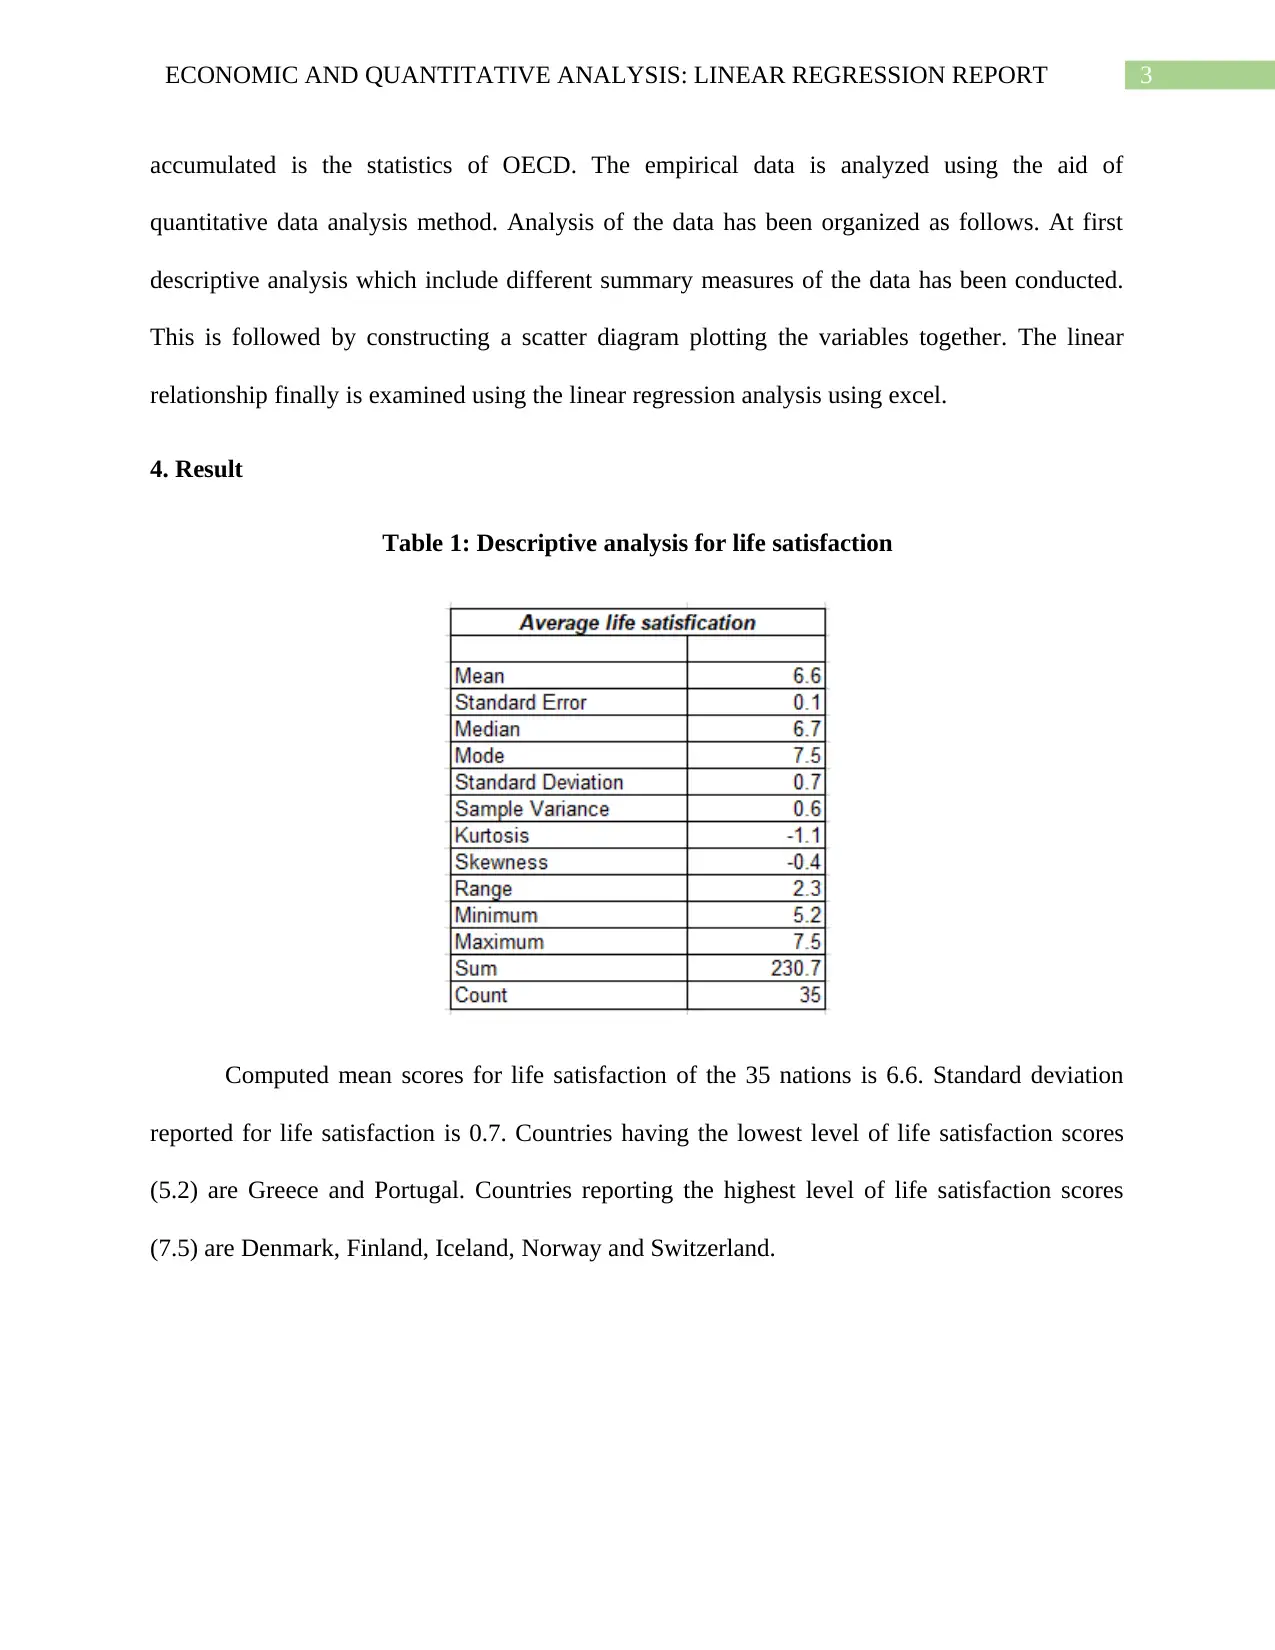
This report examines the statistical association between average life satisfaction and GDP per capita. The report begins with an introduction and background, discussing the ongoing debate regarding the relationship between life satisfaction and income, referencing Easterlin's work and cross-sectional studies. The methodology section details the use of cross-sectional data from OECD statistics, including descriptive analysis, scatter plots, and linear regression analysis using Excel. The results section presents descriptive statistics for life satisfaction and GDP per capita, including mean, standard deviation, and extreme values for different countries. It includes a scatter plot illustrating the positive linear trend. Regression output, including the slope coefficient, p-value, and R-squared, is provided, followed by an analysis after excluding outliers. The discussion evaluates the statistical results, concluding a positive relationship between the variables and highlighting limitations such as the sample size and the focus on income as the sole influencing factor. Finally, the report makes policy recommendations, suggesting that countries should focus on increasing GDP, employment opportunities, and overall quality of life to enhance life satisfaction.
Document Page
Running head: ECONOMIC AND QUANTITATIVE ANALYSIS: LINEAR REGRESSION
REPORT
Economic and Quantitative Analysis: Linear Regression Report
Name of the University
Name of the Student
Author note
tabler-icon-diamond-filled.svg

Secure Best Marks with AI Grader

Need help grading? Try our AI Grader for instant feedback on your assignments.
Document Page
1ECONOMIC AND QUANTITATIVE ANALYSIS: LINEAR REGRESSION REPORT
Table of Contents
1.Purpose.........................................................................................................................................2
2. Background..................................................................................................................................2
3. Method.........................................................................................................................................2
5. Discussion....................................................................................................................................7
6. Recommendation.........................................................................................................................8
List of References............................................................................................................................9
Document Page
2ECONOMIC AND QUANTITATIVE ANALYSIS: LINEAR REGRESSION REPORT
1.Purpose
The report is designed to conduct a brief analysis to establish a relation of average life
satisfaction to that of annual per capita GDP. Purpose is to build a linear relation between the
two using simple technique of linear regression.
2. Background
There is an ongoing debate among researchers, policymakers and scientists regarding the
relation of life satisfaction with aggregate income. In this regard, the study of Easterling is often
considered as the starting point of the debate (Kaiser and Vendrik 2019). Easterlin in his paper
used the time series data of USA and confirmed that for the period ranged from 1974 to 2005
income though doubled in USA however there was no appreciation of life satisfaction. As
against this some cross sectional studies showed affirmative view on the dependence of life
satisfaction on aggregate income (Altindag and Xu 2017). One literature by Proto and Rustichini
(2013) stated that life satisfaction increased undoubtedly with an upturn movement of GDP per
capita below USD 15000. After the mentioned threshold limit, the income effect on satisfaction
however becomes flat (Proto and Rustichini 2013). Because of the implication in policy
formulation researchers from different field are interested to revisit the actual relation.
3. Method
The paper deals with empirical data on two indicators such as life satisfaction and GDPs
per capita (annual). The type of data used for the analysis is cross section data which are
collected across different units at a given time. The different cross section units here are different
countries. Life satisfaction scores and per capita GDP are reported for 35 different countries
selected as sample. The sample size therefore is 35. The source from where data has been
Document Page
3ECONOMIC AND QUANTITATIVE ANALYSIS: LINEAR REGRESSION REPORT
accumulated is the statistics of OECD. The empirical data is analyzed using the aid of
quantitative data analysis method. Analysis of the data has been organized as follows. At first
descriptive analysis which include different summary measures of the data has been conducted.
This is followed by constructing a scatter diagram plotting the variables together. The linear
relationship finally is examined using the linear regression analysis using excel.
4. Result
Table 1: Descriptive analysis for life satisfaction
Computed mean scores for life satisfaction of the 35 nations is 6.6. Standard deviation
reported for life satisfaction is 0.7. Countries having the lowest level of life satisfaction scores
(5.2) are Greece and Portugal. Countries reporting the highest level of life satisfaction scores
(7.5) are Denmark, Finland, Iceland, Norway and Switzerland.
tabler-icon-diamond-filled.svg

Secure Best Marks with AI Grader

Need help grading? Try our AI Grader for instant feedback on your assignments.
Document Page
4ECONOMIC AND QUANTITATIVE ANALYSIS: LINEAR REGRESSION REPORT
Table 2: Descriptive analysis for per capita GDP
For the 35 countries the mean per capita GDP is figured out as $39011.51. Measured
standard deviation for reported series of per capita GDP is 14006.21. Country having the lowest
GDPs per capita ($17122.53) is Luxemberg. Country having the highest GDPs per capita
($86788.14) is Mexico.
Chart 1: Scatter plot for life satisfaction and GDP per capita
Document Page
5ECONOMIC AND QUANTITATIVE ANALYSIS: LINEAR REGRESSION REPORT
For examining how life satisfaction scores varies with GDP per capita, the scatter plot
measures GDP per capita which is the independent variable on the horizontal axis. The vertical
axis measures life satisfaction which is the dependent variable. As shown in the scatter graph,
life satisfaction scores have generally been found to increase with GDP per capita constituting a
positive linear trend relation between the plotted variables.
A regression equation helps to forecast dependent variable associated with a value given
for the independent variable. The dependent variable here is life satisfaction. The independent
variable is GDP per capita. The average life satisfaction scored needs to be regressed on annual
per capita GDP to get the required regression equation. The following regression equation is
required to predict average life satisfaction scores based on the value of per capita GDP.
Y =α+ βX
The predicted variable is denoted as Y. X denotes the explanatory variable of the model.
α is the intercept term of the equation and β is the slope coefficient.
Table 3: Regression output
^Life satisfaction=5.3652+( 0.00003143× GDP per capita)
Document Page
6ECONOMIC AND QUANTITATIVE ANALYSIS: LINEAR REGRESSION REPORT
Slope coefficient in a regression equation stands to measure change in regressed variable
with an associated change in the explanatory variable in the model (Robertson and McCloskey
2019). Estimated slope coefficient is 0.3143. Given the estimated slope, life satisfaction score is
predicted to be improved by an approximate 0.31 point in association with 1-unit increase in
GDP per capita.
Association as obtained from regression estimation is statistically significant of the slope
coefficient associated with the explanatory variable is statistically significant. One approach to
test whether the relation is statistically significant is to apply p-value method. For per capita
GDP, estimated p value is given as 0.0002. This value is below the significance value of 0.05
associated with 5 percent significance level. This in turn suggests that regression coefficient is
statistically significant meaning the association of life satisfaction scores and GDP per capita is
significant statistically.
The decision regarding goodness of fit is based on how well the fitted model can capture
variation in the predicted variable. This is turn in captured by R square statistics. Estimated value
of R square is given as 0.35. Based on the value it is possible to say that proportion of variation
determined by the fitted model is only 35 percent. Since a significant proportion of variation is
determined outside the fitted model it is not a good fit model.
tabler-icon-diamond-filled.svg

Paraphrase This Document

Need a fresh take? Get an instant paraphrase of this document with our AI Paraphraser
Document Page
7ECONOMIC AND QUANTITATIVE ANALYSIS: LINEAR REGRESSION REPORT
Table 4: Regression output after dropping outliers
New estimated regression equation after excluding the impact of outliers is given as
^Life satisfaction=4.5558+(0.00005514 × GDP per capita)
Comparison of the newly developed model with that of old one shows that exclusion of
outlier’s value of reported GDP per capita raises slope coefficient value to 0.5514. Magnitude of
betterment in life satisfaction score with 1 percent upsurge in GDP per capita is 0.55 meaning
effect of GDPs per capita on life satisfaction deepens after excluding the outliers. In the new
model estimated value of R square increases to 0.50 meaning proportion of deviation in life
satisfaction score that is accounted by GDP per capita is now increases to almost 50 percent
(Darlington and Hayes 2016). That means betterment in the fitness of model.
5. Discussion
Evaluation of statistical result established a positive relation between the two variables.
The study therefore suggests that people in a nation realize an increase in life satisfaction given
an increase in average income as captured by per capita GDP.
Document Page
8ECONOMIC AND QUANTITATIVE ANALYSIS: LINEAR REGRESSION REPORT
The paper has used simple regression analysis technique to establish the intended relation
between satisfaction scores and GDPs per capita. The used statistical method is simple to apply
and the obtained result can be understood easily which are strength of the paper. The paper also
gives a satisfactory conclusion regarding the intended relation. Consideration of only 35
countries makes the research limited in terms of limited sample. Inclusion of only income as an
influencing factor for life satisfaction also make the research limited in this area.
Conclusion of the paper supports past literatures establishing a positive influence of
income on the life satisfaction while contradicts previous findings that considered income as an
insignificant factor while determining life satisfaction (Prasoon and Chaturvedi 2016). Since, the
paper confirms income as one significant element of life satisfaction it possesses implication for
designing policy to enhance economic welfare.
6. Recommendation
Important policy recommendation can be made drawing references from result of the
paper. Firstly, countries especially having low per capita GDP should take policies to increase
their GDP to increase average income of people which in turn would result in an increase in life
satisfaction. Secondly, increasing opportunities for employment is another way to boost income
within the nation. When more and more people employment their income increases and so is the
life satisfaction. Thirdly, besides income government should ensure a better quality of life
through access to education, good health conditions and others for increasing life satisfaction.
Document Page
9ECONOMIC AND QUANTITATIVE ANALYSIS: LINEAR REGRESSION REPORT
List of References
Altindag, D.T. and Xu, J., 2017. Life satisfaction and preferences over economic growth and
institutional quality. Journal of Labor Research, 38(1), pp.100-121.
Darlington, R.B. and Hayes, A.F., 2016. Regression analysis and linear models: Concepts,
applications, and implementation. Guilford Publications.
Kaiser, C.F. and Vendrik, M.C., 2019. Different versions of the Easterlin Paradox: New evidence
for European countries. In The Economics of Happiness (pp. 27-55). Springer, Cham.
Prasoon, R. and Chaturvedi, K.R., 2016. Life satisfaction: a literature review. The Researcher-
International Journal of Management Humanities and Social Sciences, 1(2), pp.25-32.
Proto, E. and Rustichini, A., 2013. A reassessment of the relationship between GDP and life
satisfaction. PloS one, 8(11).
Robertson, C. and McCloskey, M., 2019. Business Statistics A multimedia guide to concepts and
applications. Oxford University Press.
chevron_up_icon
1 out of 10
circle_padding
hide_on_mobile
zoom_out_icon
logo.png

Your All-in-One AI-Powered Toolkit for Academic Success.

Available 24*7 on WhatsApp / Email

[object Object]