Curve-Fitting Project: Linear Model of School Enrollment Data
VerifiedAdded on 2022/08/12
|7
|689
|11
Project
AI Summary
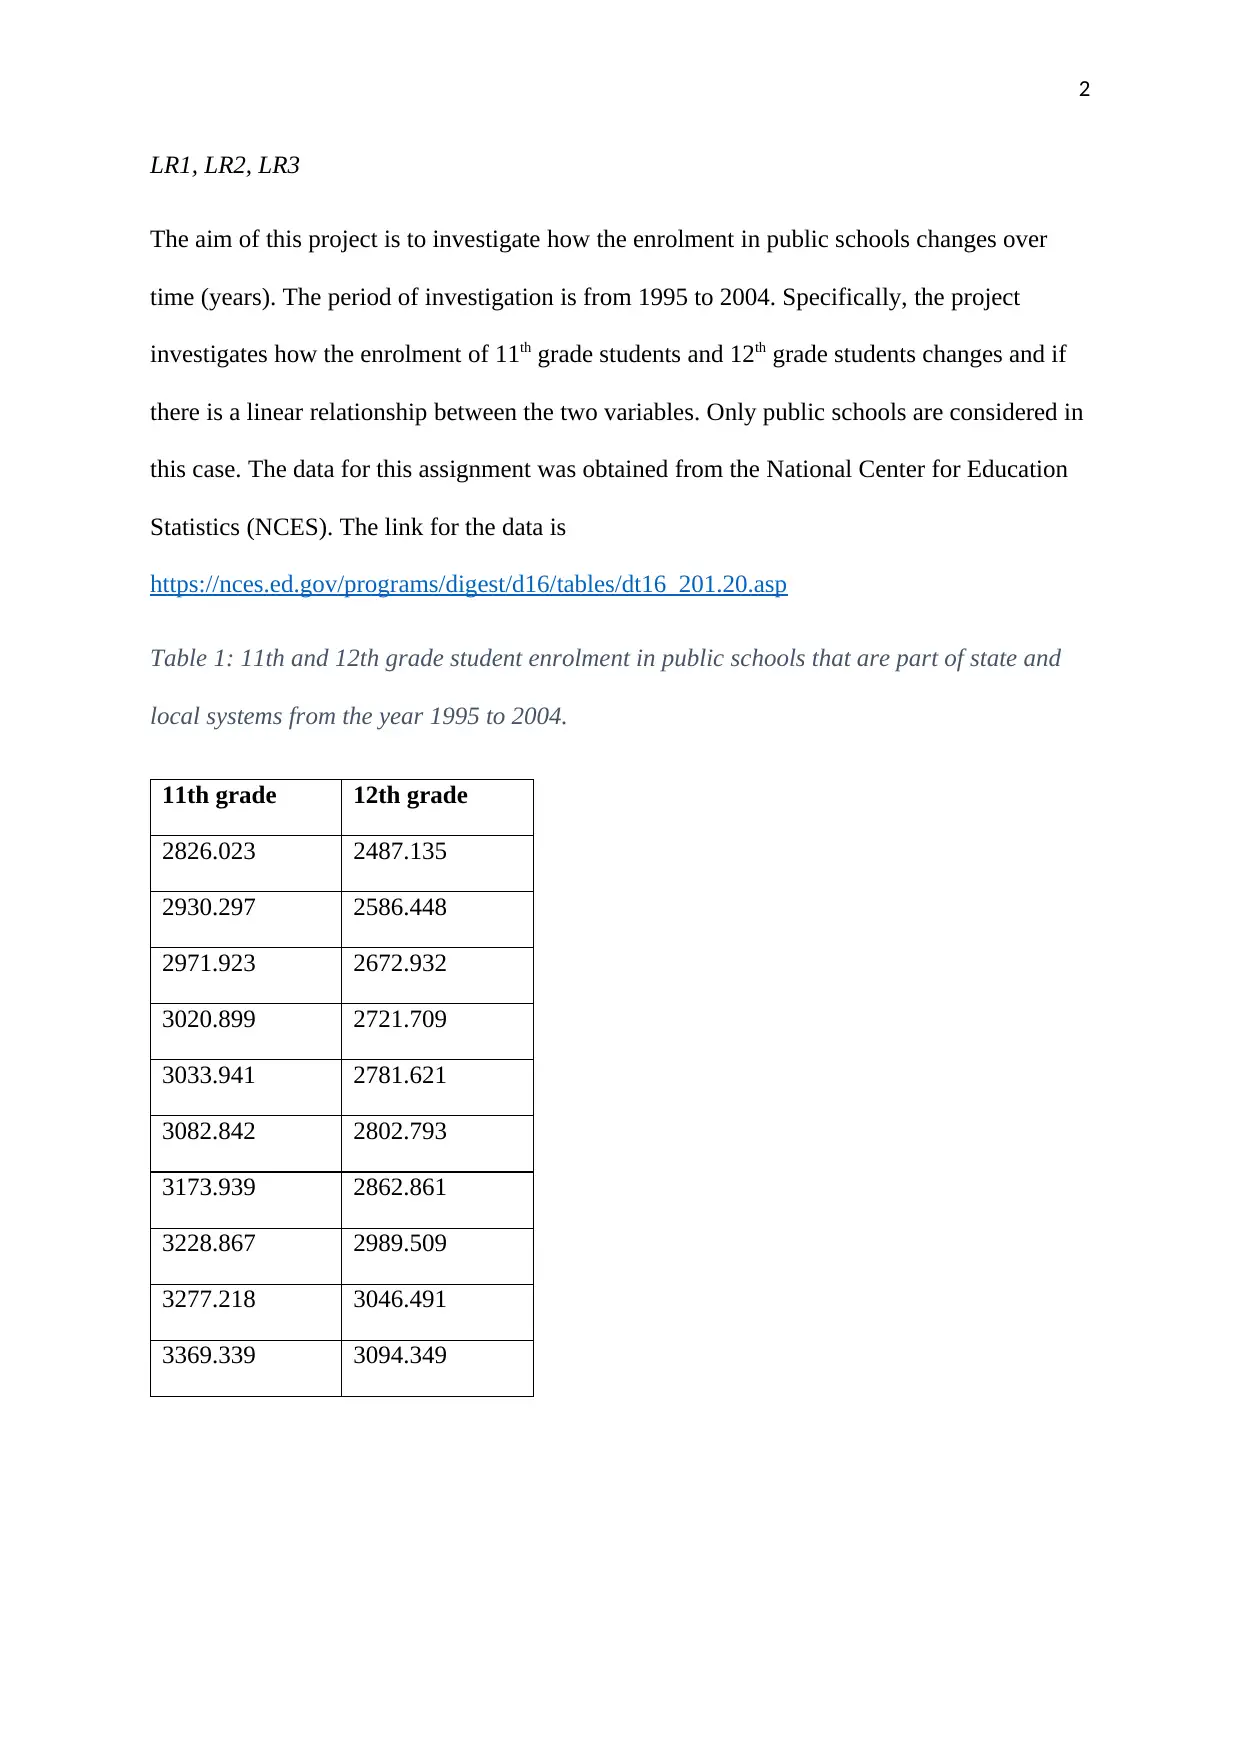
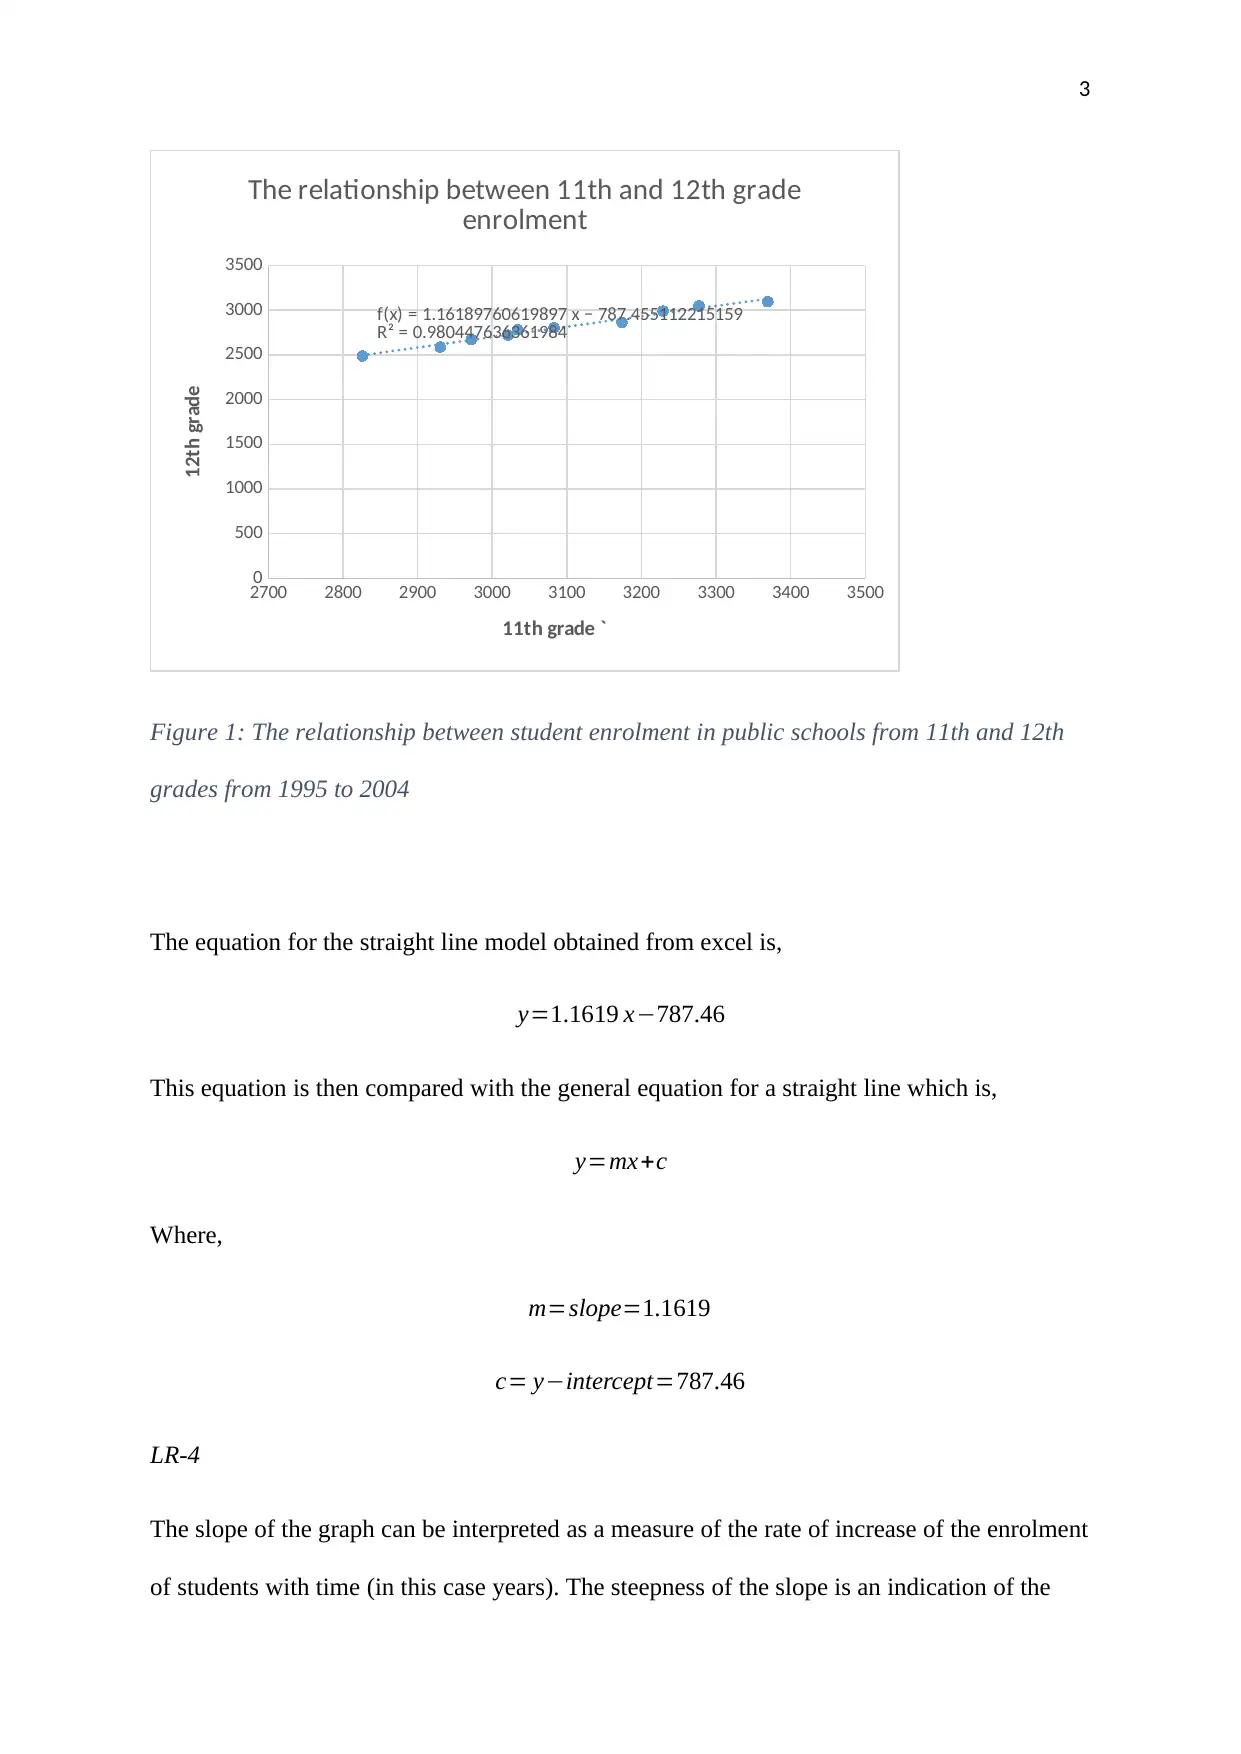
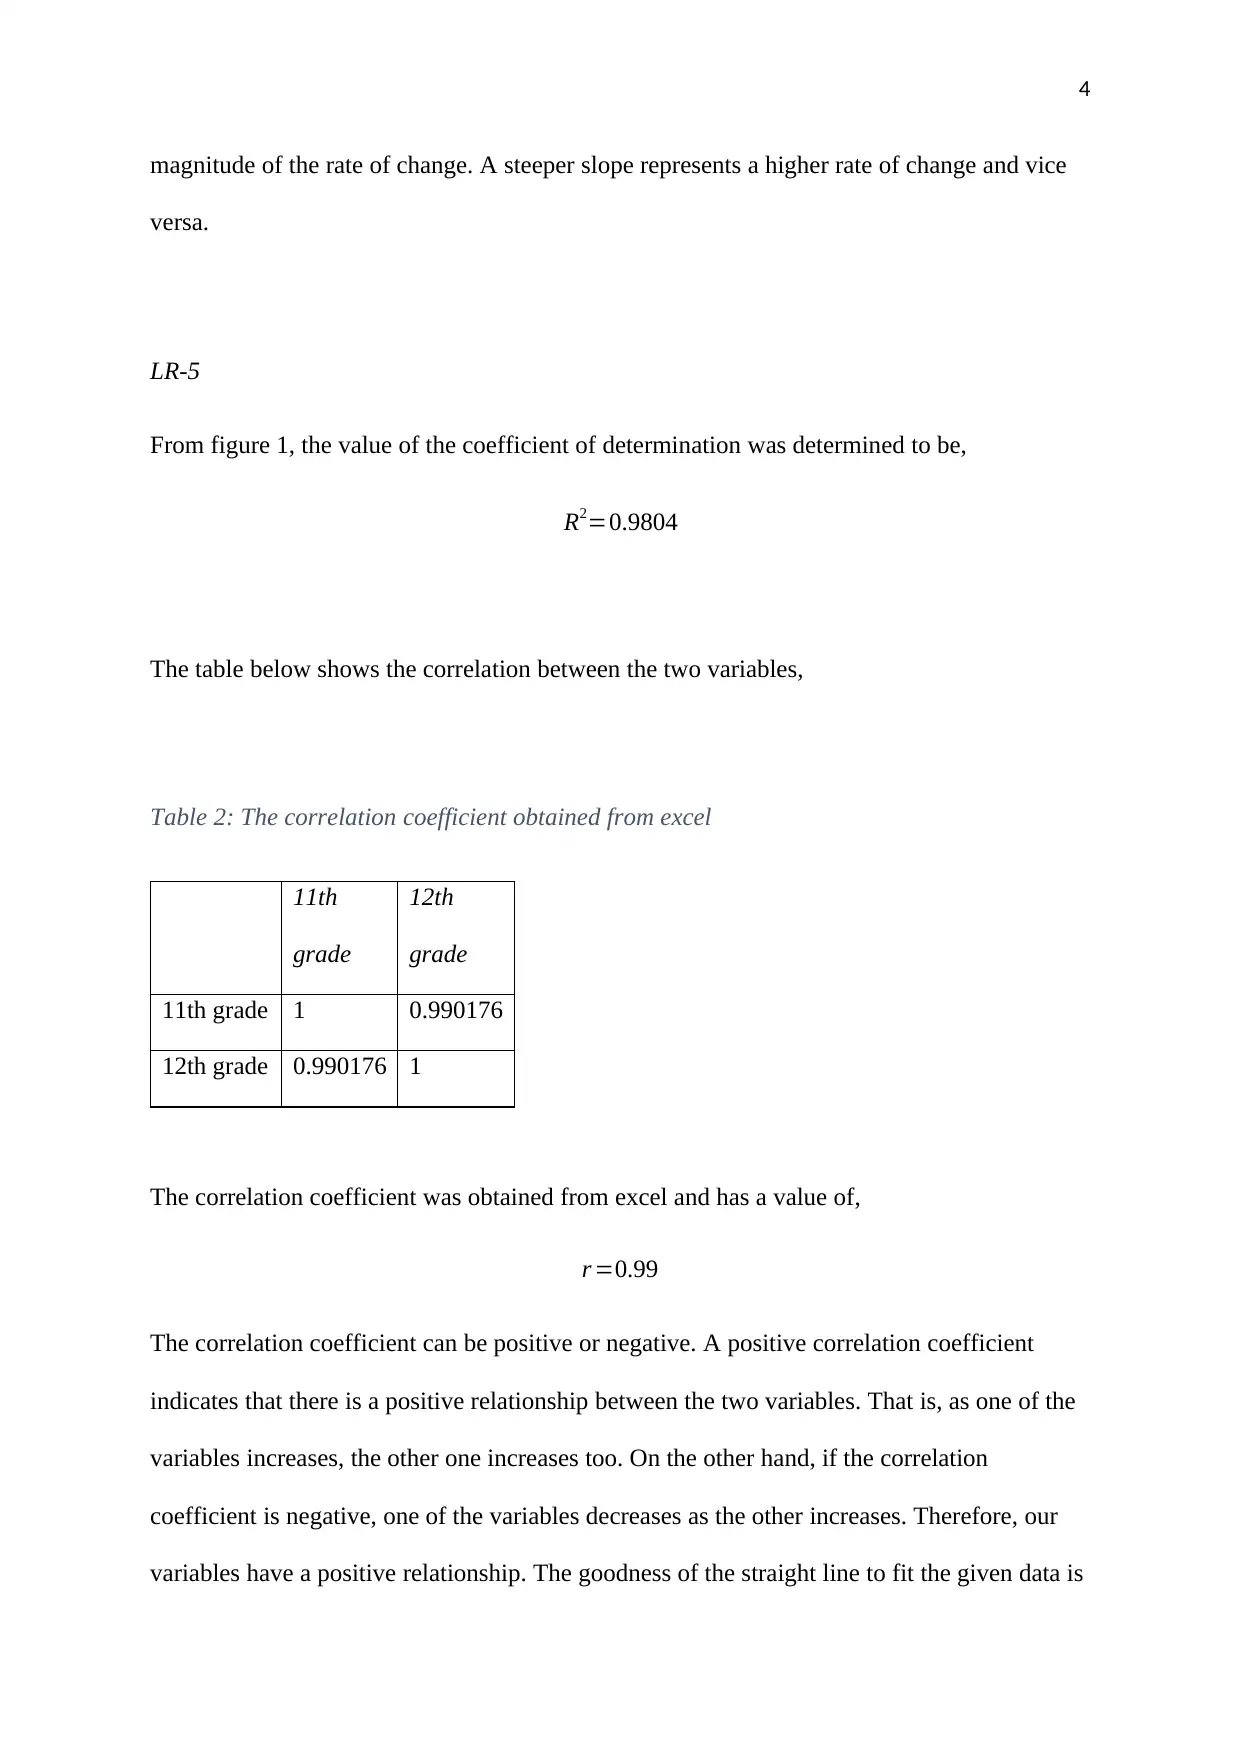
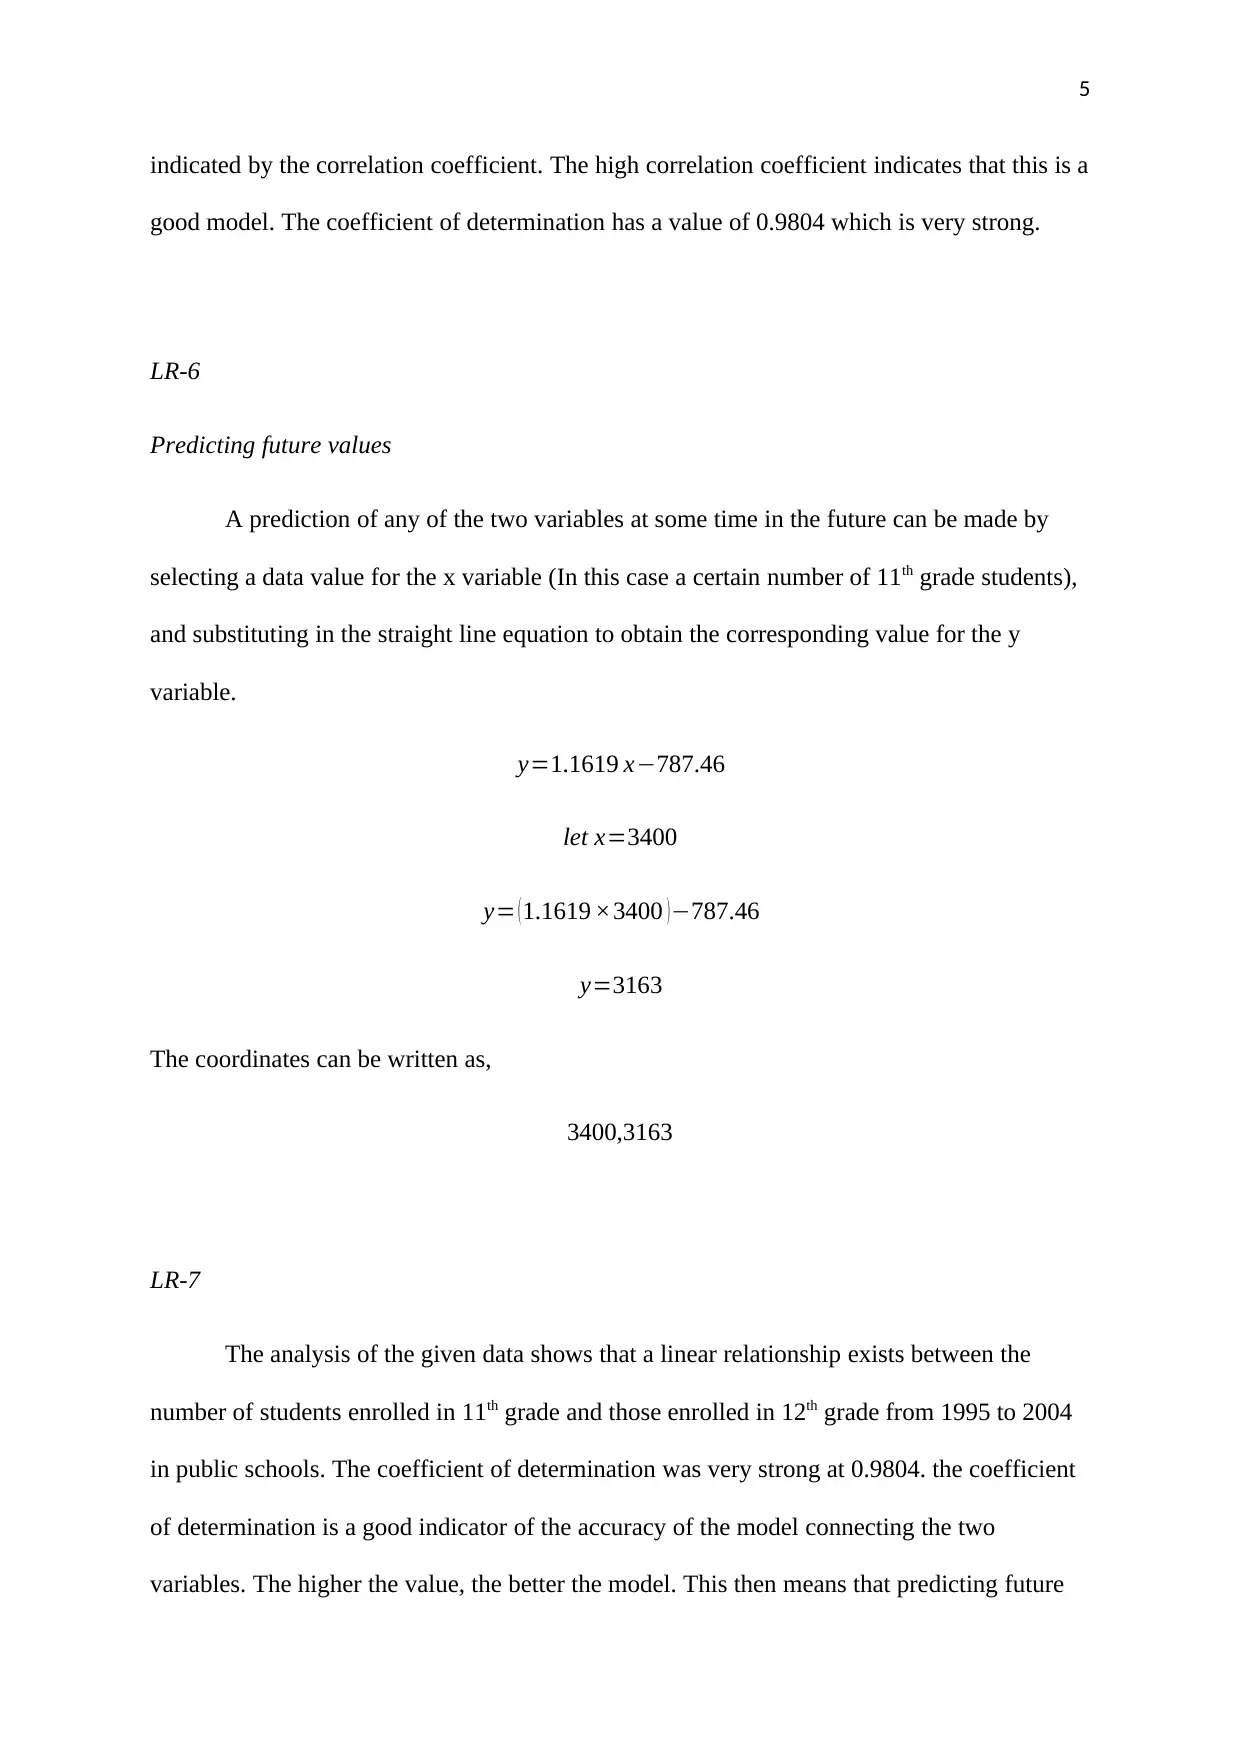
This project investigates the changes in public school enrollment over time, specifically focusing on 11th and 12th-grade student enrollment from 1995 to 2004. The analysis uses data obtained from the National Center for Education Statistics (NCES) to determine if a linear relationship exists between the two variables. The project includes a scatter plot visualizing the relationship and uses a linear equation derived from Excel to model the data. The slope of the line is interpreted as the rate of change in enrollment. The project calculates and analyzes the correlation coefficient and the coefficient of determination to assess the goodness of fit for the linear model, predicting future enrollment values. The results show a strong linear relationship, with a high correlation coefficient indicating that as 11th-grade enrollment increases, so does 12th-grade enrollment.
1 out of 7
Related Documents


Your All-in-One AI-Powered Toolkit for Academic Success.
+13062052269
info@desklib.com
Available 24*7 on WhatsApp / Email
![[object Object]](/_next/static/media/star-bottom.7253800d.svg)
Copyright © 2020–2026 A2Z Services. All Rights Reserved. Developed and managed by ZUCOL.