Project 3: Linear-Quadratic Controller and Kalman Filter

Verified

Added on  2022/09/09

|9
|605
|18
Project
AI Summary
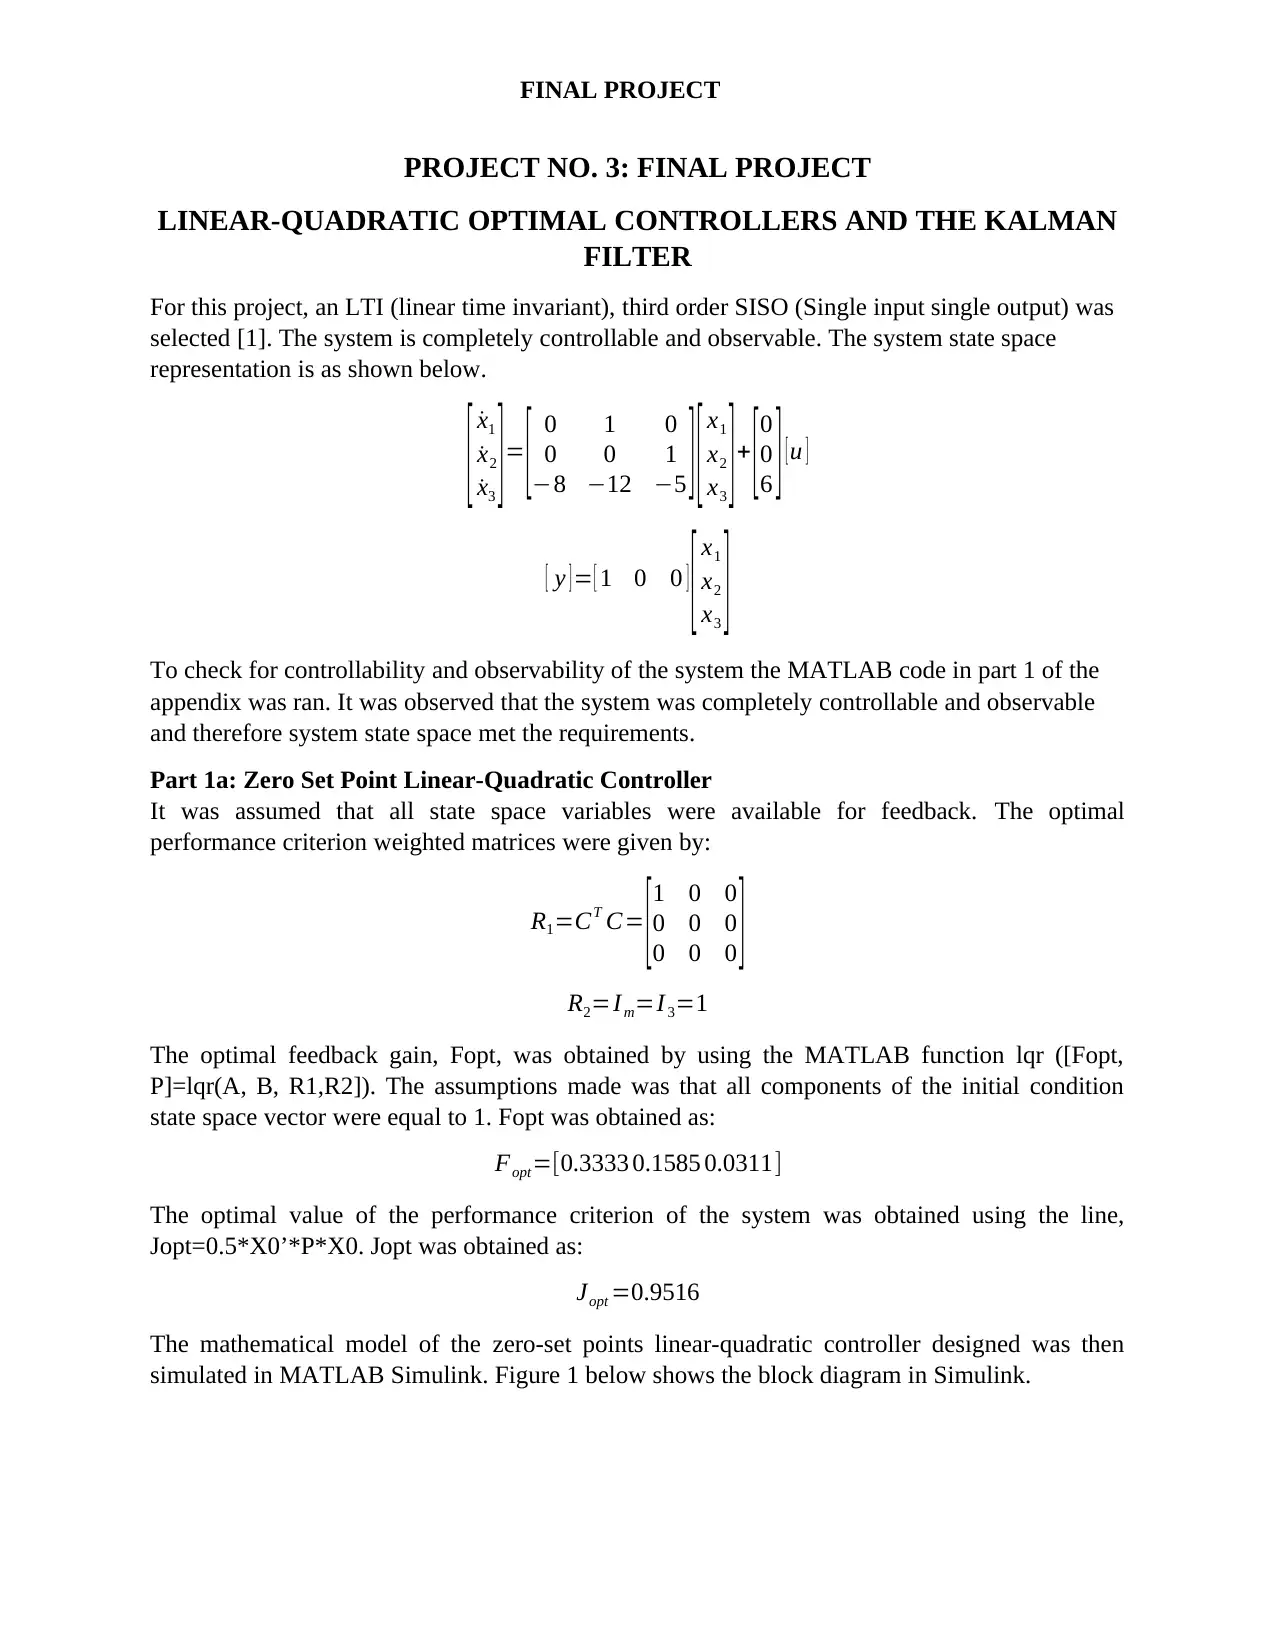
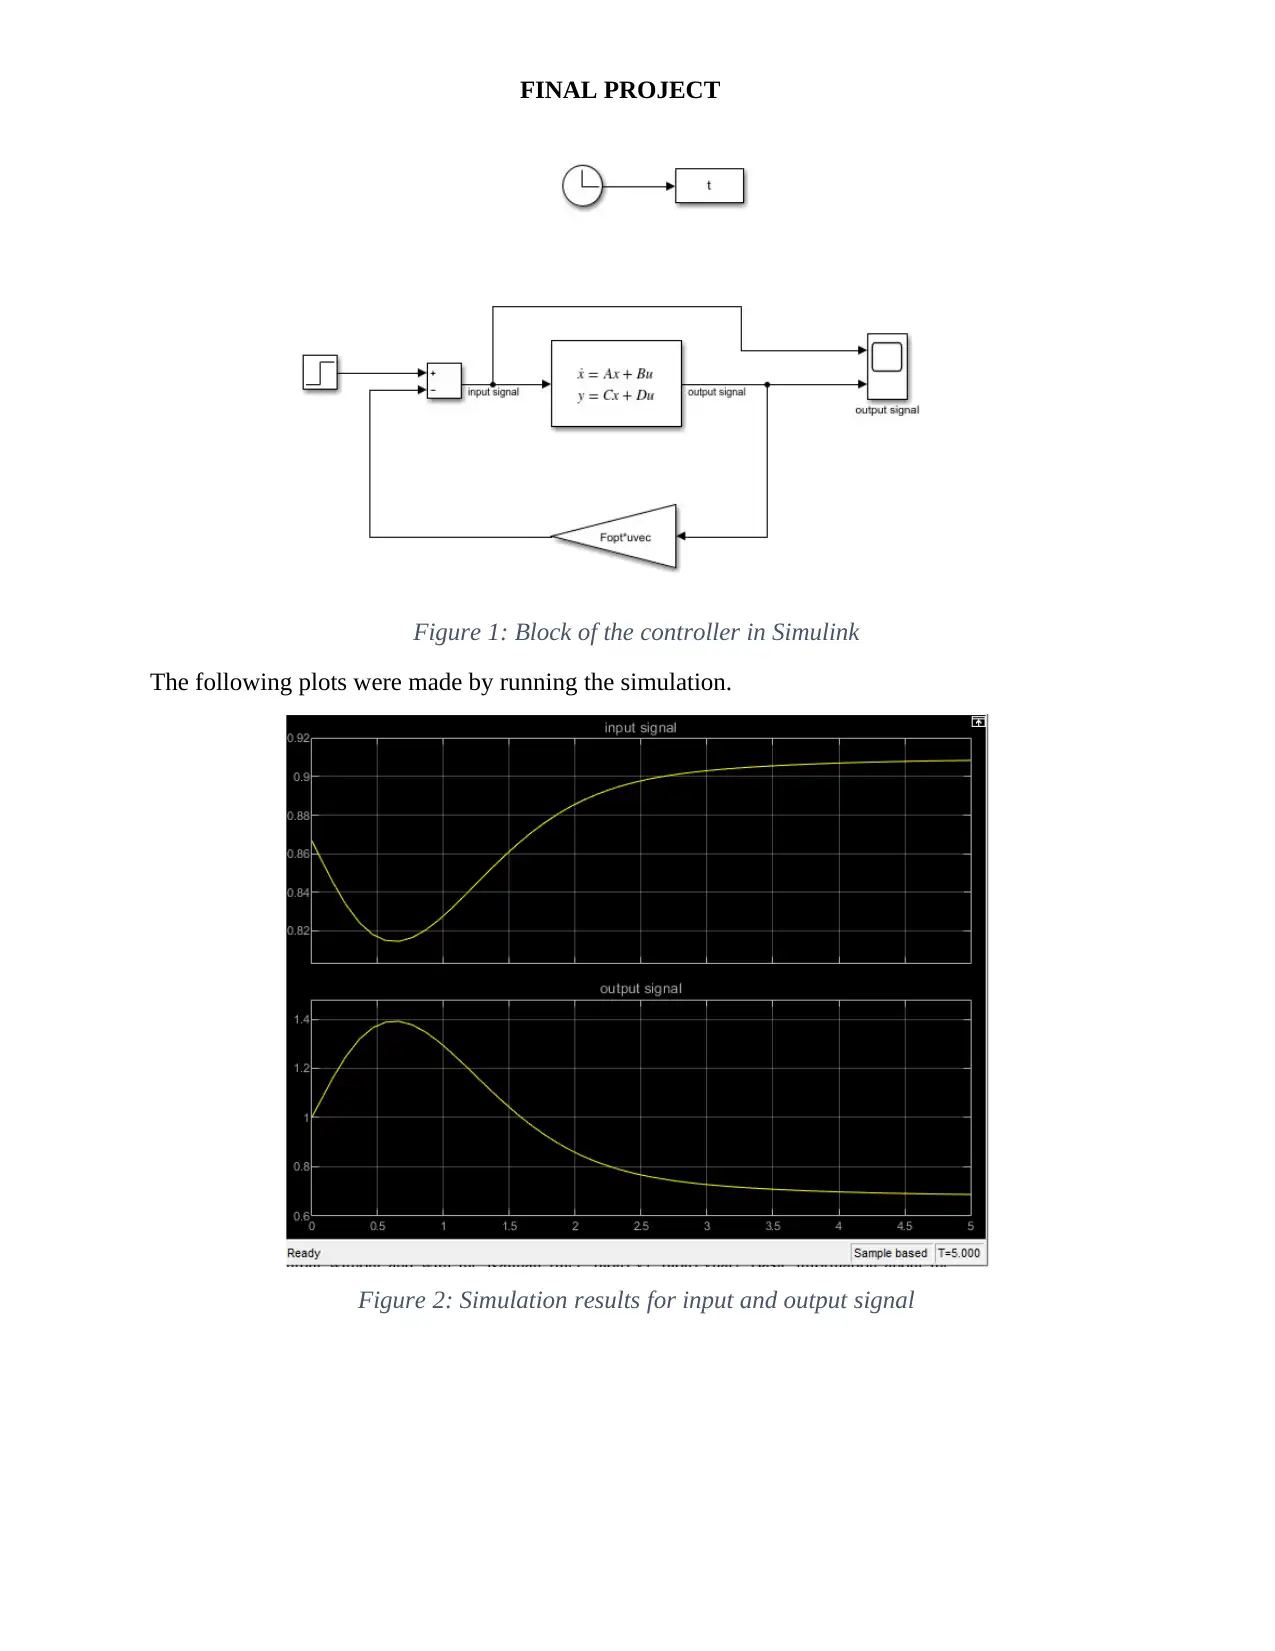
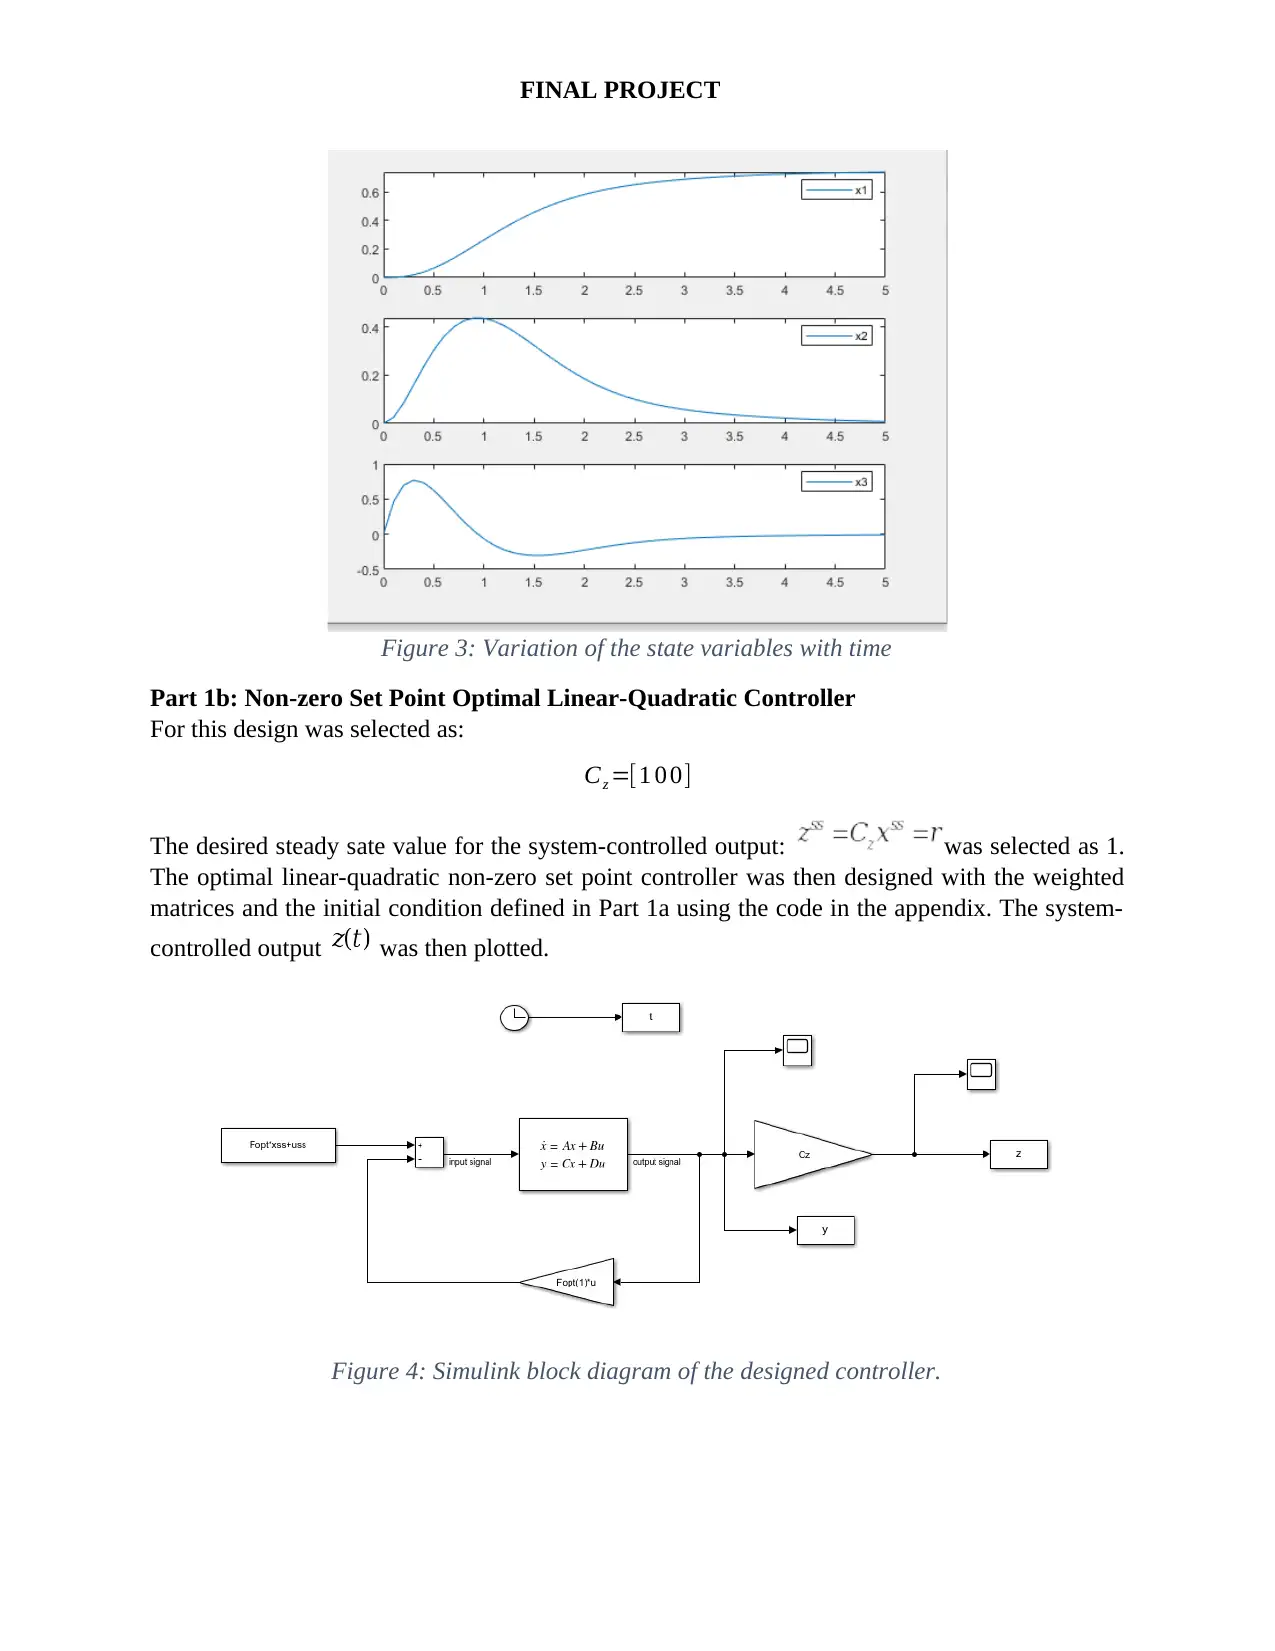
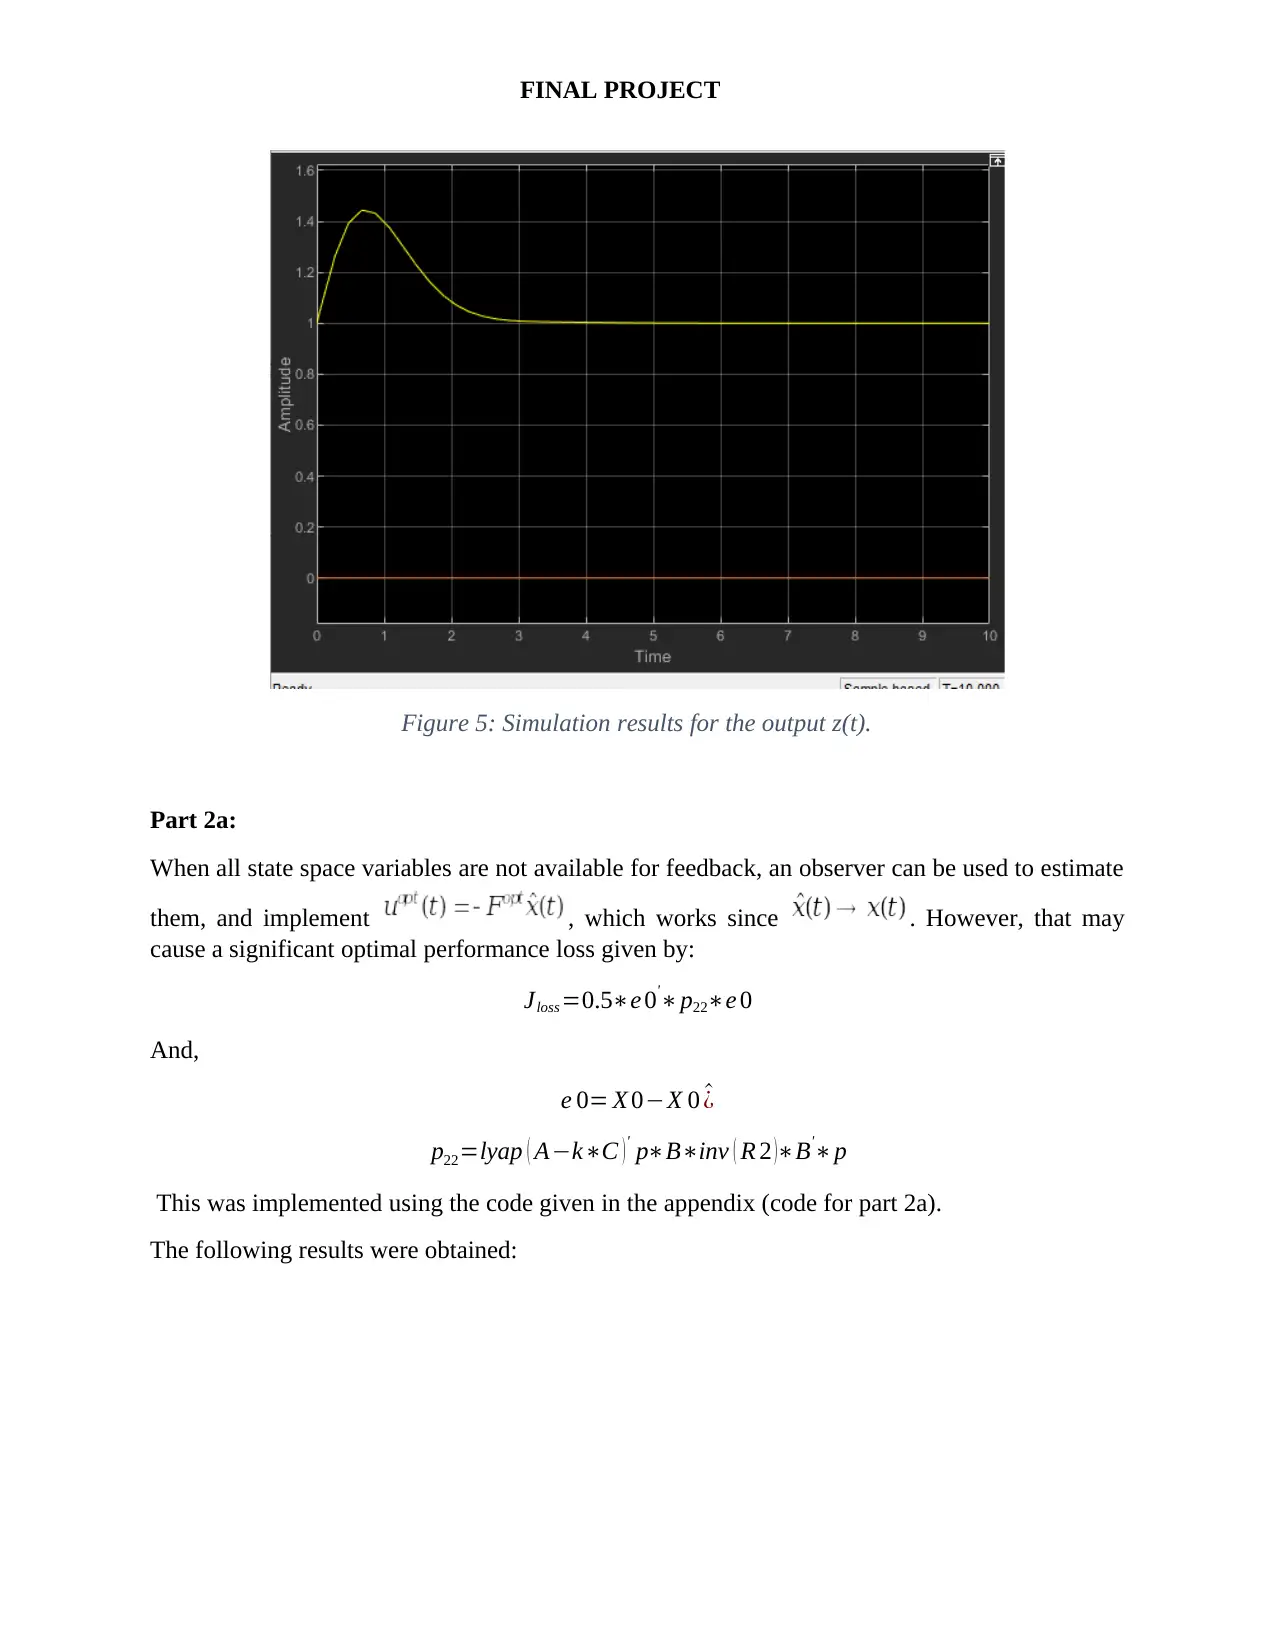
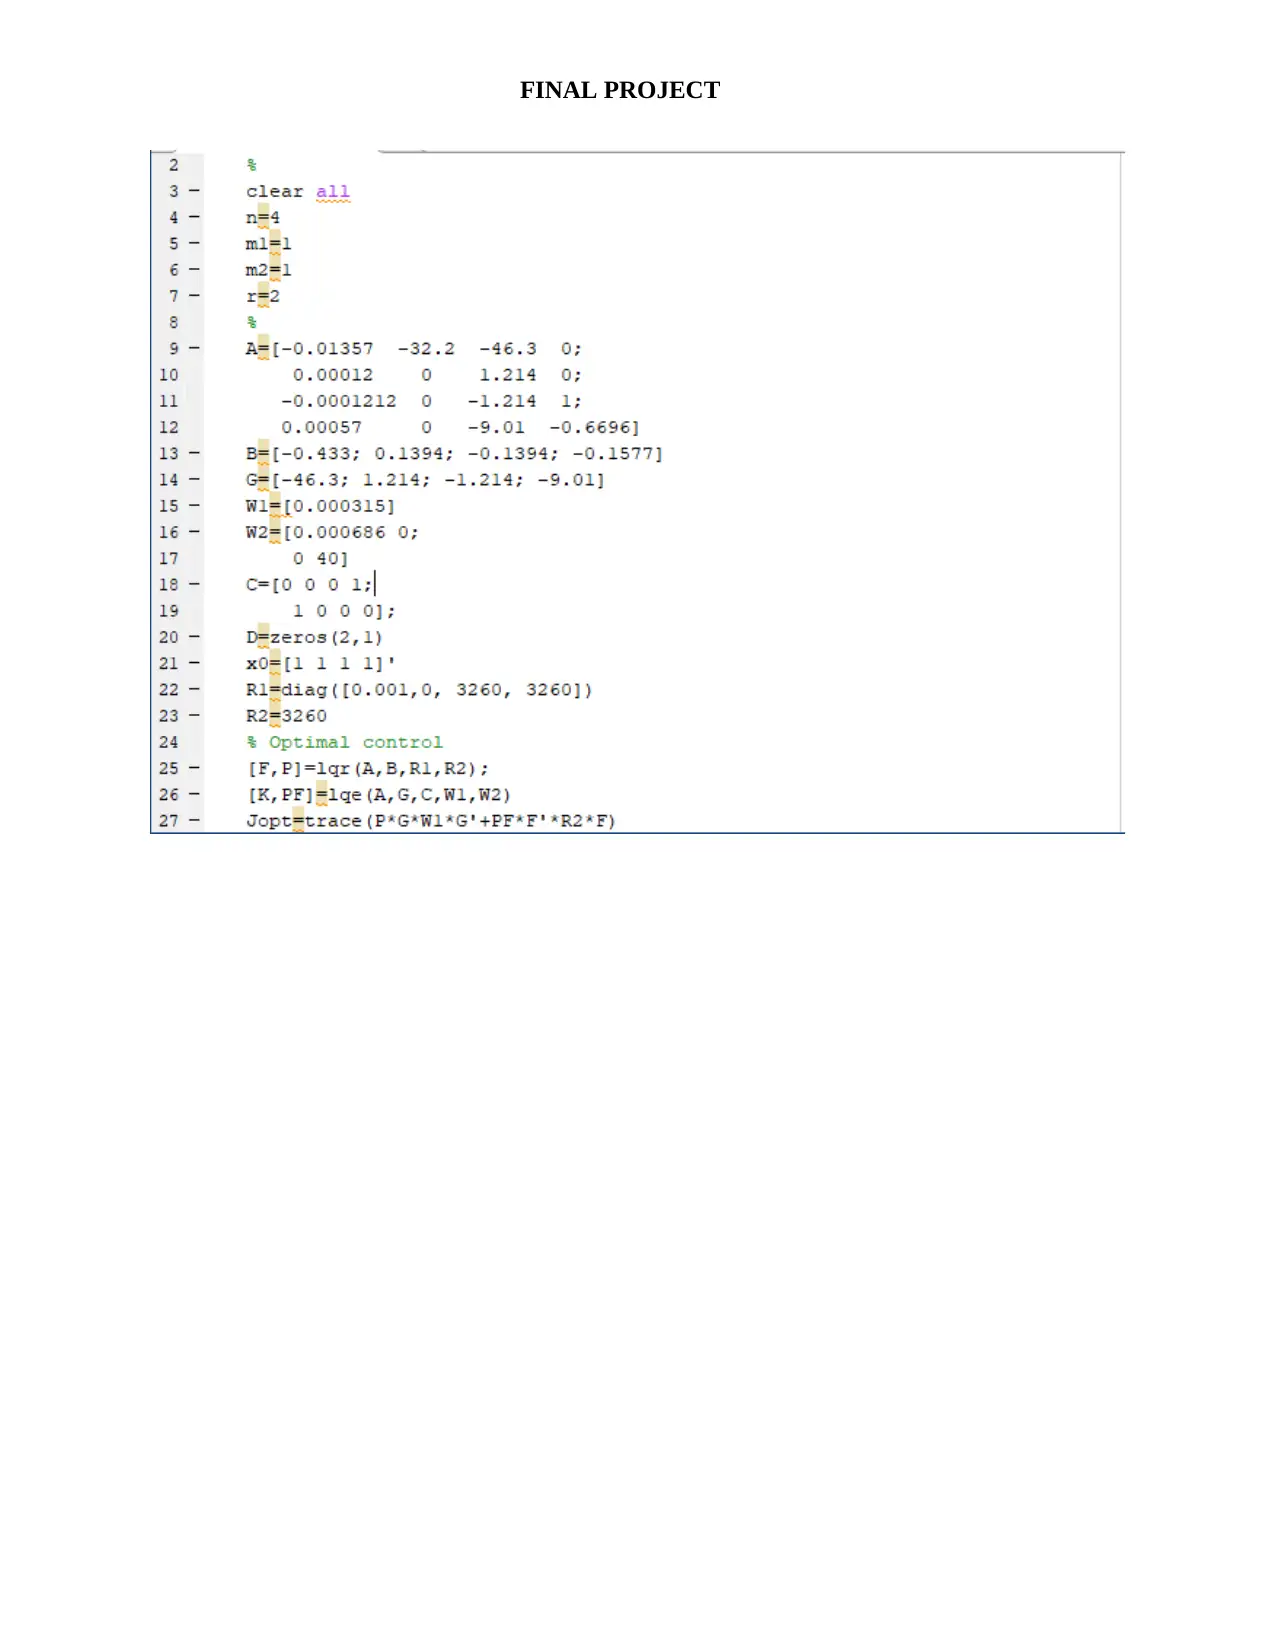
This project focuses on the design and analysis of Linear-Quadratic (LQ) optimal controllers and Kalman filters for a third-order, single-input single-output (SISO) system. The project begins by establishing the system's controllability and observability using MATLAB. Part 1a involves designing a zero-set point LQ controller, determining the optimal feedback gain (Fopt) and the optimal performance criterion (Jopt), and simulating the system in Simulink, with plots of input, output, and state variables. Part 1b extends this to a non-zero set point controller. Part 2a explores the use of an observer when all state space variables are not available for feedback, evaluating the performance loss. Finally, Part 2b utilizes pre-provided MATLAB and Simulink files to analyze system output with and without a Kalman filter, comparing the results. The project incorporates concepts of state-space representation, optimal control theory, and the application of MATLAB and Simulink for simulation and analysis.
Document Page
FINAL PROJECT
PROJECT NO. 3: FINAL PROJECT
LINEAR-QUADRATIC OPTIMAL CONTROLLERS AND THE KALMAN
FILTER
For this project, an LTI (linear time invariant), third order SISO (Single input single output) was
selected [1]. The system is completely controllable and observable. The system state space
representation is as shown below.
[ ˙x1
˙x2
˙x3 ] = [ 0 1 0
0 0 1
8 12 5 ] [ x1
x2
x3 ] + [ 0
0
6 ] [ u ]
[ y ] = [ 1 0 0 ] [ x1
x2
x3 ]
To check for controllability and observability of the system the MATLAB code in part 1 of the
appendix was ran. It was observed that the system was completely controllable and observable
and therefore system state space met the requirements.
Part 1a: Zero Set Point Linear-Quadratic Controller
It was assumed that all state space variables were available for feedback. The optimal
performance criterion weighted matrices were given by:
R1=CT C= [ 1 0 0
0 0 0
0 0 0 ]
R2=I m=I 3=1
The optimal feedback gain, Fopt, was obtained by using the MATLAB function lqr ([Fopt,
P]=lqr(A, B, R1,R2]). The assumptions made was that all components of the initial condition
state space vector were equal to 1. Fopt was obtained as:
Fopt=[0.3333 0.1585 0.0311]
The optimal value of the performance criterion of the system was obtained using the line,
Jopt=0.5*X0’*P*X0. Jopt was obtained as:
Jopt =0.9516
The mathematical model of the zero-set points linear-quadratic controller designed was then
simulated in MATLAB Simulink. Figure 1 below shows the block diagram in Simulink.
tabler-icon-diamond-filled.svg

Paraphrase This Document

Need a fresh take? Get an instant paraphrase of this document with our AI Paraphraser
Document Page
FINAL PROJECT
Figure 1: Block of the controller in Simulink
The following plots were made by running the simulation.
Figure 2: Simulation results for input and output signal
Document Page
FINAL PROJECT
Figure 3: Variation of the state variables with time
Part 1b: Non-zero Set Point Optimal Linear-Quadratic Controller
For this design was selected as:
Cz =[ 1 0 0]
The desired steady sate value for the system-controlled output: was selected as 1.
The optimal linear-quadratic non-zero set point controller was then designed with the weighted
matrices and the initial condition defined in Part 1a using the code in the appendix. The system-
controlled output was then plotted.
Figure 4: Simulink block diagram of the designed controller.
Document Page
FINAL PROJECT
Figure 5: Simulation results for the output z(t).
Part 2a:
When all state space variables are not available for feedback, an observer can be used to estimate
them, and implement , which works since . However, that may
cause a significant optimal performance loss given by:
Jloss =0.5e 0'p22e 0
And,
e 0= X 0X 0 ^¿
p22=lyap ( AkC )' pBinv ( R 2 )B'p
This was implemented using the code given in the appendix (code for part 2a).
The following results were obtained:
tabler-icon-diamond-filled.svg

Paraphrase This Document

Need a fresh take? Get an instant paraphrase of this document with our AI Paraphraser
Document Page
FINAL PROJECT
Part 2b:
For this exercise the MATLAB and Simulink files provided by the instructor were ran. The
system output without and with the Kalman filter were plotted as shown below.
Figure 6: Simulink block diagram of the system.
Document Page
FINAL PROJECT
Figure 7: Plot of y(t) against time t.
Figure 8: yhat(t) against t.
Document Page
FINAL PROJECT
References
[1] N. Nise, Control System Engineering, John Wiley and Sons, 2011.
[2] N. C. Jagan, Control Systesms, 2008.
[3] R. Dorf and R. Bishop, Modern Control Systems, Prentice Hall, 2011.
[4] M. Fadali and A. Visioli, Digital control Engineering Analysis and design, Elservier, 2013.
APPENDIX
MATLAB code for part 1
Code to check for system controllability
Code for part 1a
tabler-icon-diamond-filled.svg

Paraphrase This Document

Need a fresh take? Get an instant paraphrase of this document with our AI Paraphraser
Document Page
FINAL PROJECT
Code for part 1b
Code for part 2a
Code for part 2b
Document Page
FINAL PROJECT
chevron_up_icon
1 out of 9
circle_padding
hide_on_mobile
zoom_out_icon
[object Object]