Linear Regression Analysis: Retention & Graduation
VerifiedAdded on 2023/04/20
|9
|1592
|126
Report
AI Summary
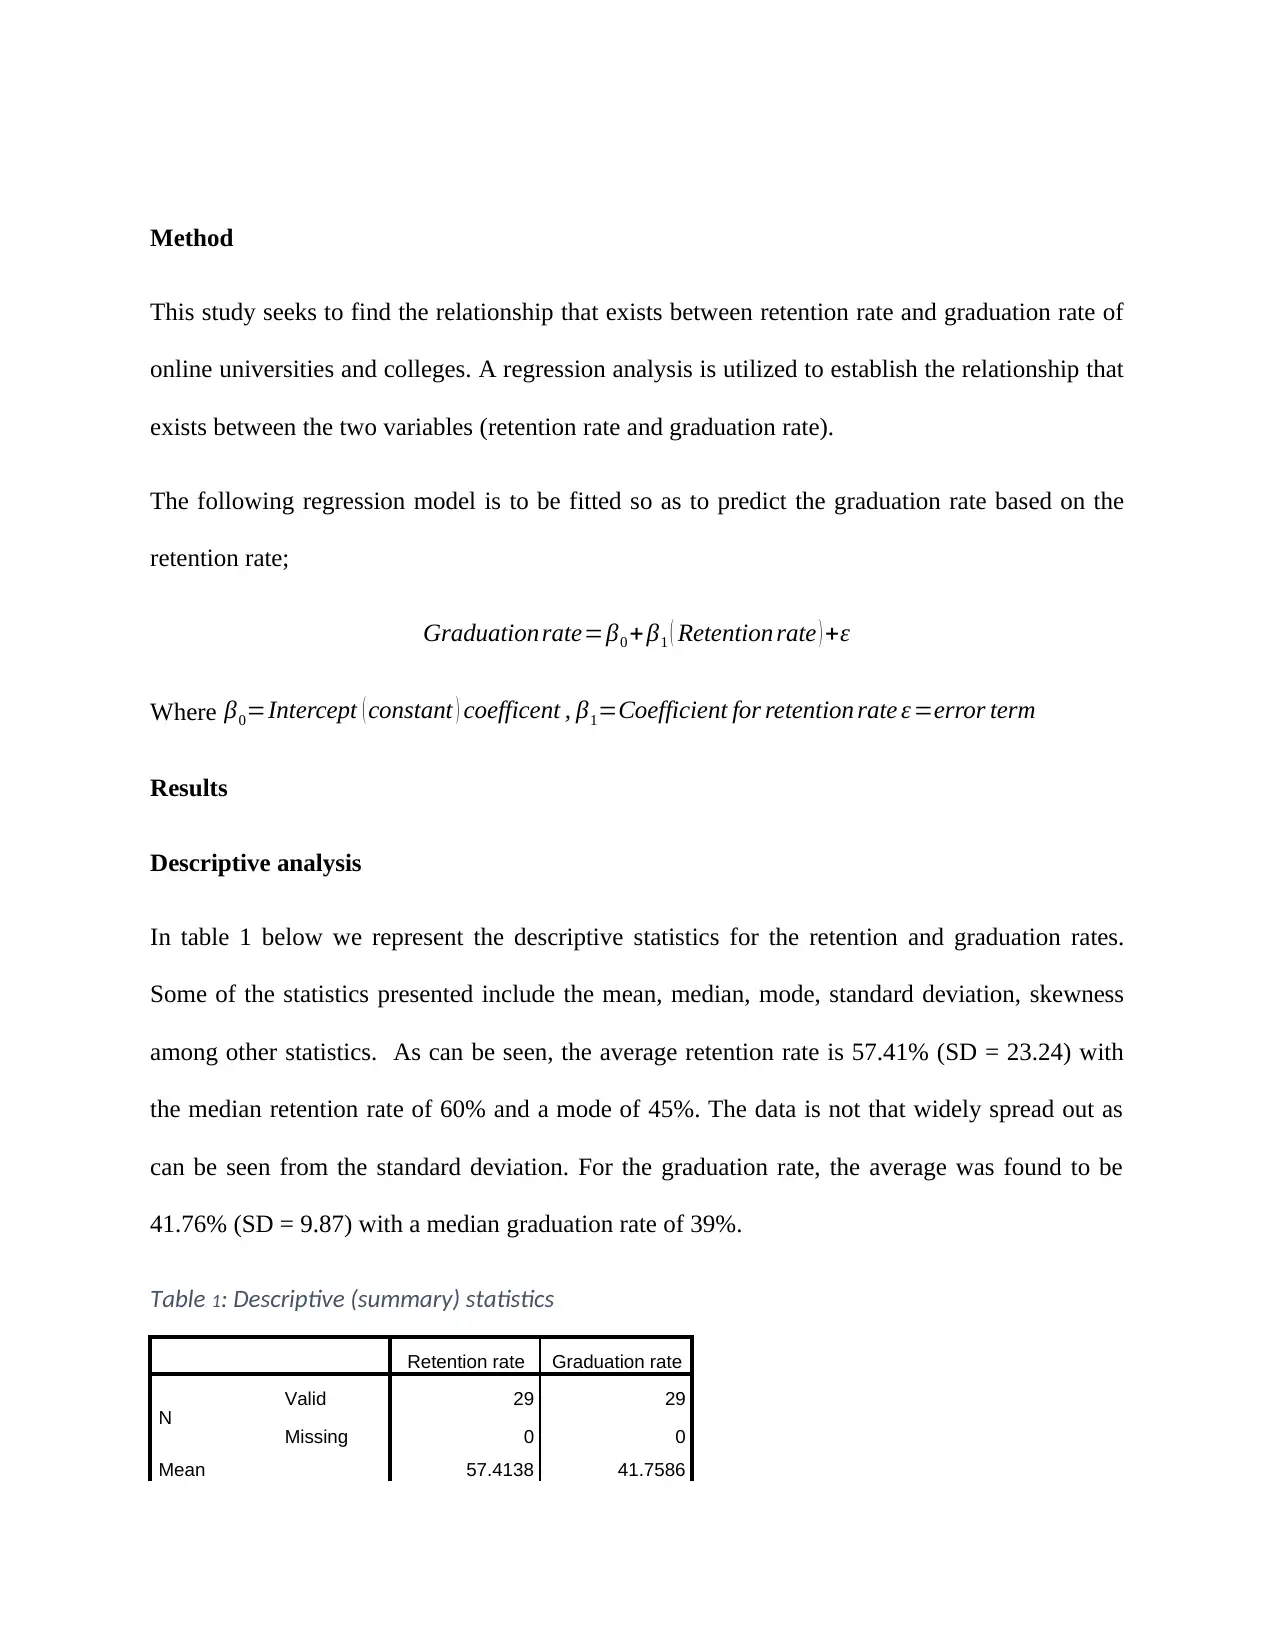
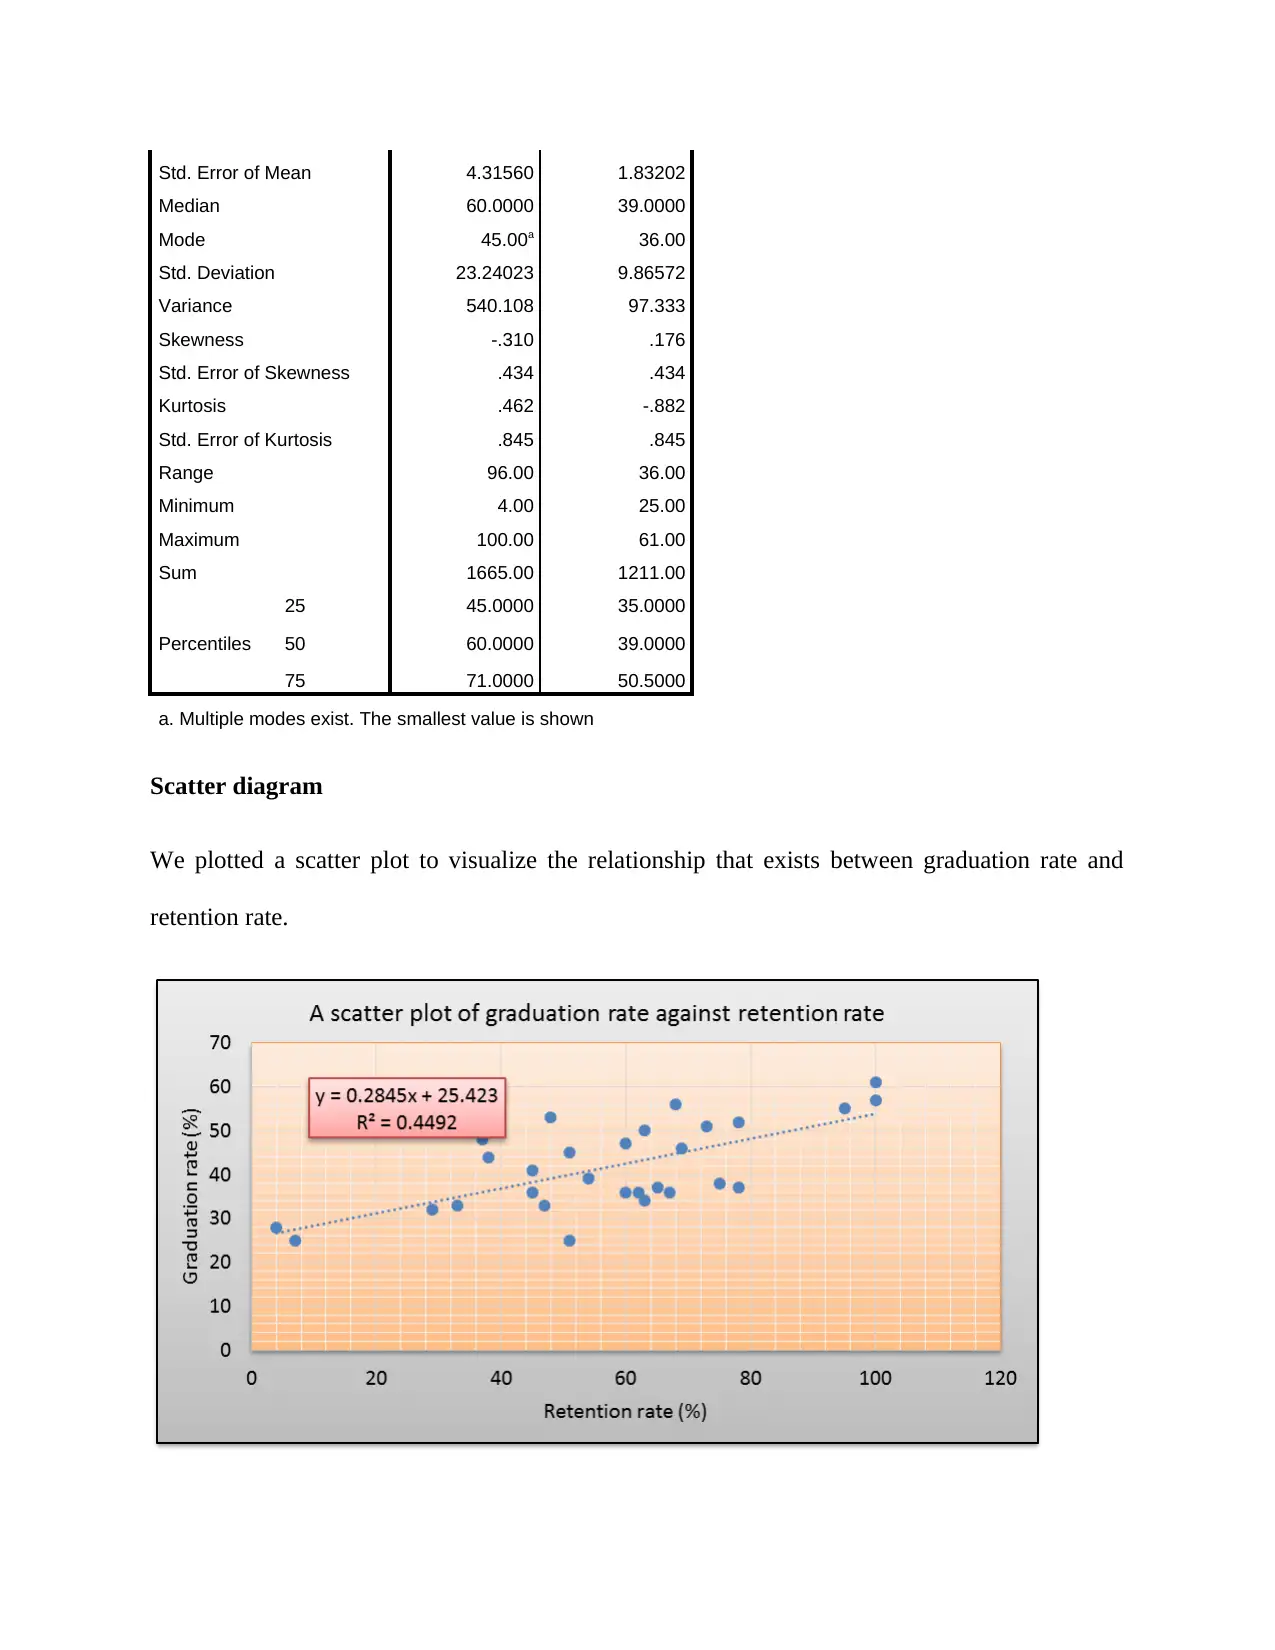
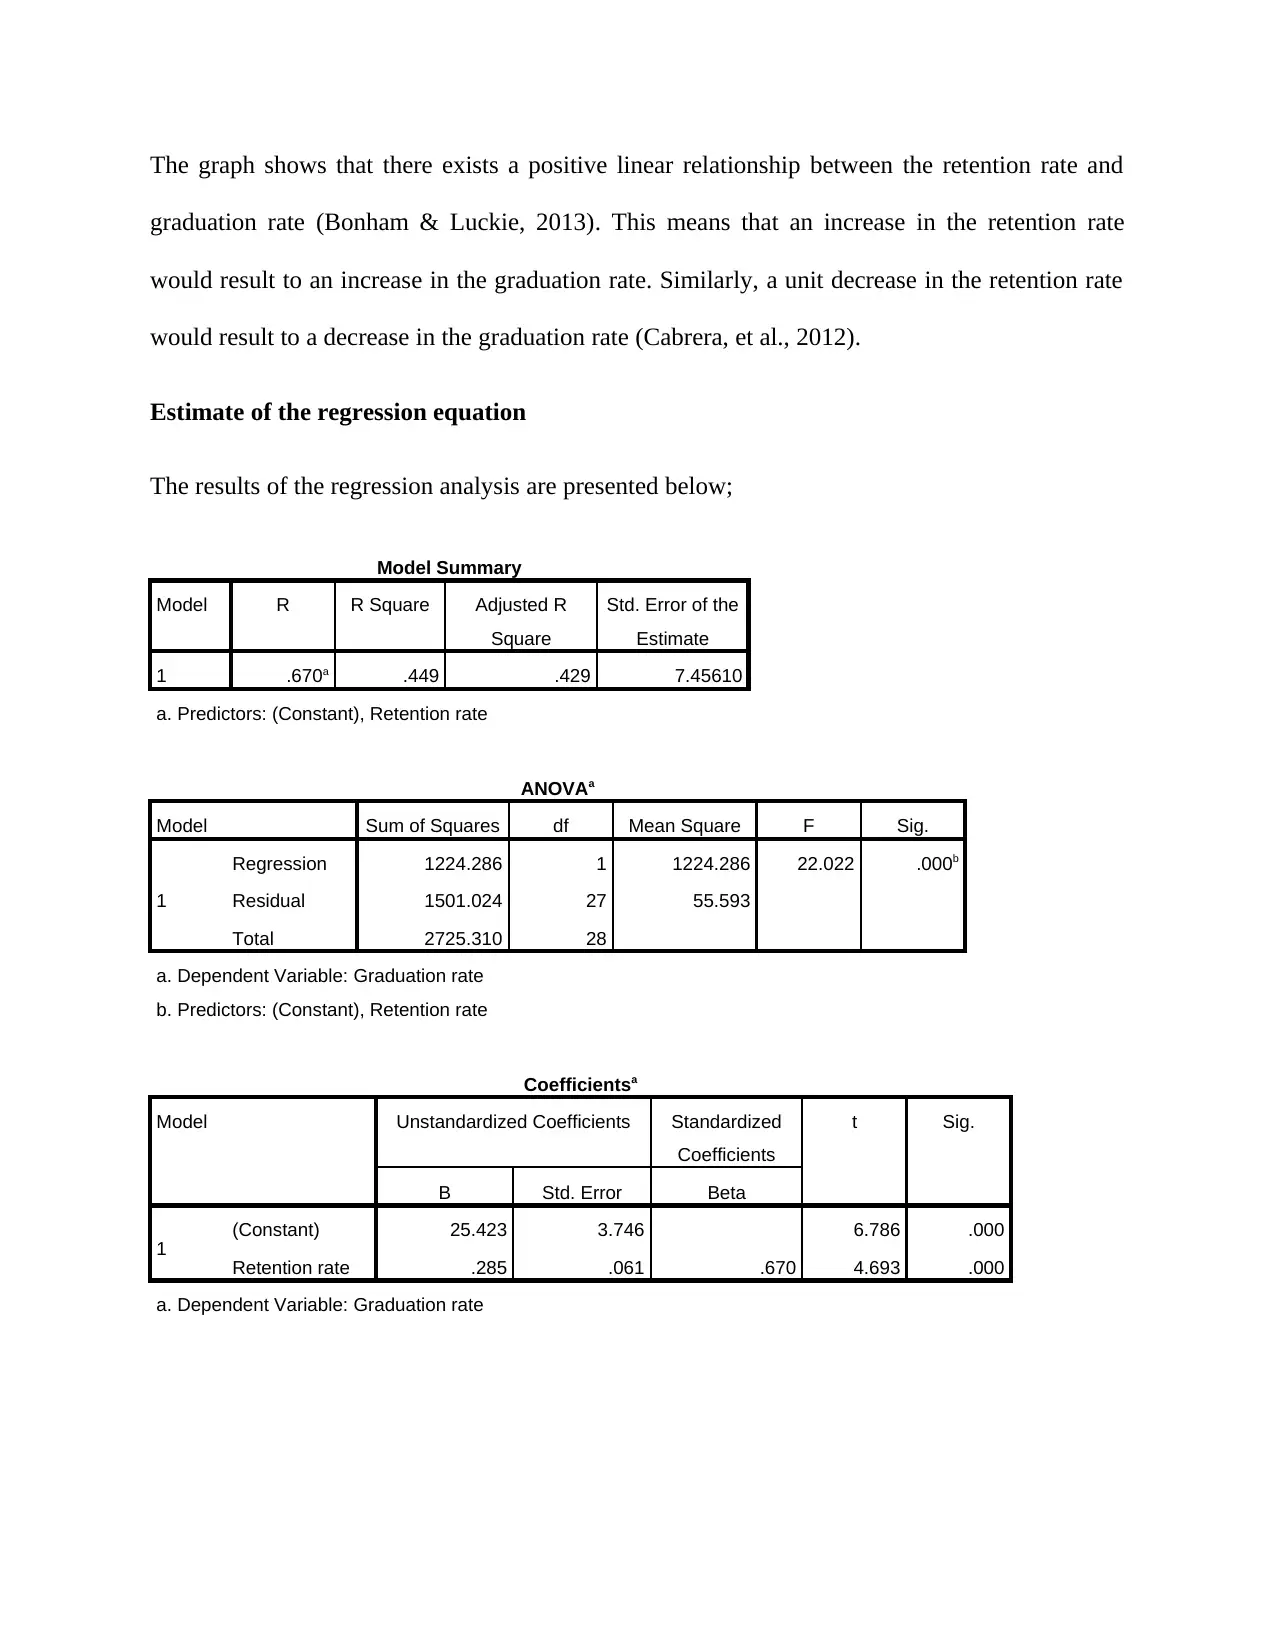
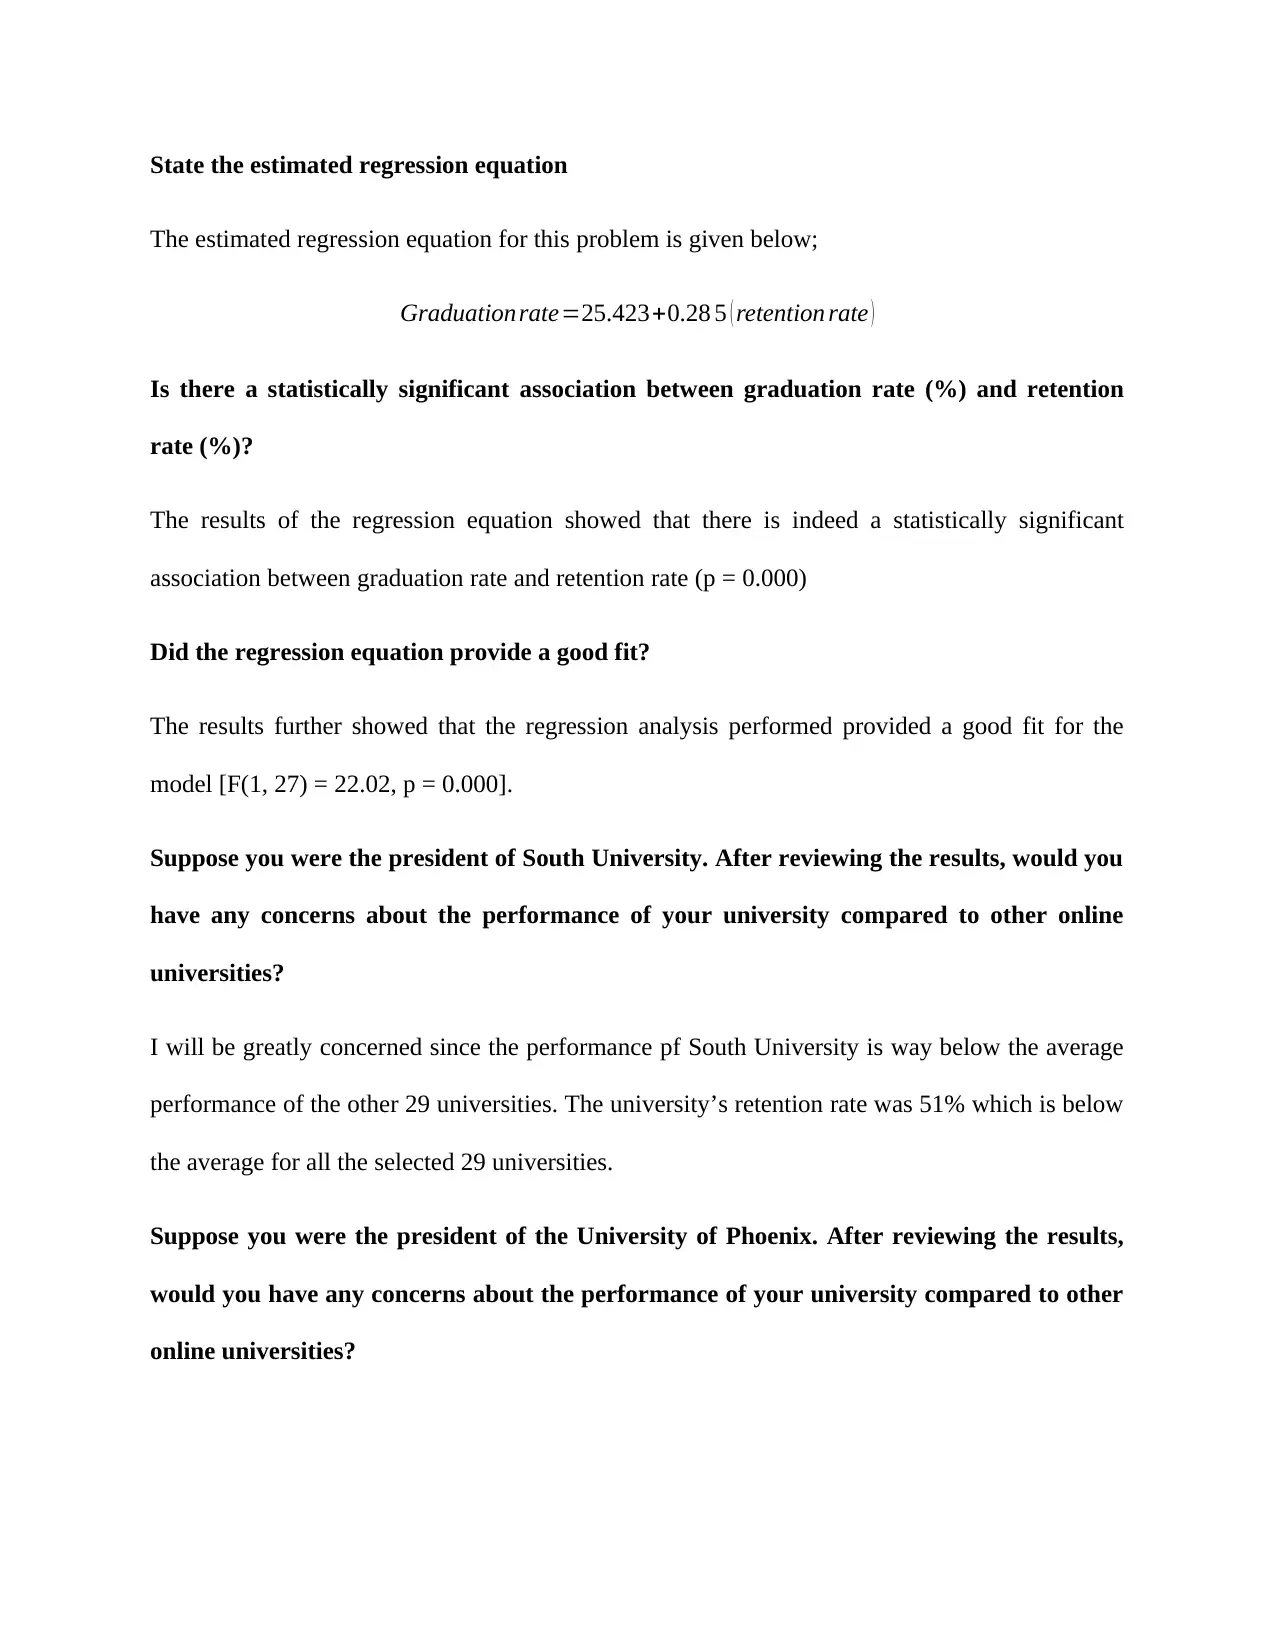
This report investigates the relationship between retention rates and graduation rates in online universities using a linear regression model. The study analyzes data from 29 online universities, obtained from the Online Education Database. The report begins with an overview of the importance of student retention and graduation, highlighting their significance for both student and institutional success, and the economists' interest in these rates. The methodology section details the use of regression analysis to predict graduation rates based on retention rates. Results include descriptive statistics, a scatter plot illustrating the positive linear relationship between the two variables, and the estimated regression equation. The analysis reveals a statistically significant association between graduation and retention rates, with the regression model providing a good fit. The report concludes with a discussion of the findings, including a comparison of the performance of specific universities and recommendations for improving retention and graduation rates, emphasizing the need for strategic planning and further research with larger sample sizes.

Economics and quantitative analysis
Name:
Institution:
9th February 2019
Name:
Institution:
9th February 2019
Paraphrase This Document
Need a fresh take? Get an instant paraphrase of this document with our AI Paraphraser

Purpose
This study aimed to investigate the relationship that exists between retention rate and the
graduation rate of the online universities. In order to test for this relationship, a set of data
comprising of 29 online universities is utilized. The data was obtained from the Online
Education Database which is an independent organization whose main mission is to have a well-
built database of all the accredited colleges and universities.
Background
Students persevering to finishing of their instructive objectives is a key check of student
achievement, and along these lines institutional achievement. Two most often referred to insights
in association with student achievement are the freshman-to-sophomore consistency standard, or
first-year yearly return rate, and the accomplice graduation rate. The freshman-to-sophomore
retention rate estimates the level of first-time, full-time students who are enrolled at the college
the following fall semester. The cohort graduation rate is characterized as the level of an entering
class that graduates within 3 years with an associate's degree, and within 4, 5, or 6 years with a
baccalaureate degree. Since the yearly return rate of students as they advance through a program
is straightforwardly identified with their degree/endorsement fruition, the idea of retention more
often than excludes year-by-year retention or perseverance rates also as graduation rates.
Together, these insights speak to student achievement. Economists are interested in the
association between graduation rate and retention rate as the students who graduate are likely to
influence the economic growth by improving the growth of economy unlike students who did not
graduate.

Method
This study seeks to find the relationship that exists between retention rate and graduation rate of
online universities and colleges. A regression analysis is utilized to establish the relationship that
exists between the two variables (retention rate and graduation rate).
The following regression model is to be fitted so as to predict the graduation rate based on the
retention rate;
Graduation rate=β0 + β1 ( Retention rate ) +ε
Where β0=Intercept ( constant ) coefficent , β1=Coefficient for retention rate ε =error term
Results
Descriptive analysis
In table 1 below we represent the descriptive statistics for the retention and graduation rates.
Some of the statistics presented include the mean, median, mode, standard deviation, skewness
among other statistics. As can be seen, the average retention rate is 57.41% (SD = 23.24) with
the median retention rate of 60% and a mode of 45%. The data is not that widely spread out as
can be seen from the standard deviation. For the graduation rate, the average was found to be
41.76% (SD = 9.87) with a median graduation rate of 39%.
Table 1: Descriptive (summary) statistics
Retention rate Graduation rate
N Valid 29 29
Missing 0 0
Mean 57.4138 41.7586
⊘ This is a preview!⊘
Do you want full access?
Subscribe today to unlock all pages.

Trusted by 1+ million students worldwide

Std. Error of Mean 4.31560 1.83202
Median 60.0000 39.0000
Mode 45.00a 36.00
Std. Deviation 23.24023 9.86572
Variance 540.108 97.333
Skewness -.310 .176
Std. Error of Skewness .434 .434
Kurtosis .462 -.882
Std. Error of Kurtosis .845 .845
Range 96.00 36.00
Minimum 4.00 25.00
Maximum 100.00 61.00
Sum 1665.00 1211.00
Percentiles
25 45.0000 35.0000
50 60.0000 39.0000
75 71.0000 50.5000
a. Multiple modes exist. The smallest value is shown
Scatter diagram
We plotted a scatter plot to visualize the relationship that exists between graduation rate and
retention rate.
Paraphrase This Document
Need a fresh take? Get an instant paraphrase of this document with our AI Paraphraser

The graph shows that there exists a positive linear relationship between the retention rate and
graduation rate (Bonham & Luckie, 2013). This means that an increase in the retention rate
would result to an increase in the graduation rate. Similarly, a unit decrease in the retention rate
would result to a decrease in the graduation rate (Cabrera, et al., 2012).
Estimate of the regression equation
The results of the regression analysis are presented below;
Model Summary
Model R R Square Adjusted R
Square
Std. Error of the
Estimate
1 .670a .449 .429 7.45610
a. Predictors: (Constant), Retention rate
ANOVAa
Model Sum of Squares df Mean Square F Sig.
1
Regression 1224.286 1 1224.286 22.022 .000b
Residual 1501.024 27 55.593
Total 2725.310 28
a. Dependent Variable: Graduation rate
b. Predictors: (Constant), Retention rate
Coefficientsa
Model Unstandardized Coefficients Standardized
Coefficients
t Sig.
B Std. Error Beta
1 (Constant) 25.423 3.746 6.786 .000
Retention rate .285 .061 .670 4.693 .000
a. Dependent Variable: Graduation rate

State the estimated regression equation
The estimated regression equation for this problem is given below;
Graduation rate=25.423+0.28 5 ( retention rate )
Is there a statistically significant association between graduation rate (%) and retention
rate (%)?
The results of the regression equation showed that there is indeed a statistically significant
association between graduation rate and retention rate (p = 0.000)
Did the regression equation provide a good fit?
The results further showed that the regression analysis performed provided a good fit for the
model [F(1, 27) = 22.02, p = 0.000].
Suppose you were the president of South University. After reviewing the results, would you
have any concerns about the performance of your university compared to other online
universities?
I will be greatly concerned since the performance pf South University is way below the average
performance of the other 29 universities. The university’s retention rate was 51% which is below
the average for all the selected 29 universities.
Suppose you were the president of the University of Phoenix. After reviewing the results,
would you have any concerns about the performance of your university compared to other
online universities?
⊘ This is a preview!⊘
Do you want full access?
Subscribe today to unlock all pages.

Trusted by 1+ million students worldwide

I will be greatly concerned since the performance of University Phoenix is way below the
average performance of the other 29 universities. The university’s retention rate for instance was
at 4% which is very much below the average for all the selected 29 universities.
Discussion
In this study, we sought to find out whether a significant relationship exists between graduation
rate and retention rate. Results of this study showed that a linear positive and a significant
relationship exists between graduation rate and retention rate. This study only utilized a sample
of 29 universities to draw its conclusions. This is a very small sample which is a limitation of the
study since it is very difficult to generalize the results. The study however rides on the fact that
the selected universities was drawn randomly hence minimizing selection bias since each and
every university was given an equal chance of being included into the study (Kuh, et al., 2015).
The results of the study are completely in agreement with many of the previous studies that
found out that a positive linear relationship exists between graduation rate and retention rate.
The results of this study give a clear indication for policy implications for the universities in
terms of coming up with strategic plans on retention and graduation rates (Berger & Lyons,
2010).
Recommendations
Considering the above results and findings, the following recommendations are made;
The retention rate is very low for most of the online universities, there is need to work out
ways of improving the retention rate among the online universities.
Paraphrase This Document
Need a fresh take? Get an instant paraphrase of this document with our AI Paraphraser

Future study should focus on a larger scope of the study and a much larger sample size in
order to allow for generalization of the results.
The graduation rate is quite very low for most of the online universities, there is need to
work out ways of improving the graduation rate among the online universities.
order to allow for generalization of the results.
The graduation rate is quite very low for most of the online universities, there is need to
work out ways of improving the graduation rate among the online universities.

References
Berger, J. B. & Lyons, S., 2010. Past to present: A historical look at retention. In Siedman, A.
(Ed.). College Student Retention: Formula of Student Success. Praeger Press, 6(3), pp. 134-141.
Bonham, L. A. & Luckie, J. I., 2013. Community college retention: Differentiating among
stopouts, dropouts, and optouts. Community College Journal of Research and Practice, 17(6),
pp. 543-554.
Cabrera, A. F., Castaneda, M. B., Nora, A. & Hengstler, D., 2012. The convergence between two
theories of college persistence. Journal of Higher Education, 63(2), pp. 143-164.
Hoyt, J. E. & Winn, B. A., 2009. Understanding retention and college student bodies:
Differences between drop-outs, stop-outs, opt-outs, and transfer-outs. NASPA Journal, 41(3), pp.
111-125.
Kuh, G. D., Kinzie, J., Schuh , J. H. & Whitt, E. J., 2015. Assessing Conditions to Enhance
Educational Effectiveness: The Inventory for Student Engagement and Success. Jossey Bass,
5(1), p. 56.
⊘ This is a preview!⊘
Do you want full access?
Subscribe today to unlock all pages.

Trusted by 1+ million students worldwide
1 out of 9
Related Documents

Your All-in-One AI-Powered Toolkit for Academic Success.
+13062052269
info@desklib.com
Available 24*7 on WhatsApp / Email
Unlock your academic potential
© 2024 | Zucol Services PVT LTD | All rights reserved.