Linear Regression Report: Retention and Graduation Rates Analysis
VerifiedAdded on 2023/04/20
|12
|2875
|370
Report
AI Summary
This report investigates the relationship between retention rates and graduation rates in online courses at 29 US colleges and universities. Using linear regression analysis, the study finds a statistically significant positive correlation between retention and graduation rates, indicating that a 1% increase in retention rate is associated with a 0.28% increase in graduation rate. The report discusses the implications of these findings, noting that while retention is a significant predictor of graduation, the linear model's explanatory power is limited. The study also compares the findings with previous literature and offers recommendations for future research, including incorporating student demographics and expanding the sample size to enhance the robustness of the model. The analysis highlights the importance of student retention strategies in improving graduation outcomes for online education programs.
How Retention positively affects Graduation Rate in Online courses– A
linear estimation model for US Colleges/Universities
1
linear estimation model for US Colleges/Universities
1
Paraphrase This Document
Need a fresh take? Get an instant paraphrase of this document with our AI Paraphraser
Abstract
This article explains and confirms the latest research results on the association of graduation
rates and retention rates with a sample of 29 universities and colleges in the United States.
Researchers believe that, in relation to research and evaluation reports in online courses, the
graduation rate should be considered as the dependent variable, whereas the retention rate
should be the independent variable. The question of the study is whether the retention rate of
colleges and universities claim and constructively affect their graduate percentage records?
The researcher has conducted an exploratory analysis to solve the descriptive statistics for
these two variables. The linear regression model based on significant correlation analysis has
been compared to previous literature. The high linear correlation with statistical significance
(r = 0.67, p < 0.05) shows that the GR prediction model is an effective and reliable model.
Increase in the retention rate by 1 per cent affected the graduation rate by a significant
increase by 0.28%. This interpretation clearly shows the positive effect of retention rates on
graduation rates for the sample observations.
Contents
2
Abstract......................................................................................................................................2
Aim or Purpose of Research.......................................................................................................4
Literature Review or Background..............................................................................................4
Methodology..............................................................................................................................5
Results........................................................................................................................................5
Discussion...................................................................................................................................7
Overview.................................................................................................................................7
Strength and Limitations........................................................................................................8
Comparative Analysis.............................................................................................................8
Policy Implications..................................................................................................................8
Recommendations..................................................................................................................8
References................................................................................................................................10
Appendices...............................................................................................................................11
3
⊘ This is a preview!⊘
Do you want full access?
Subscribe today to unlock all pages.
Trusted by 1+ million students worldwide
Aim or Purpose of Research
Online learning at universities in the United States continues to increase, but for students who
are particularly prone to failure, the obvious question comes about the efficiency of the
system. This article explains this problem and validates the results from recent studies from
the success rates of college students from 29 colleges and universities in the USA. The
scholar considered the comparison with an exploratory and estimation analysis report with
graduation rate as the dependent and retention rate as the independent variables in online
courses.
Literature Review or Background
Online education at universities in the United States is no longer abnormal. According to
national information, at least 5.2 million students enrolled in the fall semester in 2013, and
25% of college students in the USA participated in more than one online course in 2013
(Allen & Seaman, 2015, p. 9-13). This suggests that online learning may be more effective
and that the learning outcomes are not considerably unlike from the traditional curriculum
(Bernard et al., 2009, p.1243-1289; Means et al., 2009, p.37-48). But teachers also began to
believe that retention and progress of the course in online mode is a matter of great concern
(Moore & Fetzner, 2009, p.3-22).
Two of these research works were conducted by Community College Research Centre
(CCRC) at Virginia College and Washington State (Xu & Jaggers, 2011, p.4-18). The setup
in both the research systems was monitored for consecutive five years. It was found that well-
educated students more often take online courses and they compared these students with all
students who enrolled in online courses. They discovered that students in both the systems
more often failed or left online courses than full-time.
However, Shea and Bidjerano (2014, p.103-111) reported distinctly different results with
slightly different performance indicators. Using Beginning Post-secondary Survey (BPS),
they conducted a study program and testimony among pupils who attended one or more
online programs and those students who attended offline courses. These students were re-
examined in 2006 and 2009. Shi and Bigerano studied these data to reproduce and extend the
results of the CCRC study.
4
Paraphrase This Document
Need a fresh take? Get an instant paraphrase of this document with our AI Paraphraser
The study report of this article is based on the previous study and seems to investigate the
irregularity between them. The scholar examined the relation between retention rate and
progress of students participating in online courses. Research question was:
Controlling for other factors (demographic and personal), does the retention rate of
college and university affirmatively and constructively affects their graduation
percentage record?
Methodology
The students in each of the colleges and universities were grouped according to a learning
mode (completely online or offline), and according to the courses registered in the first six
years of registration. Institution’s graduation record of all the online courses and during the
research tenure the retention records of all the participated students in all online courses were
considered.
The scholar performed an exploratory analysis to address the descriptive statistics of both the
variables of the study. An ordinary linear regression report on the scenario with correlation
analysis was also compared with the previous literatures (Meyers, Gamst, and Guarino, 2016,
p.107-136). The statistical analyses were conducted with 95% confidence or 5% level of
significance.
Results
a. Graduation rate for the 29 colleges and universities varied between 25% and 61%. The
average rate of graduation was evaluated as 41.76% with a standard deviation of 9.87%.
Minimum retention rate was noted to be 4%, and the maximum rate was 100%. The
average retention rate was evaluated to be at 57.41% with a standard deviation of
23.24%.
b. A scatterplot was drawn to present the correlation between the dependent (graduate rate
%) and the independent (retention rate %). A statistically significant and abstemiously
high linear correlation (r = 0.67, p < 0.05) indicated that the estimation modelling for
predicting the GR was a valid and reliable model.
5
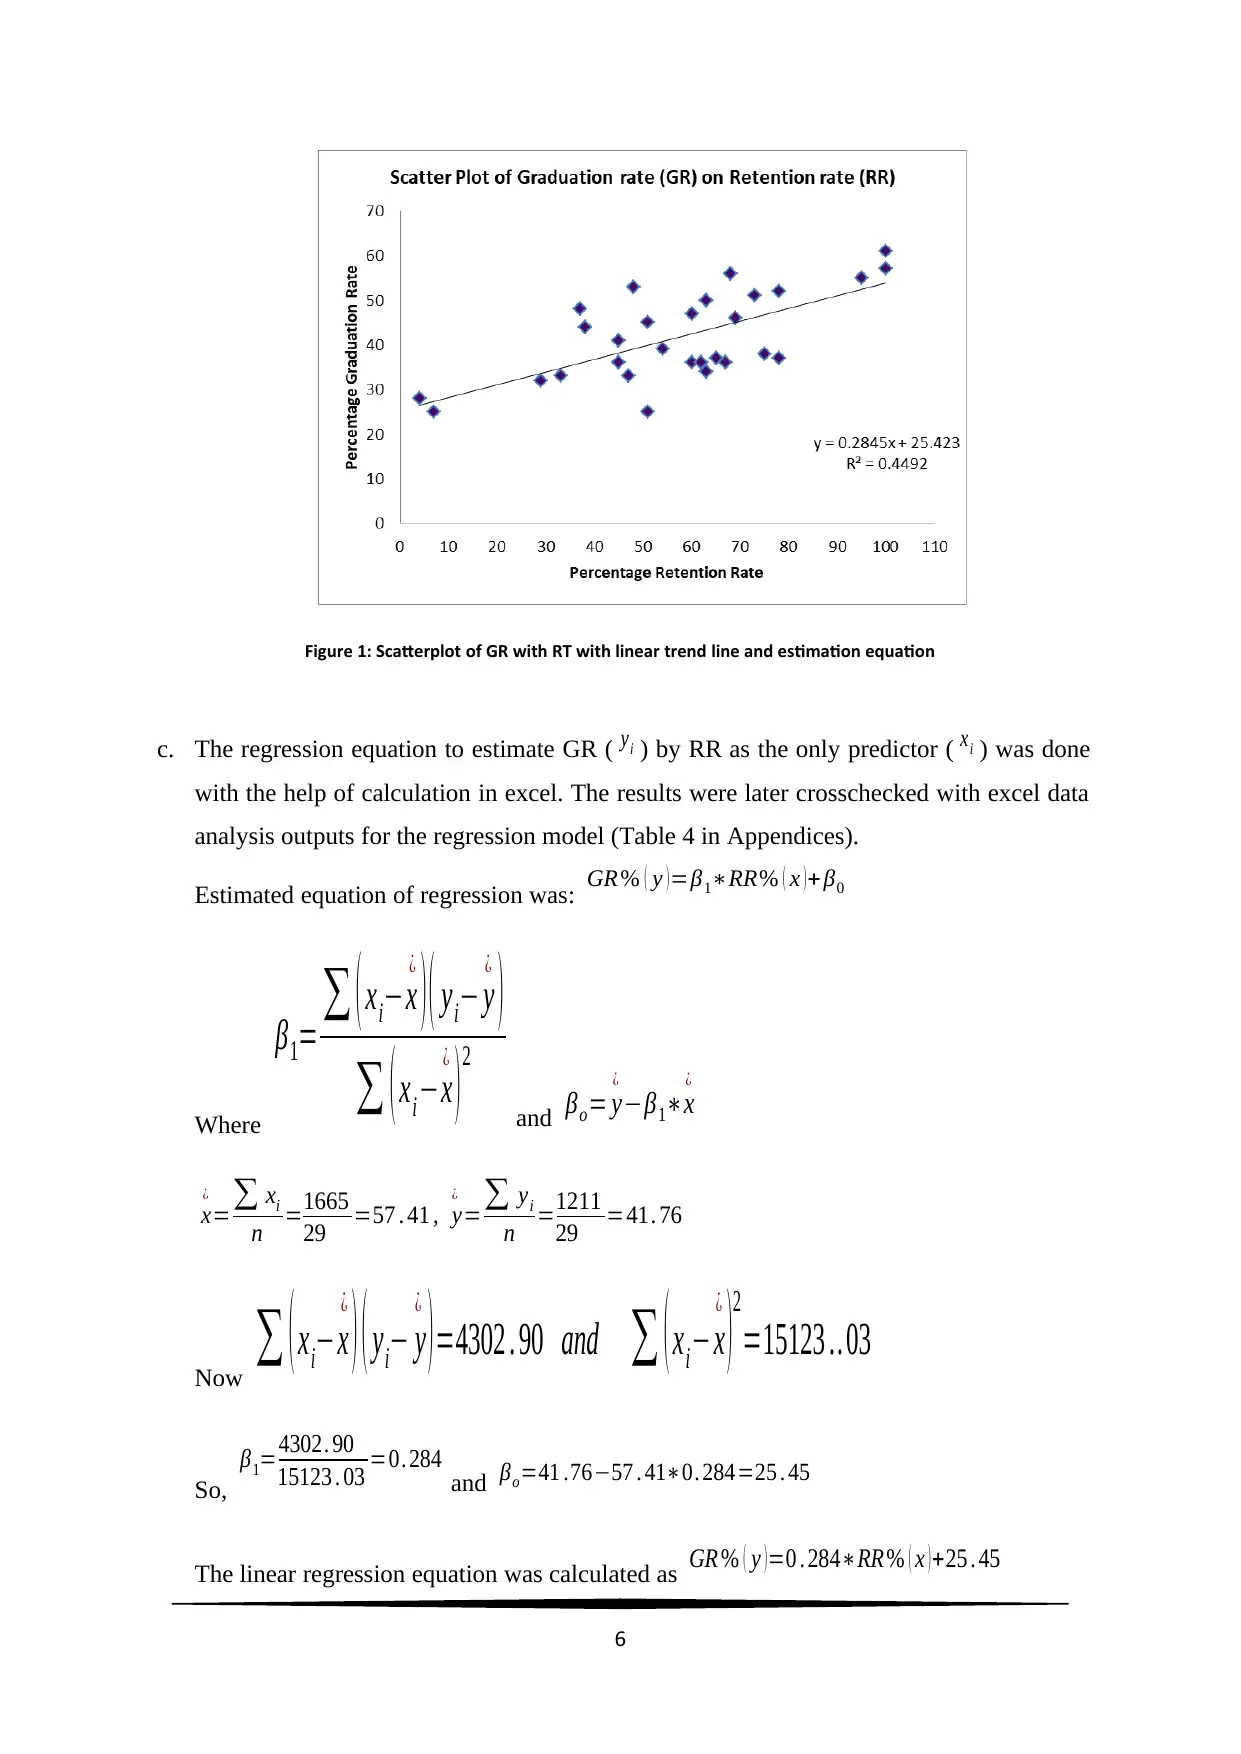
Figure 1: Scatterplot of GR with RT with linear trend line and estimation equation
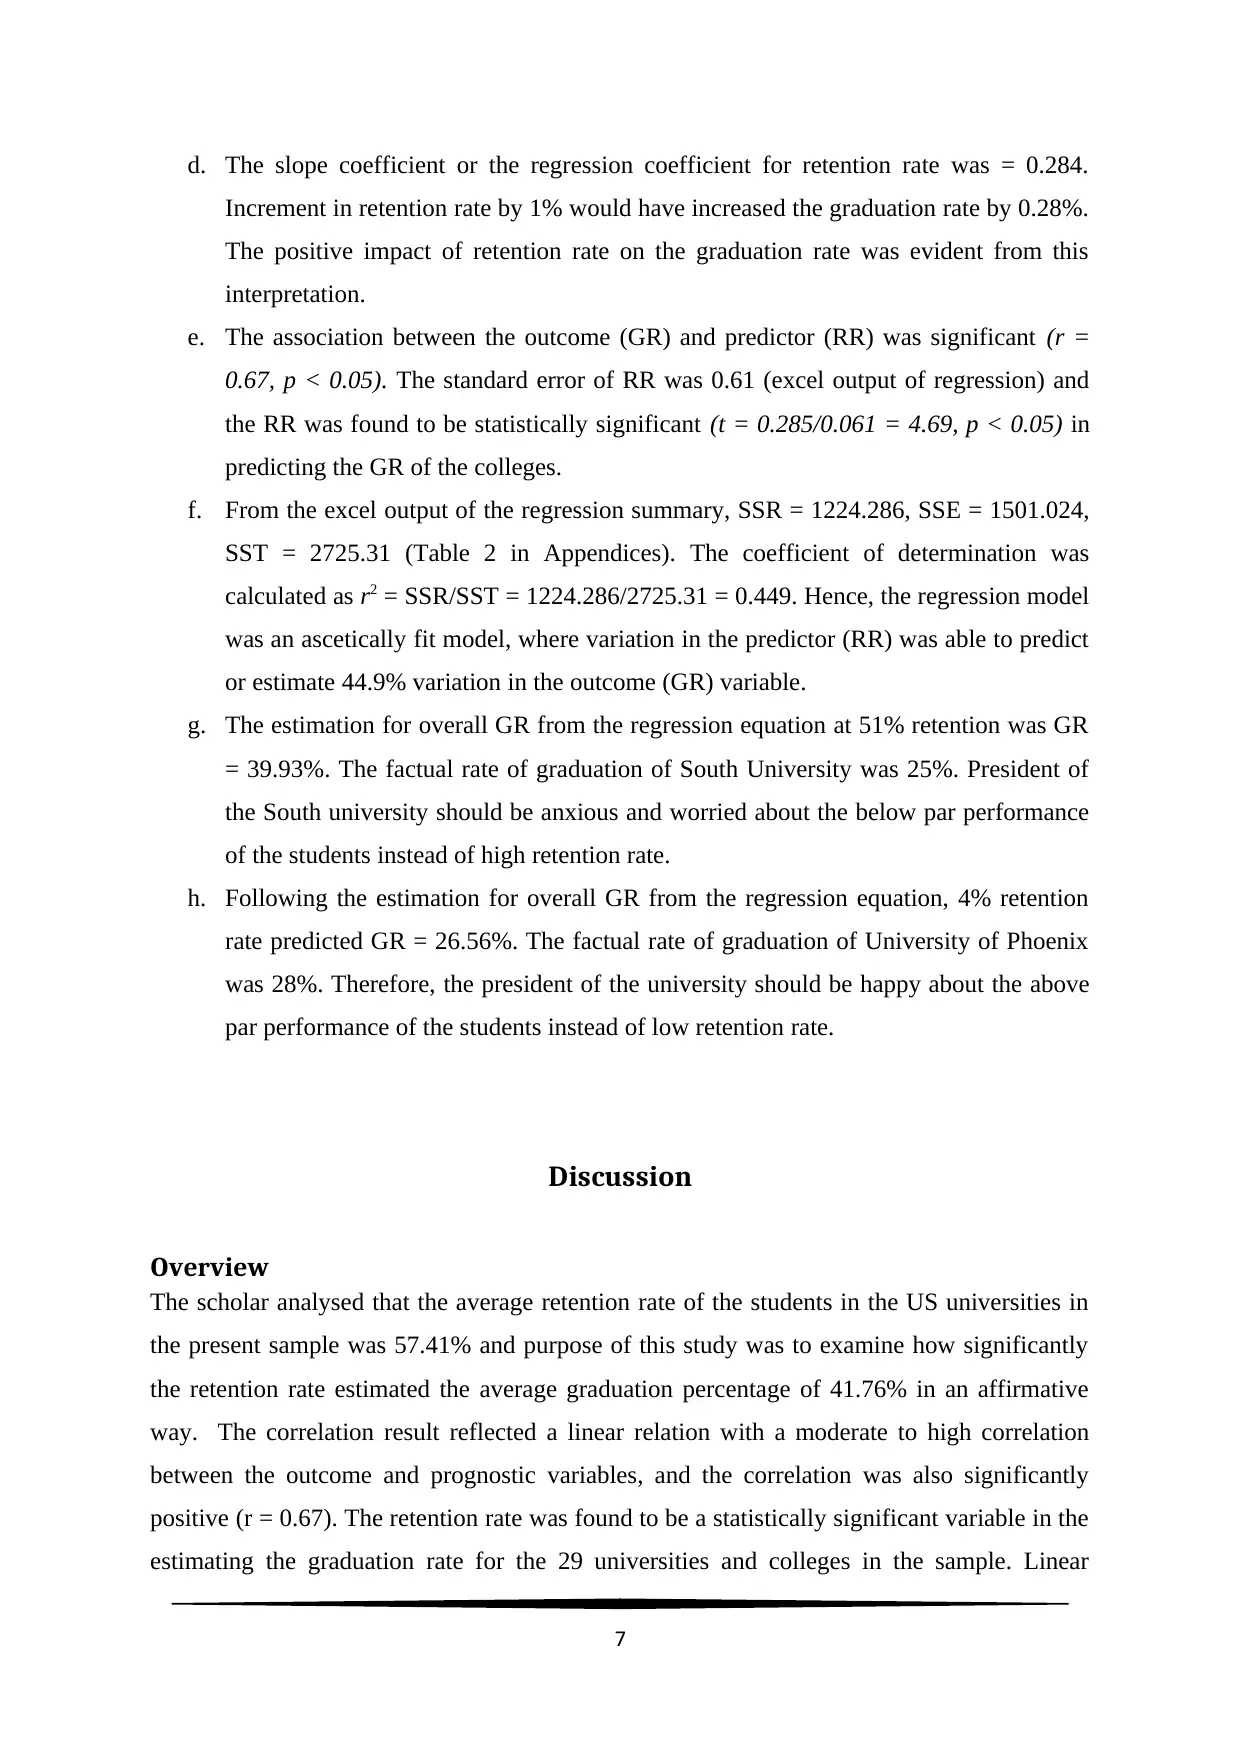
c. The regression equation to estimate GR ( yi ) by RR as the only predictor ( xi ) was done
with the help of calculation in excel. The results were later crosschecked with excel data
analysis outputs for the regression model (Table 4 in Appendices).
Estimated equation of regression was: GR % ( y ) =β1∗RR% ( x ) + β0
Where
β1= ∑ ( xi−x
¿
)( yi− y
¿
)
∑ ( xi−x
¿
) 2
and βo= y
¿
−β1∗x
¿
x
¿
=∑ xi
n =1665
29 =57 . 41 , y
¿
=∑ yi
n =1211
29 =41. 76
Now
∑ ( xi−x
¿
) ( yi− y
¿
) =4302 . 90 and ∑ ( xi−x
¿
)
2
=15123 .. 03
So,
β1=4302. 90
15123 . 03 =0. 284 and βo=41 .76−57 . 41∗0. 284=25 . 45
The linear regression equation was calculated as GR % ( y ) =0 . 284∗RR% ( x ) +25 . 45
6
⊘ This is a preview!⊘
Do you want full access?
Subscribe today to unlock all pages.
Trusted by 1+ million students worldwide
d. The slope coefficient or the regression coefficient for retention rate was = 0.284.
Increment in retention rate by 1% would have increased the graduation rate by 0.28%.
The positive impact of retention rate on the graduation rate was evident from this
interpretation.
e. The association between the outcome (GR) and predictor (RR) was significant (r =
0.67, p < 0.05). The standard error of RR was 0.61 (excel output of regression) and
the RR was found to be statistically significant (t = 0.285/0.061 = 4.69, p < 0.05) in
predicting the GR of the colleges.
f. From the excel output of the regression summary, SSR = 1224.286, SSE = 1501.024,
SST = 2725.31 (Table 2 in Appendices). The coefficient of determination was
calculated as r2 = SSR/SST = 1224.286/2725.31 = 0.449. Hence, the regression model
was an ascetically fit model, where variation in the predictor (RR) was able to predict
or estimate 44.9% variation in the outcome (GR) variable.
g. The estimation for overall GR from the regression equation at 51% retention was GR
= 39.93%. The factual rate of graduation of South University was 25%. President of
the South university should be anxious and worried about the below par performance
of the students instead of high retention rate.
h. Following the estimation for overall GR from the regression equation, 4% retention
rate predicted GR = 26.56%. The factual rate of graduation of University of Phoenix
was 28%. Therefore, the president of the university should be happy about the above
par performance of the students instead of low retention rate.
Discussion
Overview
The scholar analysed that the average retention rate of the students in the US universities in
the present sample was 57.41% and purpose of this study was to examine how significantly
the retention rate estimated the average graduation percentage of 41.76% in an affirmative
way. The correlation result reflected a linear relation with a moderate to high correlation
between the outcome and prognostic variables, and the correlation was also significantly
positive (r = 0.67). The retention rate was found to be a statistically significant variable in the
estimating the graduation rate for the 29 universities and colleges in the sample. Linear
7
Paraphrase This Document
Need a fresh take? Get an instant paraphrase of this document with our AI Paraphraser
regression equation fit was not sufficiently adequate to estimate and explain the output
variable. Southern University expressed concern over their graduate level as the overall
graduate level estimate was much higher than the actual level of implementation. Phoenix
University was superior to other online universities, so there was no doubt about their
effective retention rate.
Strength and Limitations
The sample data for this study was limited to 29 colleges and universities in the US,
therefore, the research results might not be applicable all over the country. However,
participating organizations were very diverse in both the academic and student environments
and are located throughout the United States. Various potential confounding factors were not
taken into account, and the controlled study also affected the results. For example, a student
working full time may not have much time to study. As a result, the tendency to participate in
Internet courses may increase, giving the opportunity to influence outcomes.
Comparative Analysis
Findings of the present study specified that instead of moderate to high correlation between
RR and GR, the linear model was not adequate enough to predict even 50% variation in the
graduation rates. Though RR was a statistically significant predictor, but maybe due to
absence of other factors the practical significance of the model was weak. The results are in
line with the results of literatures from Bernard et al. (2009, p.1243-1289) and Means et al.
(2009, p.37-48). The findings also resembled with conclusions of Shea and Bidjerano (2014,
p.103-111) reported results.
Policy Implications
A major implication of the policies of the present research recognized the estimated
graduation success rates in the colleges. The direct impact of retention of students was
statistically significant and practically immaculate. Enrolment planning and course or
program planning challenges, especially with age and gender of the students needed to be
addressed.
Recommendations
a. Student learning styles, age, gender and role of instructors are the major impact
factors in successful completion of graduation course, even in a high retention
scenario. Future research needs to incorporate these factors as mediators in the
regression model.
8
b. The sample size of the research was considerably small to obtain a statistically
significant and practically noteworthy estimation model. A longitudinal study with
more than 50 universities may produce a statistically significant result for a broader
population.
c. Future studies should also include offline students in the sample, preferably program
wise. This will help in a comparative analysis between offline and online students
regarding the impact of retention on successful completion of graduation (Gallagher,
and Savage, 2016, p.358-369).
9
⊘ This is a preview!⊘
Do you want full access?
Subscribe today to unlock all pages.
Trusted by 1+ million students worldwide
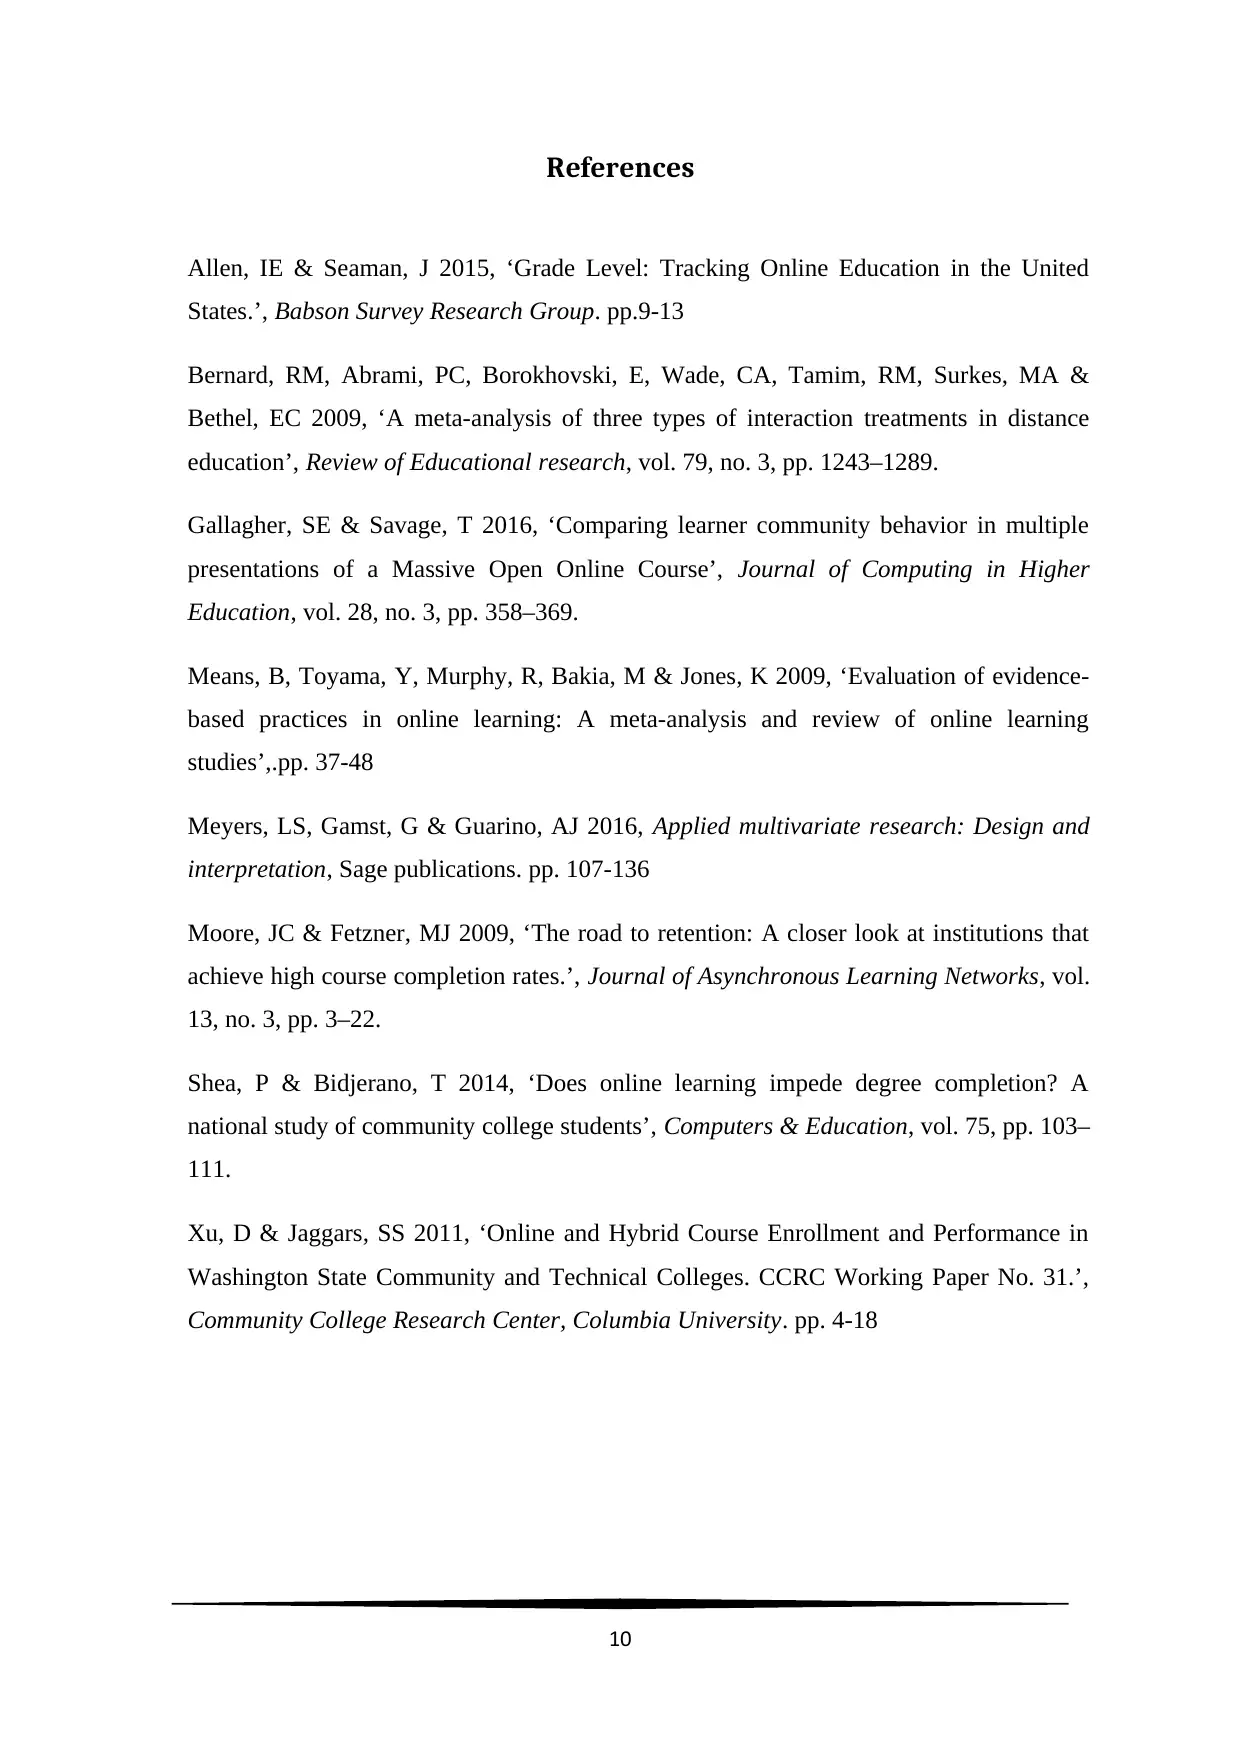
References
Allen, IE & Seaman, J 2015, ‘Grade Level: Tracking Online Education in the United
States.’, Babson Survey Research Group. pp.9-13
Bernard, RM, Abrami, PC, Borokhovski, E, Wade, CA, Tamim, RM, Surkes, MA &
Bethel, EC 2009, ‘A meta-analysis of three types of interaction treatments in distance
education’, Review of Educational research, vol. 79, no. 3, pp. 1243–1289.
Gallagher, SE & Savage, T 2016, ‘Comparing learner community behavior in multiple
presentations of a Massive Open Online Course’, Journal of Computing in Higher
Education, vol. 28, no. 3, pp. 358–369.
Means, B, Toyama, Y, Murphy, R, Bakia, M & Jones, K 2009, ‘Evaluation of evidence-
based practices in online learning: A meta-analysis and review of online learning
studies’,.pp. 37-48
Meyers, LS, Gamst, G & Guarino, AJ 2016, Applied multivariate research: Design and
interpretation, Sage publications. pp. 107-136
Moore, JC & Fetzner, MJ 2009, ‘The road to retention: A closer look at institutions that
achieve high course completion rates.’, Journal of Asynchronous Learning Networks, vol.
13, no. 3, pp. 3–22.
Shea, P & Bidjerano, T 2014, ‘Does online learning impede degree completion? A
national study of community college students’, Computers & Education, vol. 75, pp. 103–
111.
Xu, D & Jaggars, SS 2011, ‘Online and Hybrid Course Enrollment and Performance in
Washington State Community and Technical Colleges. CCRC Working Paper No. 31.’,
Community College Research Center, Columbia University. pp. 4-18
10
Paraphrase This Document
Need a fresh take? Get an instant paraphrase of this document with our AI Paraphraser
Appendices
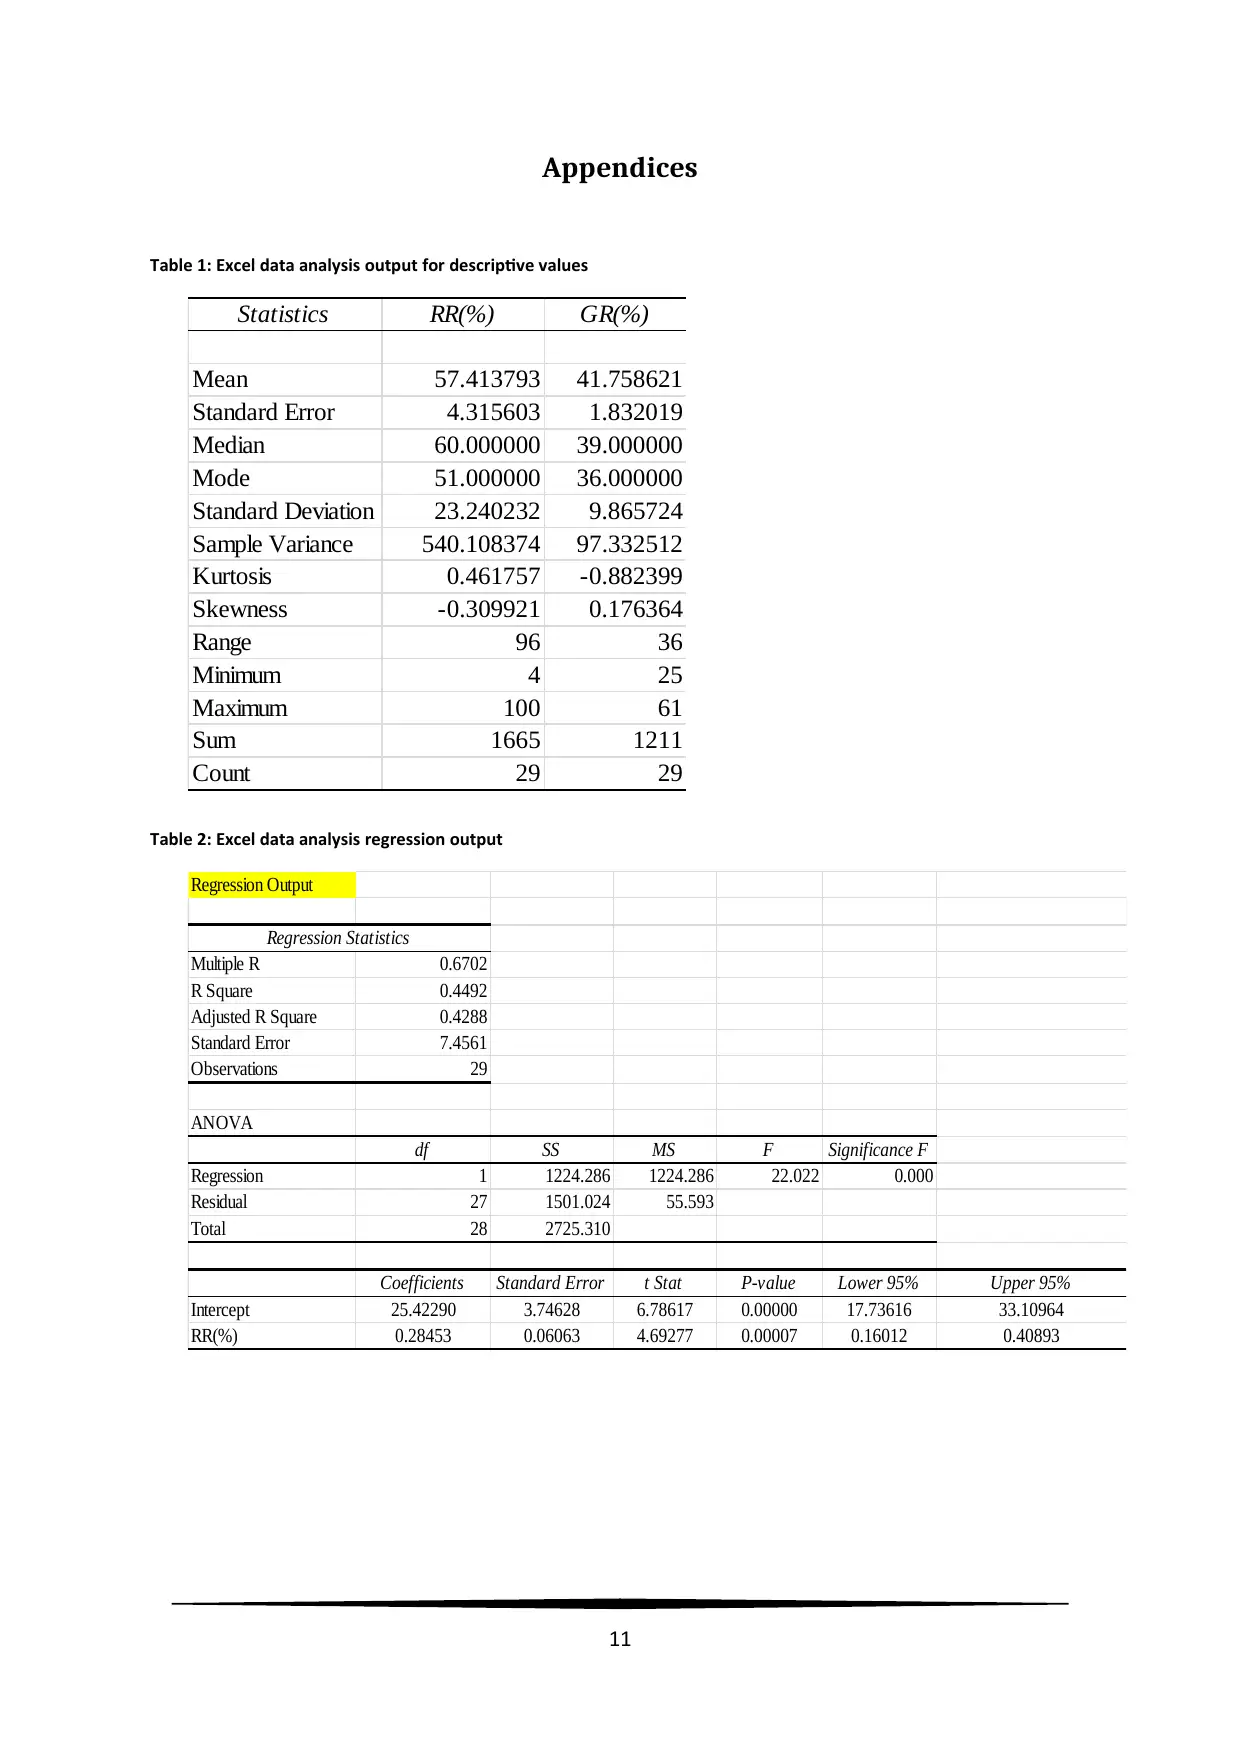
Table 1: Excel data analysis output for descriptive values
Statistics RR(%) GR(%)
Mean 57.413793 41.758621
Standard Error 4.315603 1.832019
Median 60.000000 39.000000
Mode 51.000000 36.000000
Standard Deviation 23.240232 9.865724
Sample Variance 540.108374 97.332512
Kurtosis 0.461757 -0.882399
Skewness -0.309921 0.176364
Range 96 36
Minimum 4 25
Maximum 100 61
Sum 1665 1211
Count 29 29
Table 2: Excel data analysis regression output
Regression Output
Regression Statistics
Multiple R 0.6702
R Square 0.4492
Adjusted R Square 0.4288
Standard Error 7.4561
Observations 29
ANOVA
df SS MS F Significance F
Regression 1 1224.286 1224.286 22.022 0.000
Residual 27 1501.024 55.593
Total 28 2725.310
Coefficients Standard Error t Stat P-value Lower 95% Upper 95%
Intercept 25.42290 3.74628 6.78617 0.00000 17.73616 33.10964
RR(%) 0.28453 0.06063 4.69277 0.00007 0.16012 0.40893
11
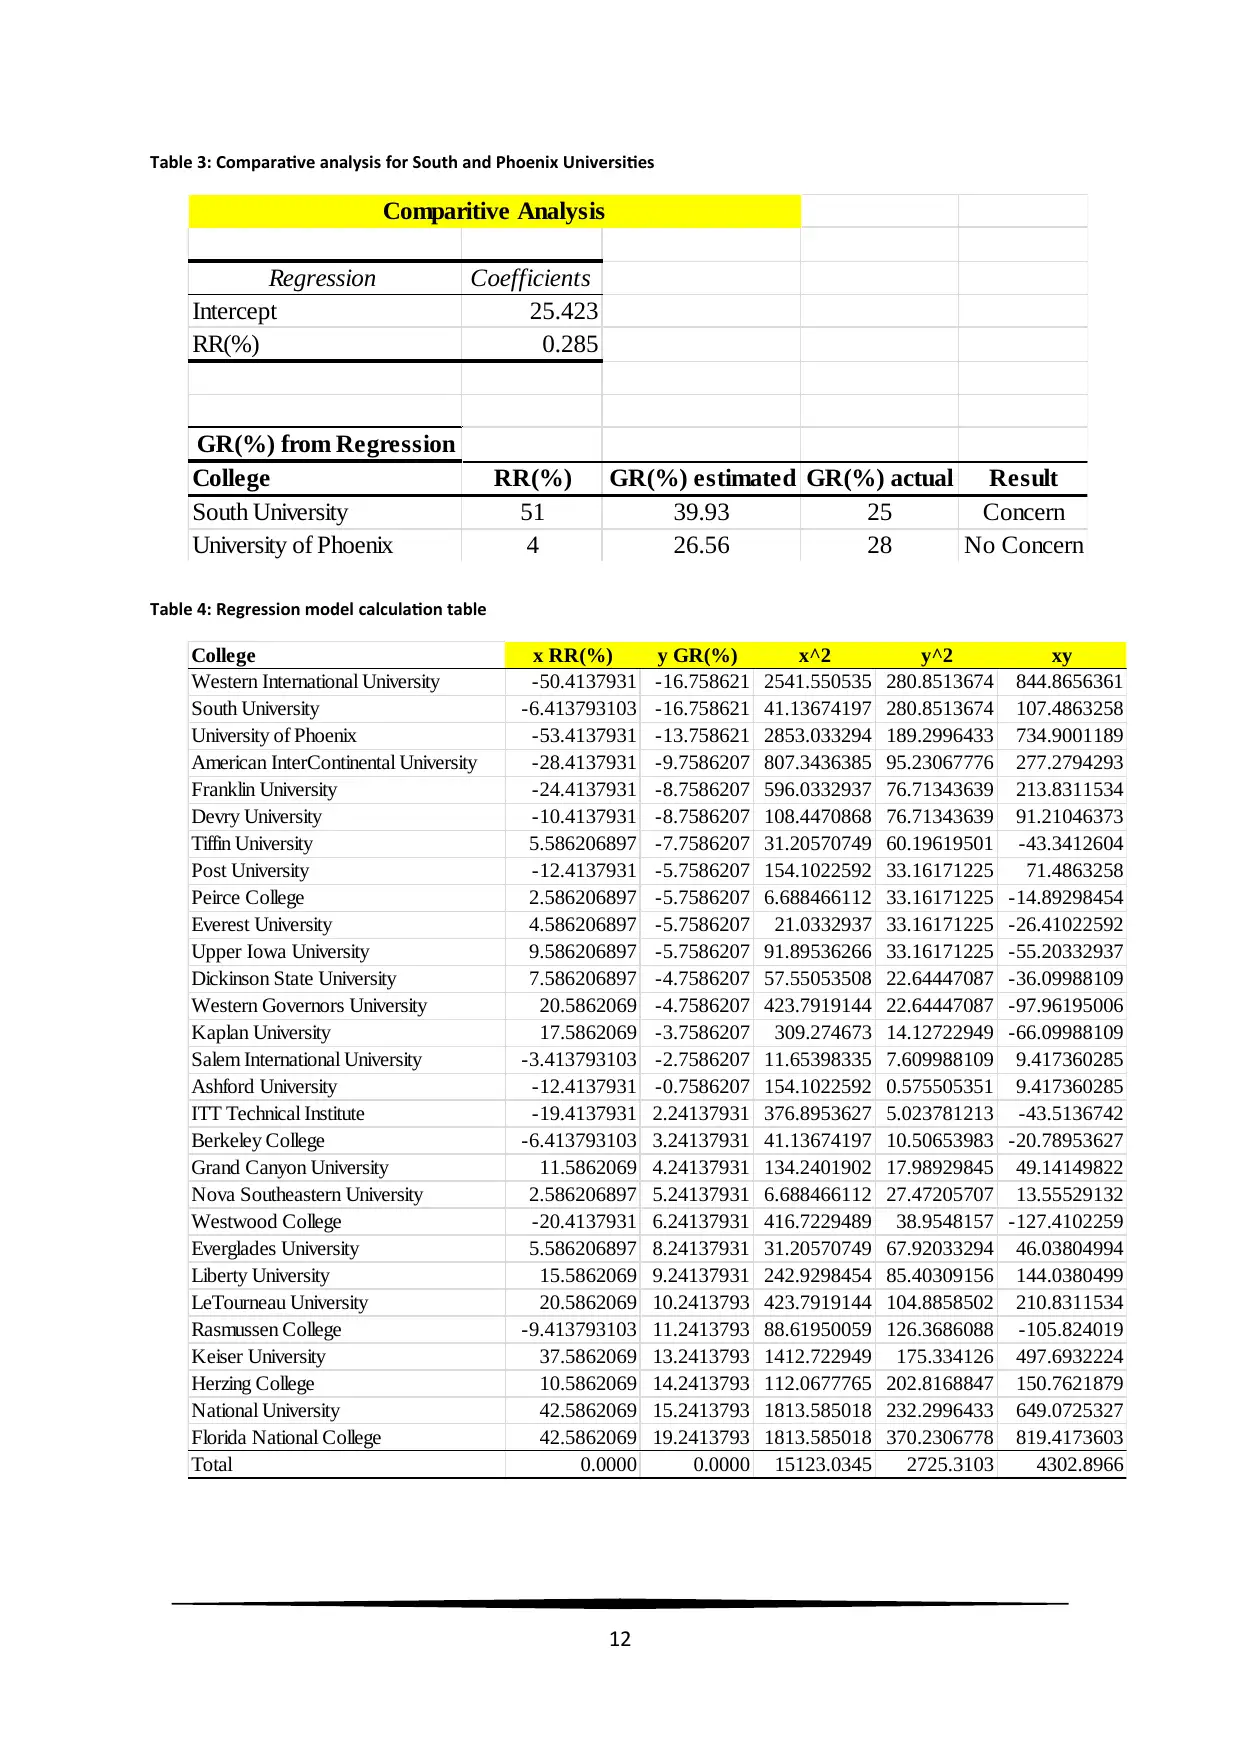
Table 3: Comparative analysis for South and Phoenix Universities
Regression Coefficients
Intercept 25.423
RR(%) 0.285
GR(%) from Regression
College RR(%) GR(%) estimated GR(%) actual Result
South University 51 39.93 25 Concern
University of Phoenix 4 26.56 28 No Concern
Comparitive Analysis
Table 4: Regression model calculation table
College x RR(%) y GR(%) x^2 y^2 xy
Western International University -50.4137931 -16.758621 2541.550535 280.8513674 844.8656361
South University -6.413793103 -16.758621 41.13674197 280.8513674 107.4863258
University of Phoenix -53.4137931 -13.758621 2853.033294 189.2996433 734.9001189
American InterContinental University -28.4137931 -9.7586207 807.3436385 95.23067776 277.2794293
Franklin University -24.4137931 -8.7586207 596.0332937 76.71343639 213.8311534
Devry University -10.4137931 -8.7586207 108.4470868 76.71343639 91.21046373
Tiffin University 5.586206897 -7.7586207 31.20570749 60.19619501 -43.3412604
Post University -12.4137931 -5.7586207 154.1022592 33.16171225 71.4863258
Peirce College 2.586206897 -5.7586207 6.688466112 33.16171225 -14.89298454
Everest University 4.586206897 -5.7586207 21.0332937 33.16171225 -26.41022592
Upper Iowa University 9.586206897 -5.7586207 91.89536266 33.16171225 -55.20332937
Dickinson State University 7.586206897 -4.7586207 57.55053508 22.64447087 -36.09988109
Western Governors University 20.5862069 -4.7586207 423.7919144 22.64447087 -97.96195006
Kaplan University 17.5862069 -3.7586207 309.274673 14.12722949 -66.09988109
Salem International University -3.413793103 -2.7586207 11.65398335 7.609988109 9.417360285
Ashford University -12.4137931 -0.7586207 154.1022592 0.575505351 9.417360285
ITT Technical Institute -19.4137931 2.24137931 376.8953627 5.023781213 -43.5136742
Berkeley College -6.413793103 3.24137931 41.13674197 10.50653983 -20.78953627
Grand Canyon University 11.5862069 4.24137931 134.2401902 17.98929845 49.14149822
Nova Southeastern University 2.586206897 5.24137931 6.688466112 27.47205707 13.55529132
Westwood College -20.4137931 6.24137931 416.7229489 38.9548157 -127.4102259
Everglades University 5.586206897 8.24137931 31.20570749 67.92033294 46.03804994
Liberty University 15.5862069 9.24137931 242.9298454 85.40309156 144.0380499
LeTourneau University 20.5862069 10.2413793 423.7919144 104.8858502 210.8311534
Rasmussen College -9.413793103 11.2413793 88.61950059 126.3686088 -105.824019
Keiser University 37.5862069 13.2413793 1412.722949 175.334126 497.6932224
Herzing College 10.5862069 14.2413793 112.0677765 202.8168847 150.7621879
National University 42.5862069 15.2413793 1813.585018 232.2996433 649.0725327
Florida National College 42.5862069 19.2413793 1813.585018 370.2306778 819.4173603
Total 0.0000 0.0000 15123.0345 2725.3103 4302.8966
12
⊘ This is a preview!⊘
Do you want full access?
Subscribe today to unlock all pages.
Trusted by 1+ million students worldwide
1 out of 12
Related Documents


Your All-in-One AI-Powered Toolkit for Academic Success.
+13062052269
info@desklib.com
Available 24*7 on WhatsApp / Email
![[object Object]](/_next/static/media/star-bottom.7253800d.svg)
Unlock your academic potential
Copyright © 2020–2026 A2Z Services. All Rights Reserved. Developed and managed by ZUCOL.