Linear Regression Report: Life Satisfaction vs GDP (ECO82001)

Verified

Added on  2022/08/14

|10
|1709
|15
Report
AI Summary
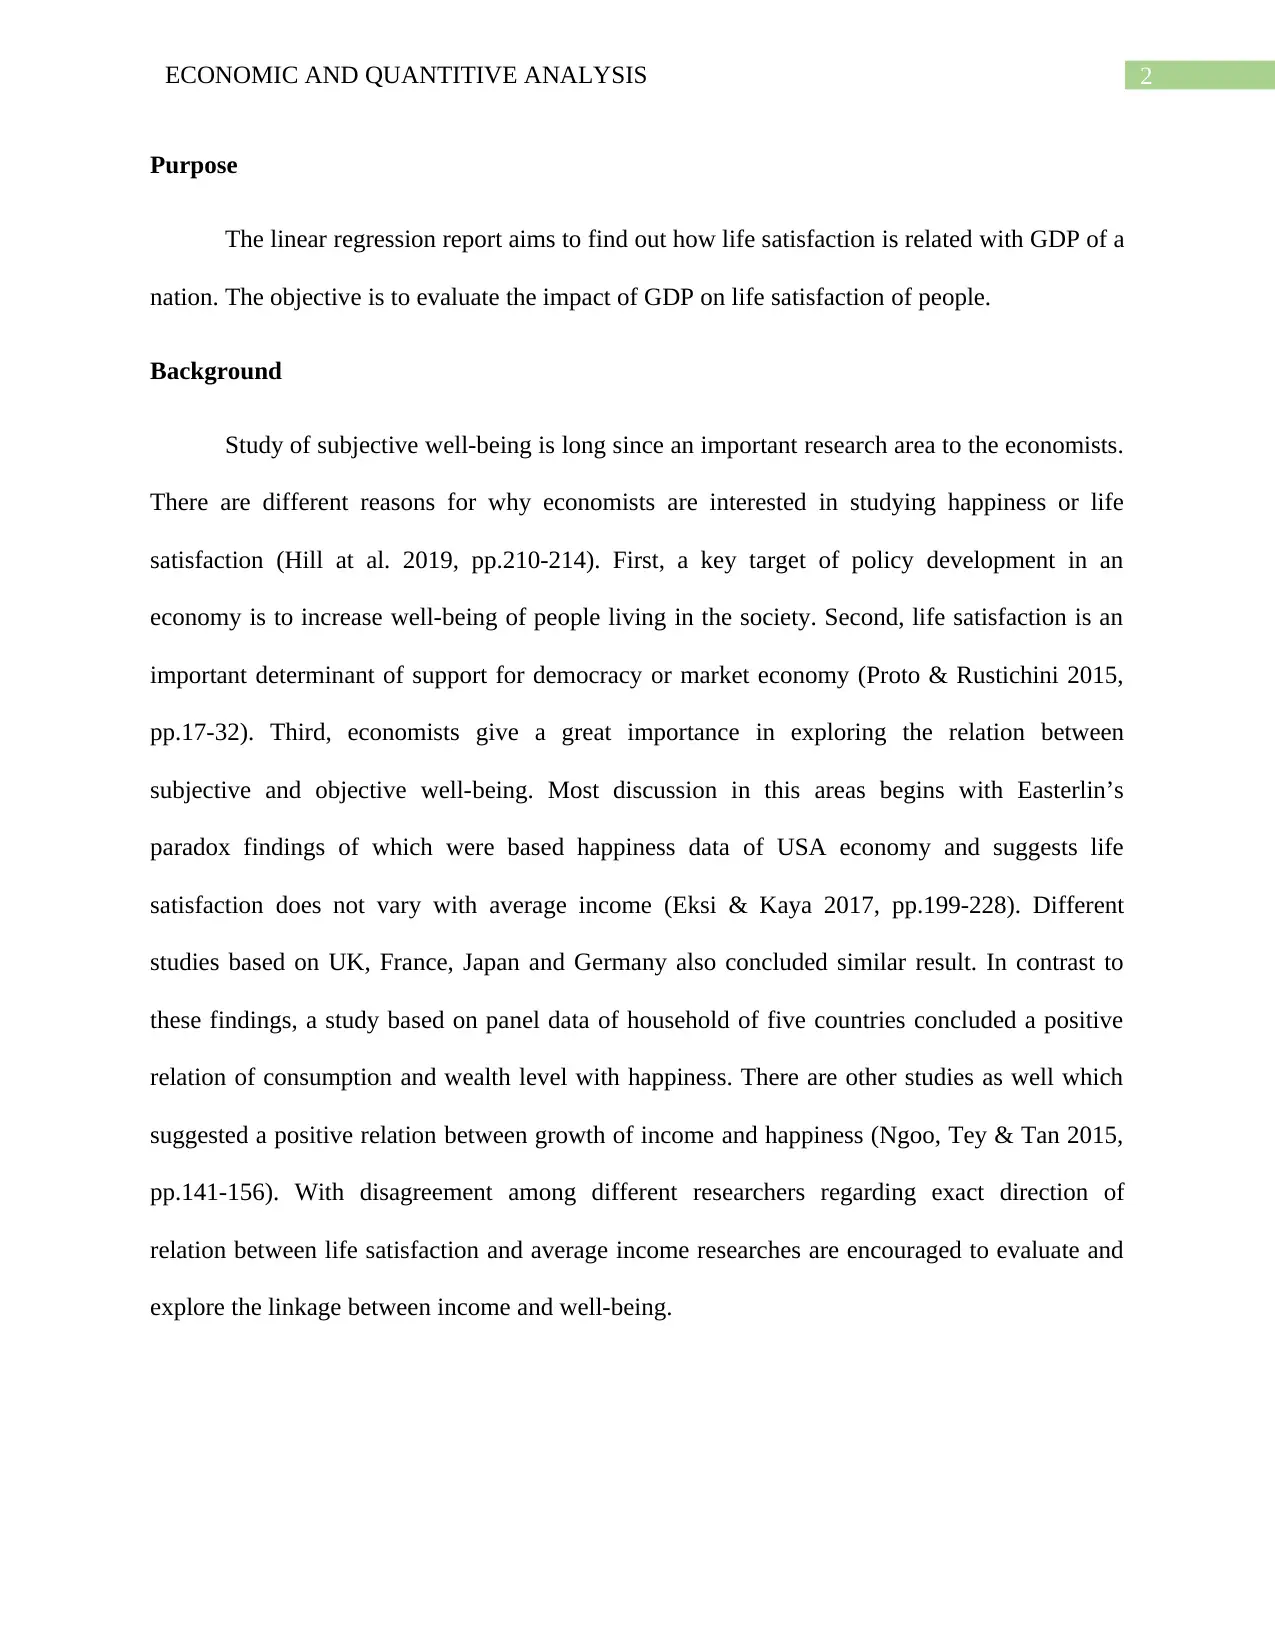
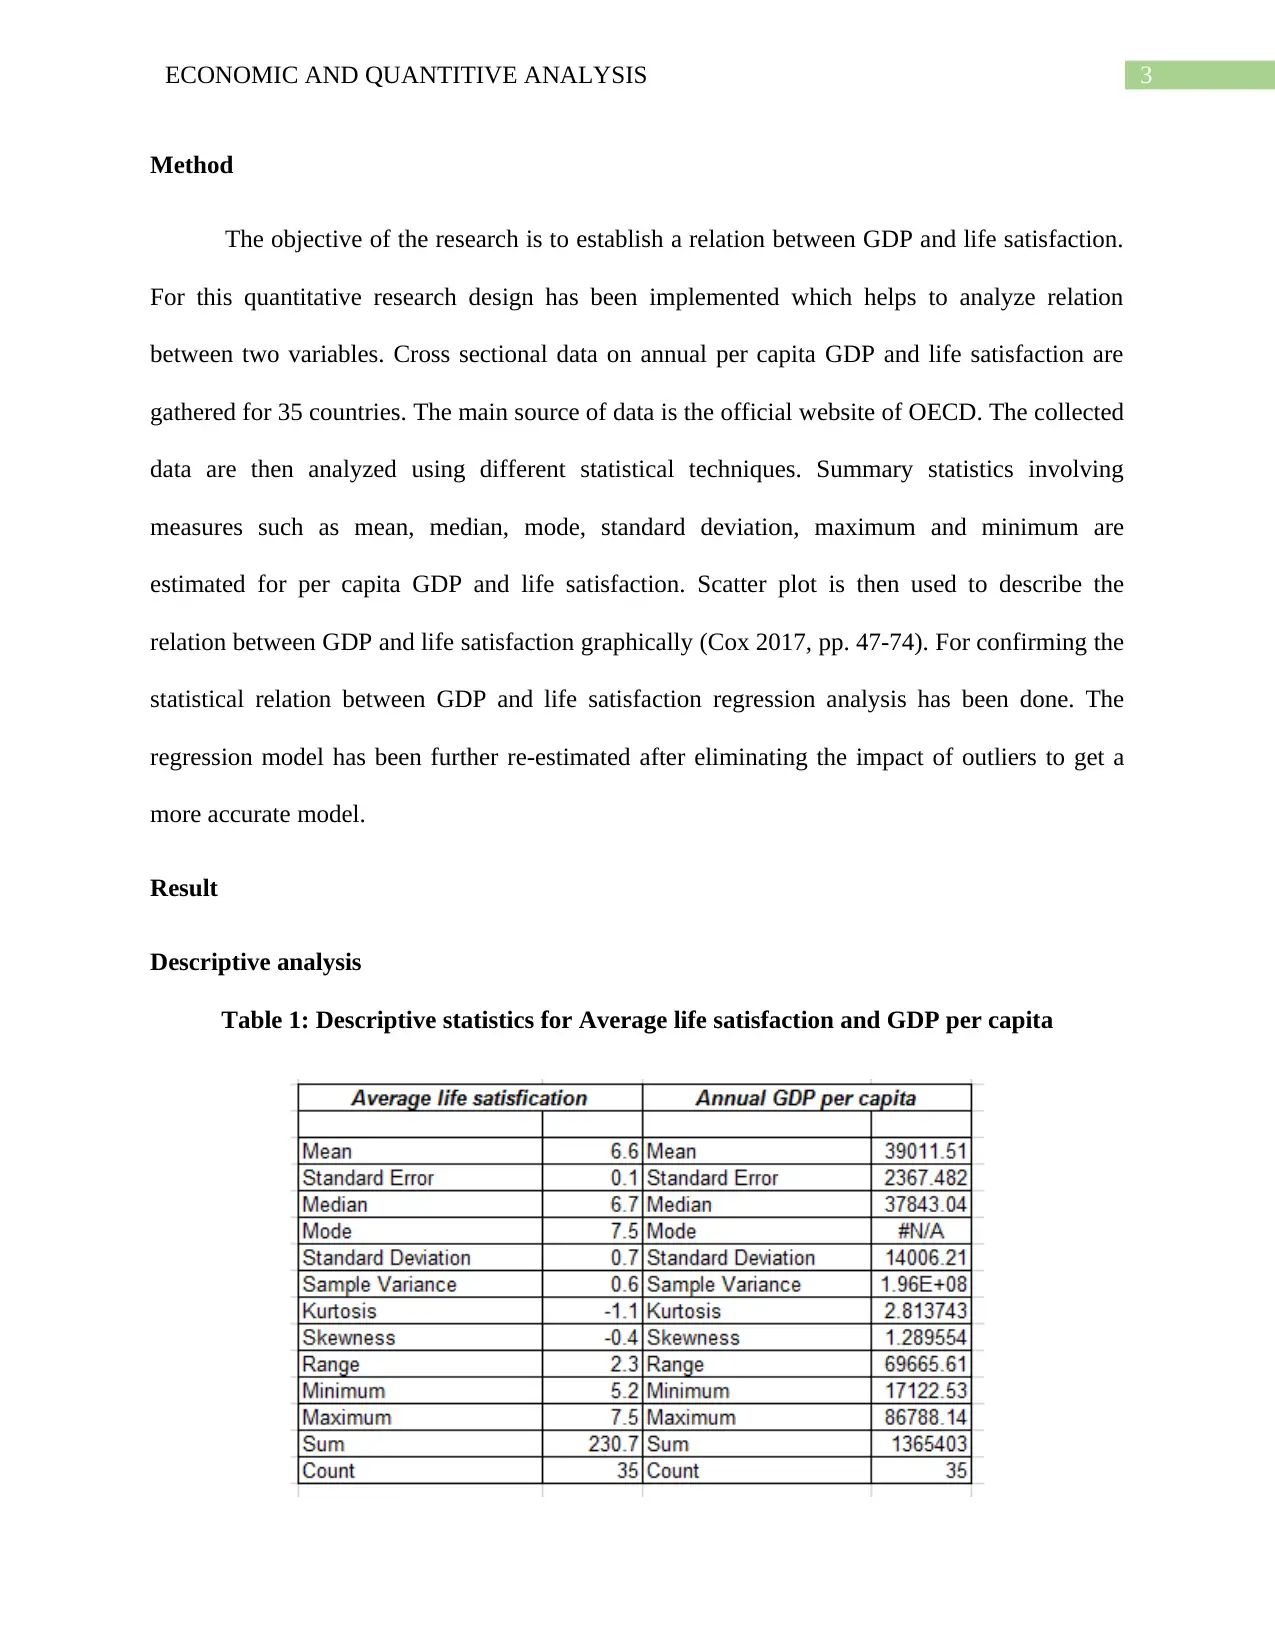
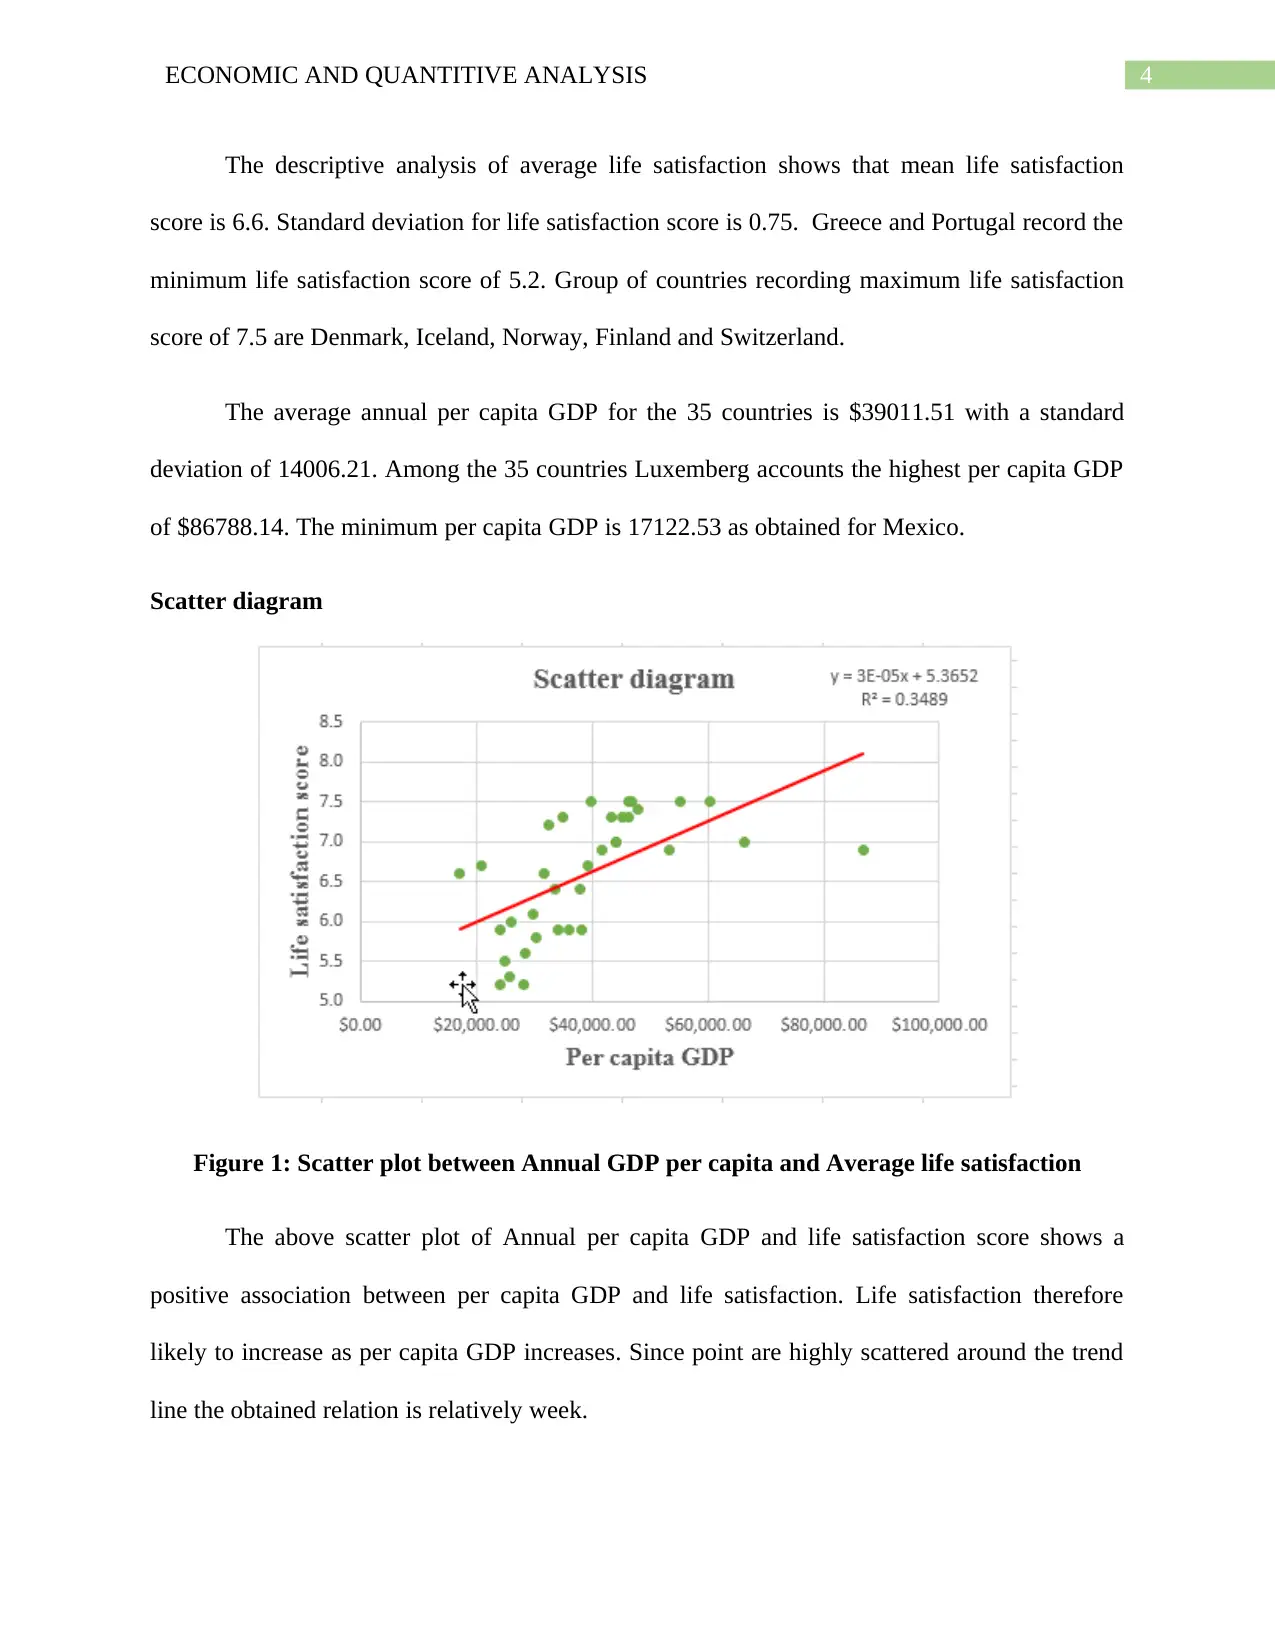
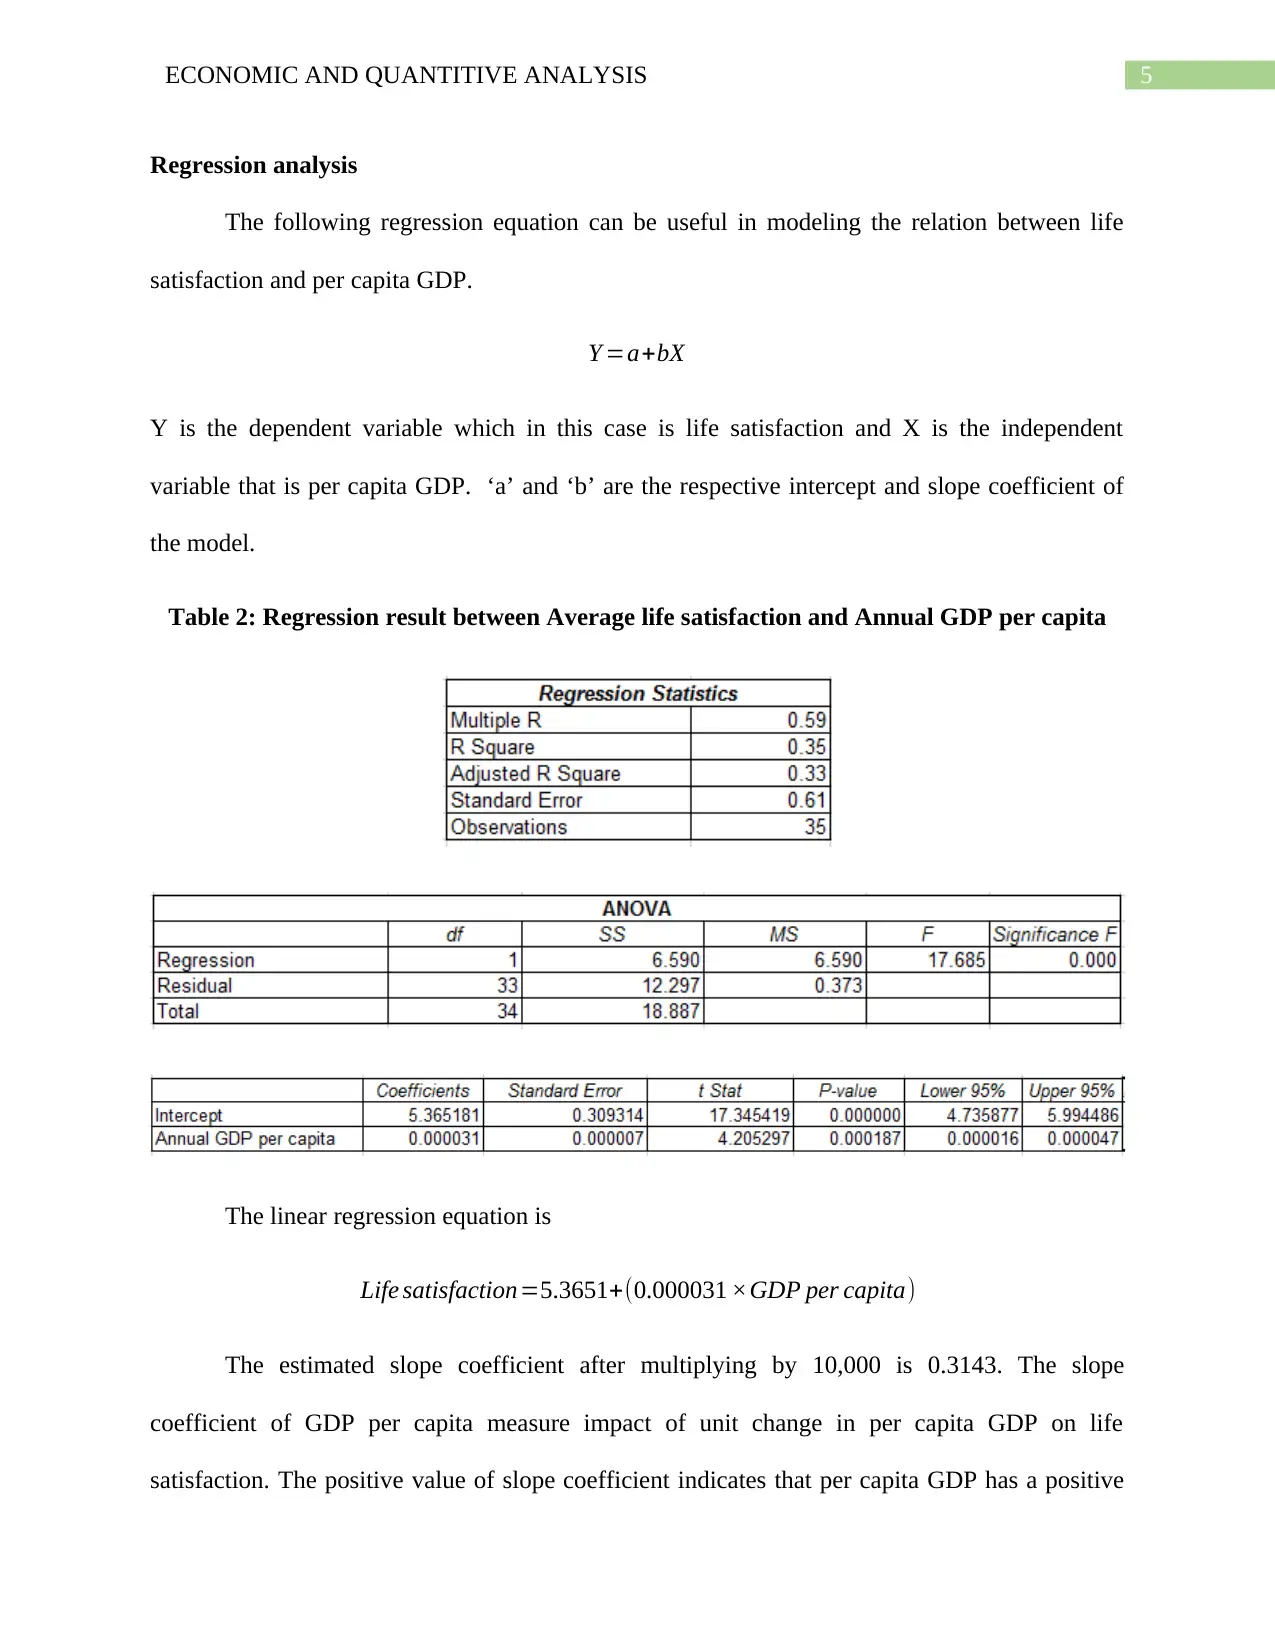
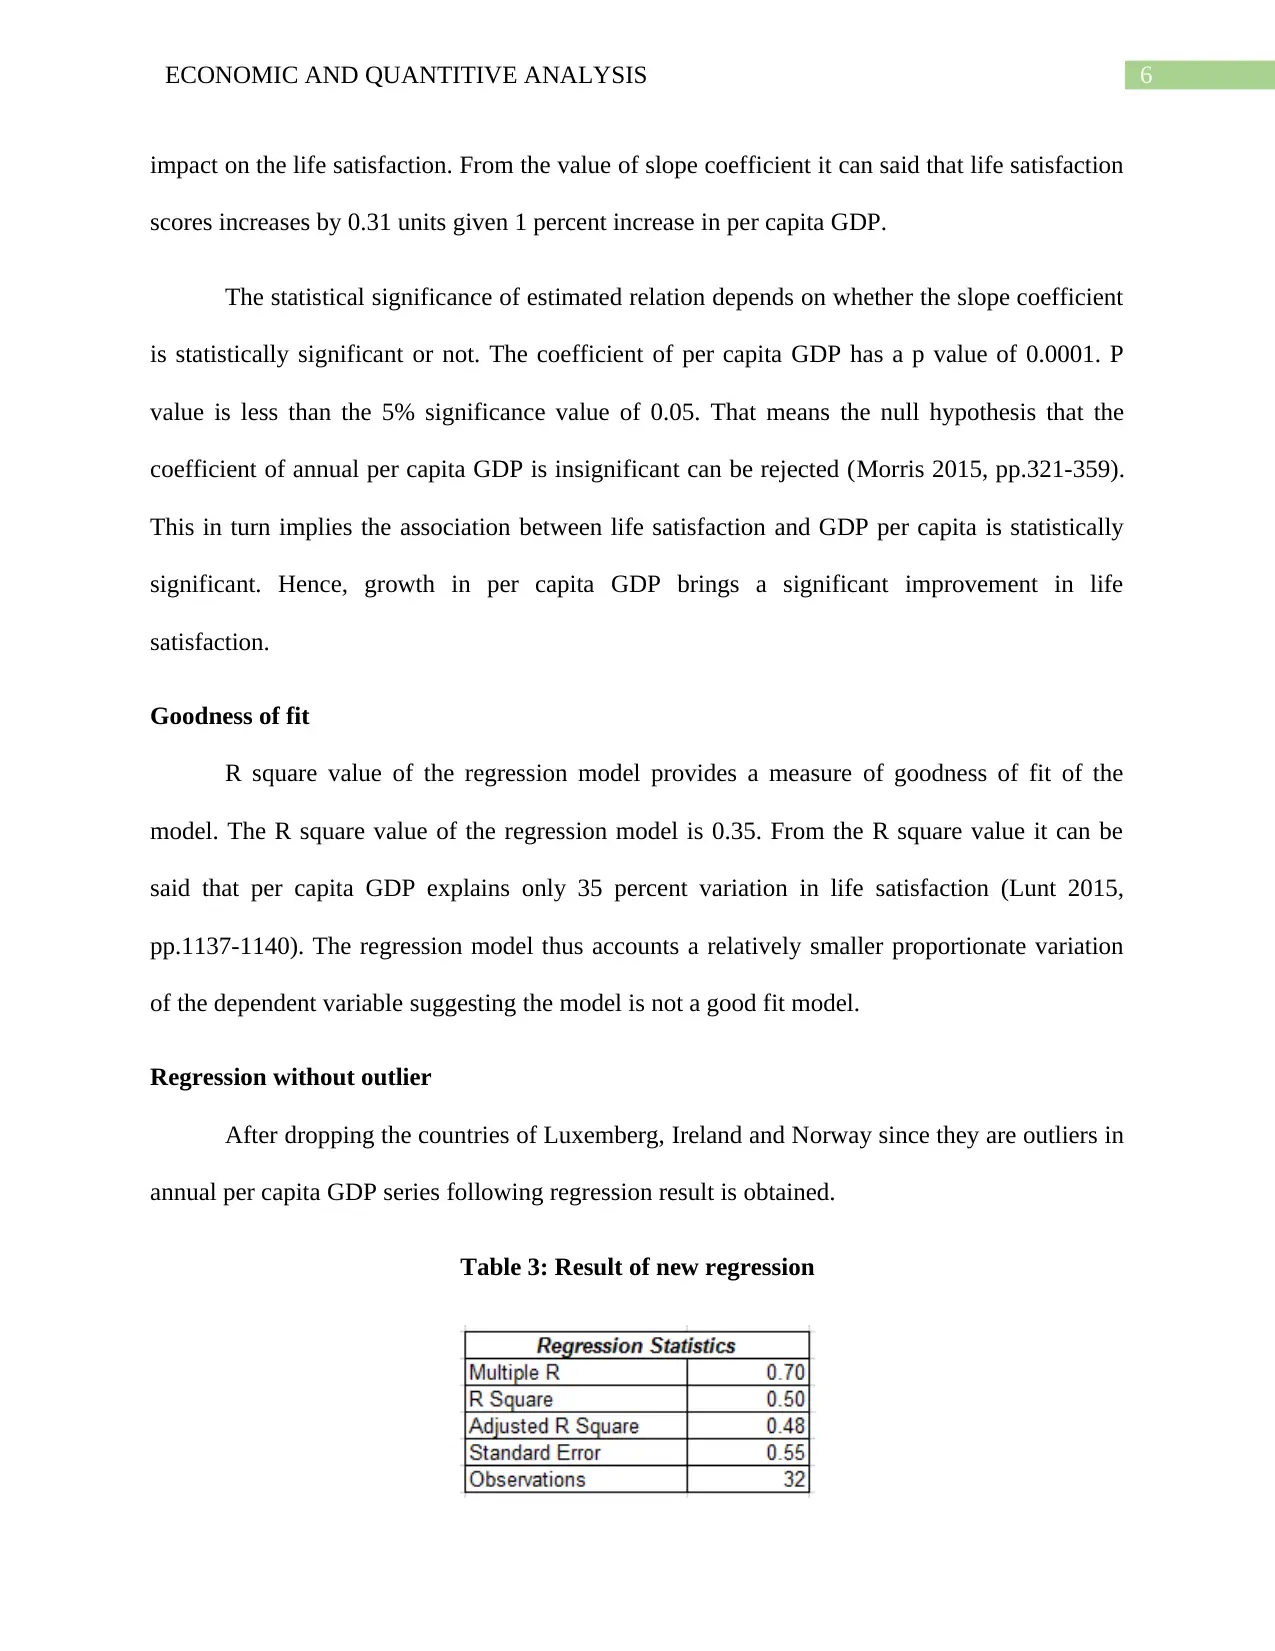
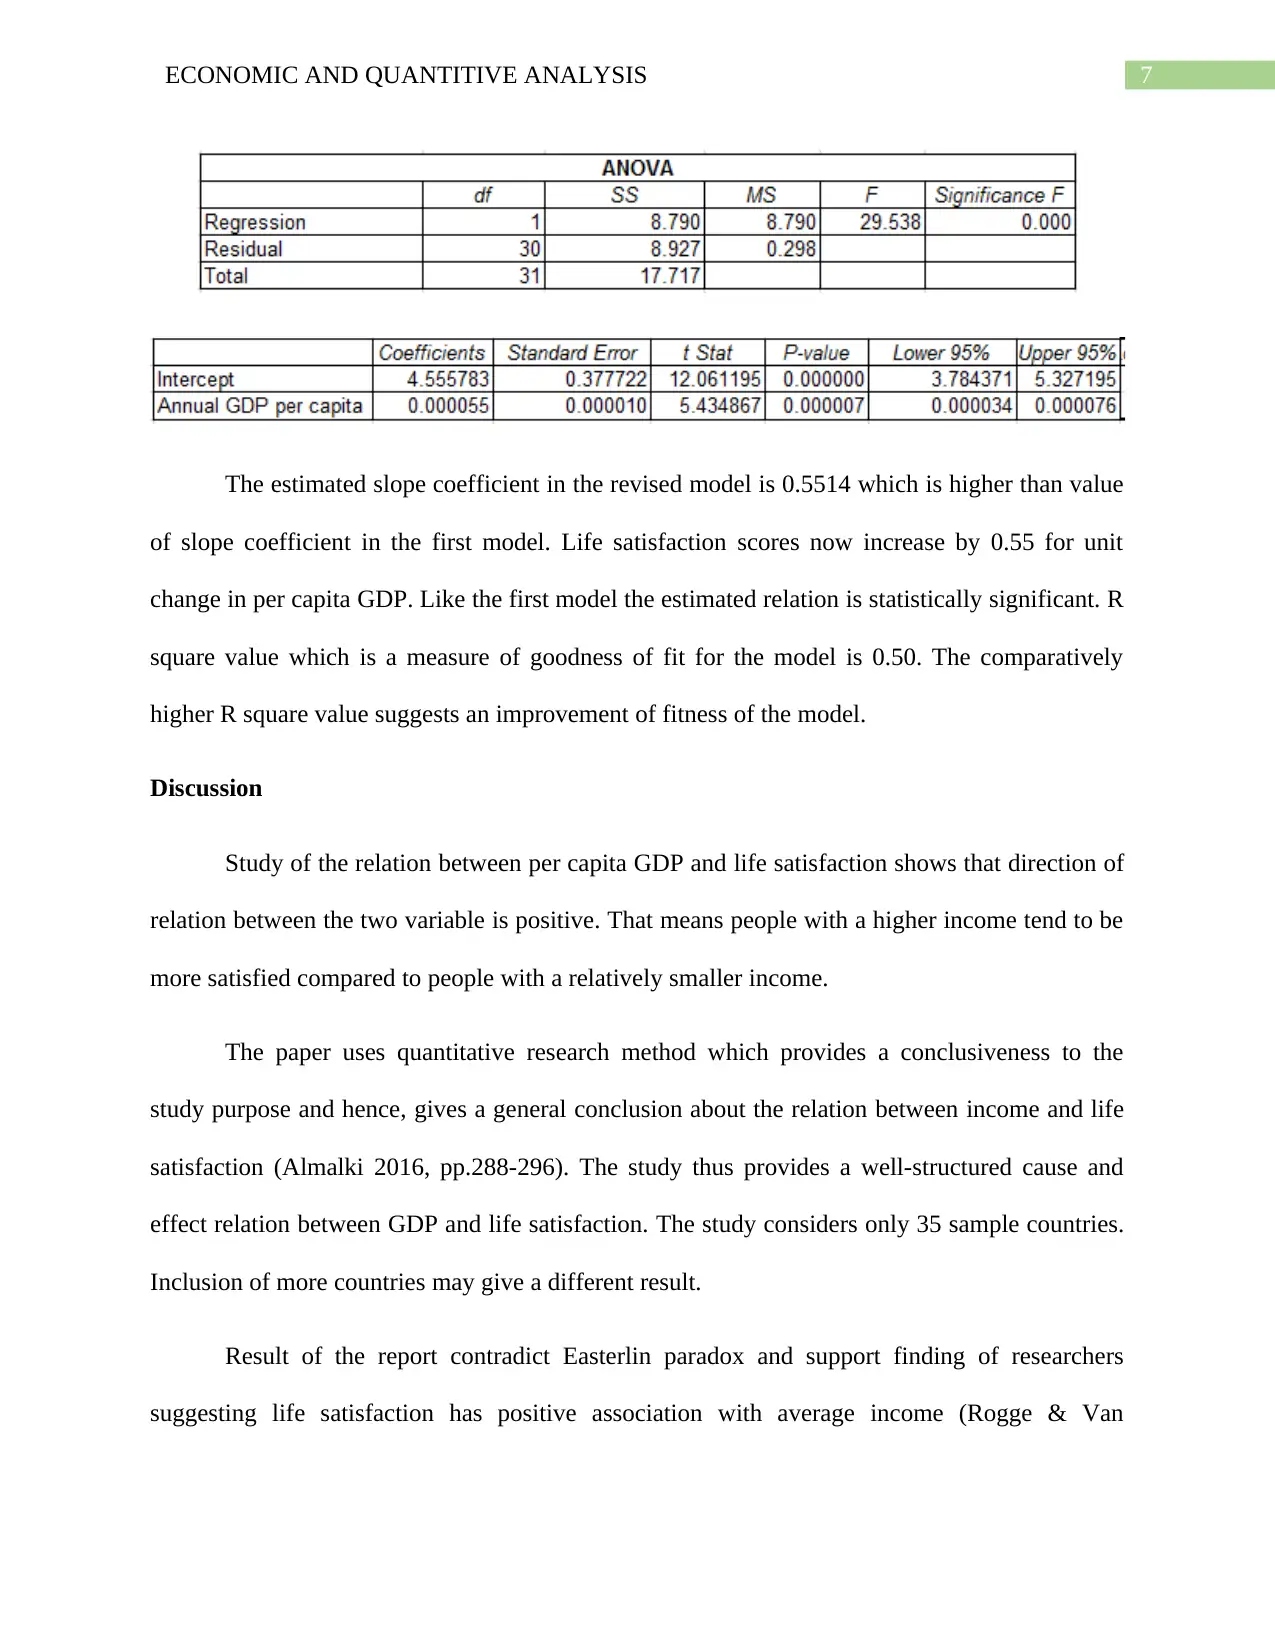
This report examines the statistical association between average life satisfaction and GDP per capita. The study utilizes cross-sectional data from 35 countries, sourced from the OECD, and employs quantitative research methods, including descriptive statistics, scatter plots, and regression analysis. The purpose is to evaluate the impact of GDP on life satisfaction, with a background discussion on economists' interest in subjective well-being and Easterlin's paradox. The results section presents descriptive analyses of both variables, including mean, standard deviation, and range, followed by scatter plots and regression models. The regression analysis reveals a positive and statistically significant relationship between per capita GDP and life satisfaction. The report also addresses goodness of fit and the impact of outliers, providing a revised regression model. The discussion section analyzes the findings in the context of existing literature, including the Easterlin paradox, and concludes with policy recommendations for promoting economic growth and improving well-being. The report suggests that governments should take policies to promote GDP, create employment opportunities, and consider factors beyond income to boost life satisfaction.
tabler-icon-diamond-filled.svg

Contribute Materials

Your contribution can guide someone’s learning journey. Share your documents today.
Document Page
Running head: ECONOMIC AND QUANTITIVE ANALYSIS
Economic and Quantitive Analysis
Name of the Student
Name of the University
Course ID
tabler-icon-diamond-filled.svg

Secure Best Marks with AI Grader

Need help grading? Try our AI Grader for instant feedback on your assignments.
Document Page
1ECONOMIC AND QUANTITIVE ANALYSIS
Table of Contents
Purpose............................................................................................................................................2
Background......................................................................................................................................2
Method.............................................................................................................................................3
Result...............................................................................................................................................3
Descriptive analysis.....................................................................................................................3
Scatter diagram............................................................................................................................4
Regression analysis......................................................................................................................5
Goodness of fit.............................................................................................................................6
Regression without outlier...........................................................................................................6
Discussion........................................................................................................................................7
Recommendation.............................................................................................................................8
Reference list...................................................................................................................................9
Document Page
2ECONOMIC AND QUANTITIVE ANALYSIS
Purpose
The linear regression report aims to find out how life satisfaction is related with GDP of a
nation. The objective is to evaluate the impact of GDP on life satisfaction of people.
Background
Study of subjective well-being is long since an important research area to the economists.
There are different reasons for why economists are interested in studying happiness or life
satisfaction (Hill at al. 2019, pp.210-214). First, a key target of policy development in an
economy is to increase well-being of people living in the society. Second, life satisfaction is an
important determinant of support for democracy or market economy (Proto & Rustichini 2015,
pp.17-32). Third, economists give a great importance in exploring the relation between
subjective and objective well-being. Most discussion in this areas begins with Easterlin’s
paradox findings of which were based happiness data of USA economy and suggests life
satisfaction does not vary with average income (Eksi & Kaya 2017, pp.199-228). Different
studies based on UK, France, Japan and Germany also concluded similar result. In contrast to
these findings, a study based on panel data of household of five countries concluded a positive
relation of consumption and wealth level with happiness. There are other studies as well which
suggested a positive relation between growth of income and happiness (Ngoo, Tey & Tan 2015,
pp.141-156). With disagreement among different researchers regarding exact direction of
relation between life satisfaction and average income researches are encouraged to evaluate and
explore the linkage between income and well-being.
Document Page
3ECONOMIC AND QUANTITIVE ANALYSIS
Method
The objective of the research is to establish a relation between GDP and life satisfaction.
For this quantitative research design has been implemented which helps to analyze relation
between two variables. Cross sectional data on annual per capita GDP and life satisfaction are
gathered for 35 countries. The main source of data is the official website of OECD. The collected
data are then analyzed using different statistical techniques. Summary statistics involving
measures such as mean, median, mode, standard deviation, maximum and minimum are
estimated for per capita GDP and life satisfaction. Scatter plot is then used to describe the
relation between GDP and life satisfaction graphically (Cox 2017, pp. 47-74). For confirming the
statistical relation between GDP and life satisfaction regression analysis has been done. The
regression model has been further re-estimated after eliminating the impact of outliers to get a
more accurate model.
Result
Descriptive analysis
Table 1: Descriptive statistics for Average life satisfaction and GDP per capita
tabler-icon-diamond-filled.svg

Secure Best Marks with AI Grader

Need help grading? Try our AI Grader for instant feedback on your assignments.
Document Page
4ECONOMIC AND QUANTITIVE ANALYSIS
The descriptive analysis of average life satisfaction shows that mean life satisfaction
score is 6.6. Standard deviation for life satisfaction score is 0.75. Greece and Portugal record the
minimum life satisfaction score of 5.2. Group of countries recording maximum life satisfaction
score of 7.5 are Denmark, Iceland, Norway, Finland and Switzerland.
The average annual per capita GDP for the 35 countries is $39011.51 with a standard
deviation of 14006.21. Among the 35 countries Luxemberg accounts the highest per capita GDP
of $86788.14. The minimum per capita GDP is 17122.53 as obtained for Mexico.
Scatter diagram
Figure 1: Scatter plot between Annual GDP per capita and Average life satisfaction
The above scatter plot of Annual per capita GDP and life satisfaction score shows a
positive association between per capita GDP and life satisfaction. Life satisfaction therefore
likely to increase as per capita GDP increases. Since point are highly scattered around the trend
line the obtained relation is relatively week.
Document Page
5ECONOMIC AND QUANTITIVE ANALYSIS
Regression analysis
The following regression equation can be useful in modeling the relation between life
satisfaction and per capita GDP.
Y =a+bX
Y is the dependent variable which in this case is life satisfaction and X is the independent
variable that is per capita GDP. ‘a’ and ‘b’ are the respective intercept and slope coefficient of
the model.
Table 2: Regression result between Average life satisfaction and Annual GDP per capita
The linear regression equation is
Life satisfaction=5.3651+(0.000031 ×GDP per capita)
The estimated slope coefficient after multiplying by 10,000 is 0.3143. The slope
coefficient of GDP per capita measure impact of unit change in per capita GDP on life
satisfaction. The positive value of slope coefficient indicates that per capita GDP has a positive
Document Page
6ECONOMIC AND QUANTITIVE ANALYSIS
impact on the life satisfaction. From the value of slope coefficient it can said that life satisfaction
scores increases by 0.31 units given 1 percent increase in per capita GDP.
The statistical significance of estimated relation depends on whether the slope coefficient
is statistically significant or not. The coefficient of per capita GDP has a p value of 0.0001. P
value is less than the 5% significance value of 0.05. That means the null hypothesis that the
coefficient of annual per capita GDP is insignificant can be rejected (Morris 2015, pp.321-359).
This in turn implies the association between life satisfaction and GDP per capita is statistically
significant. Hence, growth in per capita GDP brings a significant improvement in life
satisfaction.
Goodness of fit
R square value of the regression model provides a measure of goodness of fit of the
model. The R square value of the regression model is 0.35. From the R square value it can be
said that per capita GDP explains only 35 percent variation in life satisfaction (Lunt 2015,
pp.1137-1140). The regression model thus accounts a relatively smaller proportionate variation
of the dependent variable suggesting the model is not a good fit model.
Regression without outlier
After dropping the countries of Luxemberg, Ireland and Norway since they are outliers in
annual per capita GDP series following regression result is obtained.
Table 3: Result of new regression
tabler-icon-diamond-filled.svg

Paraphrase This Document

Need a fresh take? Get an instant paraphrase of this document with our AI Paraphraser
Document Page
7ECONOMIC AND QUANTITIVE ANALYSIS
The estimated slope coefficient in the revised model is 0.5514 which is higher than value
of slope coefficient in the first model. Life satisfaction scores now increase by 0.55 for unit
change in per capita GDP. Like the first model the estimated relation is statistically significant. R
square value which is a measure of goodness of fit for the model is 0.50. The comparatively
higher R square value suggests an improvement of fitness of the model.
Discussion
Study of the relation between per capita GDP and life satisfaction shows that direction of
relation between the two variable is positive. That means people with a higher income tend to be
more satisfied compared to people with a relatively smaller income.
The paper uses quantitative research method which provides a conclusiveness to the
study purpose and hence, gives a general conclusion about the relation between income and life
satisfaction (Almalki 2016, pp.288-296). The study thus provides a well-structured cause and
effect relation between GDP and life satisfaction. The study considers only 35 sample countries.
Inclusion of more countries may give a different result.
Result of the report contradict Easterlin paradox and support finding of researchers
suggesting life satisfaction has positive association with average income (Rogge & Van
Document Page
8ECONOMIC AND QUANTITIVE ANALYSIS
Nijverseel 2019, pp.765-789). The result thus clearly indicates policies supporting income
growth are likely to increase life satisfaction.
Recommendation
Depending on finding of the paper policy recommendations can be made to boost life
satisfaction. Since income has found to have a positive relation with life satisfaction government
should take policies to promote GDP. An obvious way to increase economic growth is make
investment to boost productivity such as investment in infrastructure, innovation and research
and development. Secondly, government should create employment opportunities which can be
helpful for economic growth and life satisfaction. Thirdly, policymakers should consider the fact
that income is not the only factor that affects life satisfaction. Focus should also be given to
improve other aspects of well-being to boost life satisfaction.
Document Page
9ECONOMIC AND QUANTITIVE ANALYSIS
Reference list
Almalki, S., 2016. Integrating Quantitative and Qualitative Data in Mixed Methods Research--
Challenges and Benefits. Journal of education and learning, 5(3), pp.288-296.
Cox, V., 2017. Exploratory data analysis. In Translating Statistics to Make Decisions (pp. 47-
74). Apress, Berkeley, CA.
Eksi, O. & Kaya, N., 2017. Life satisfaction and keeping up with other countries. Journal of
Happiness Studies, 18(1), pp.199-228.
Hill, P.L., Cheung, F., Kube, A. & Burrow, A.L., 2019. Life engagement is associated with
higher GDP among societies. Journal of Research in Personality, 78, pp.210-214.
Lunt, M., 2015. Introduction to statistical modelling: linear regression. Rheumatology, 54(7),
pp.1137-1140.
Morris, J.S., 2015. Functional regression. Annual Review of Statistics and Its Application, 2,
pp.321-359.
Ngoo, Y.T., Tey, N.P. & Tan, E.C., 2015. Determinants of life satisfaction in Asia. Social
Indicators Research, 124(1), pp.141-156.
Proto, E. & Rustichini, A., 2015. Life satisfaction, income and personality. Journal of Economic
Psychology, 48, pp.17-32.
Rogge, N. & Van Nijverseel, I., 2019. Quality of life in the European Union: A multidimensional
analysis. Social Indicators Research, 141(2), pp.765-789.
chevron_up_icon
1 out of 10
circle_padding
hide_on_mobile
zoom_out_icon
logo.png

Your All-in-One AI-Powered Toolkit for Academic Success.

Available 24*7 on WhatsApp / Email

[object Object]