Economics Report: Linear Regression Analysis of Graduation Rates
VerifiedAdded on 2023/04/20
|9
|1631
|420
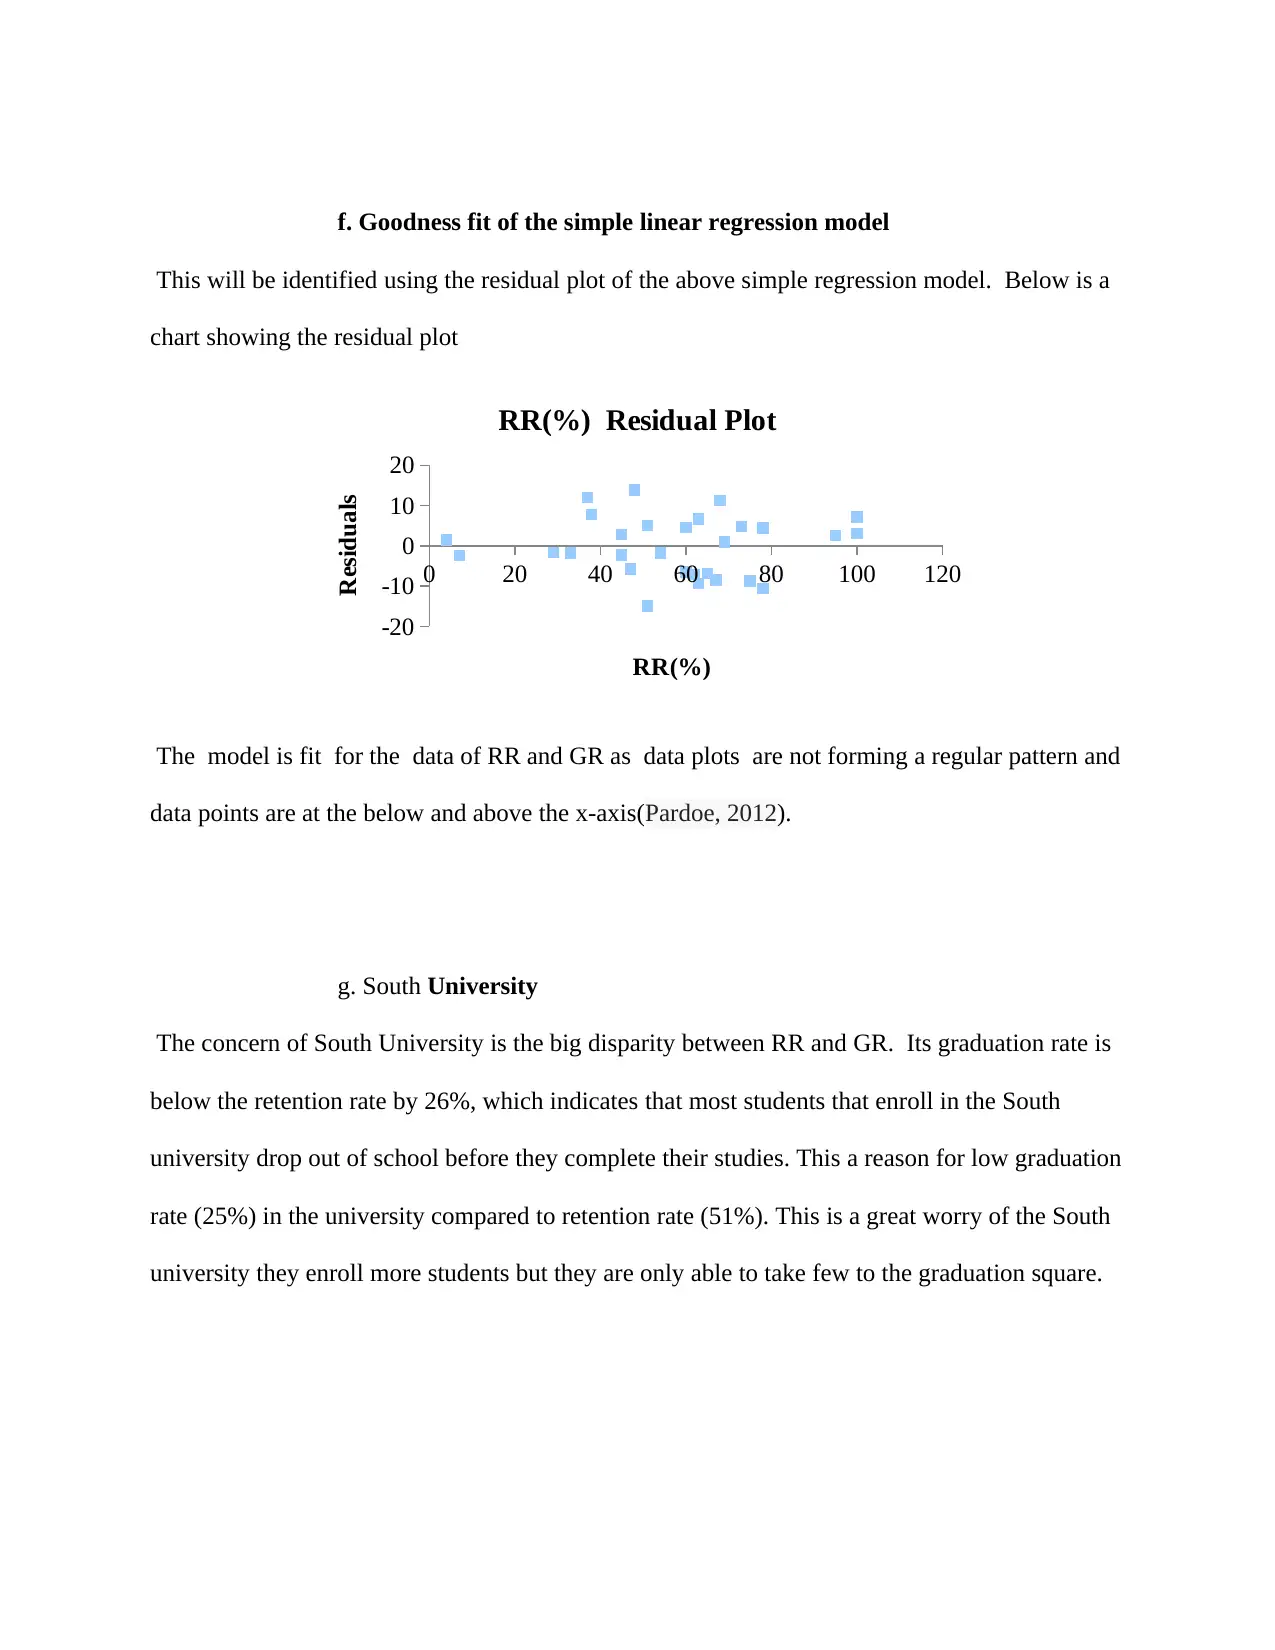
Report
AI Summary
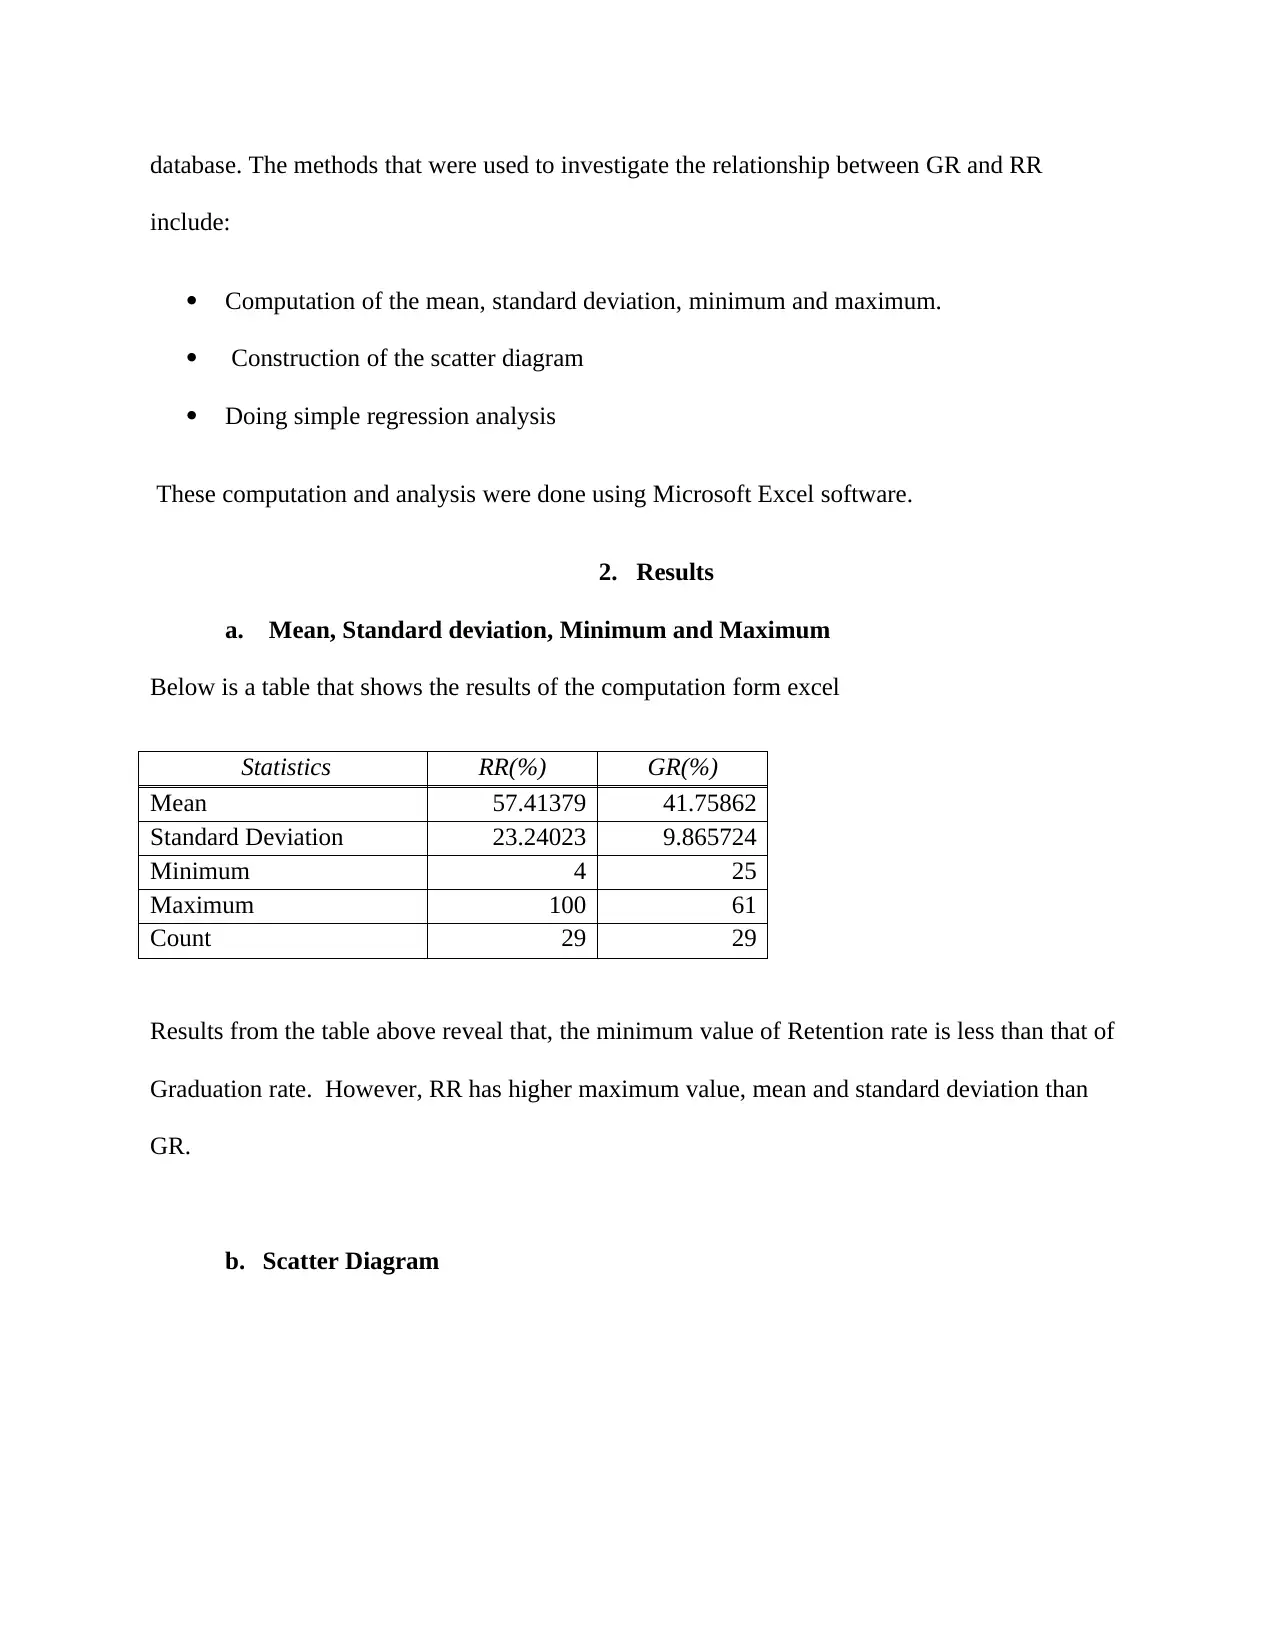
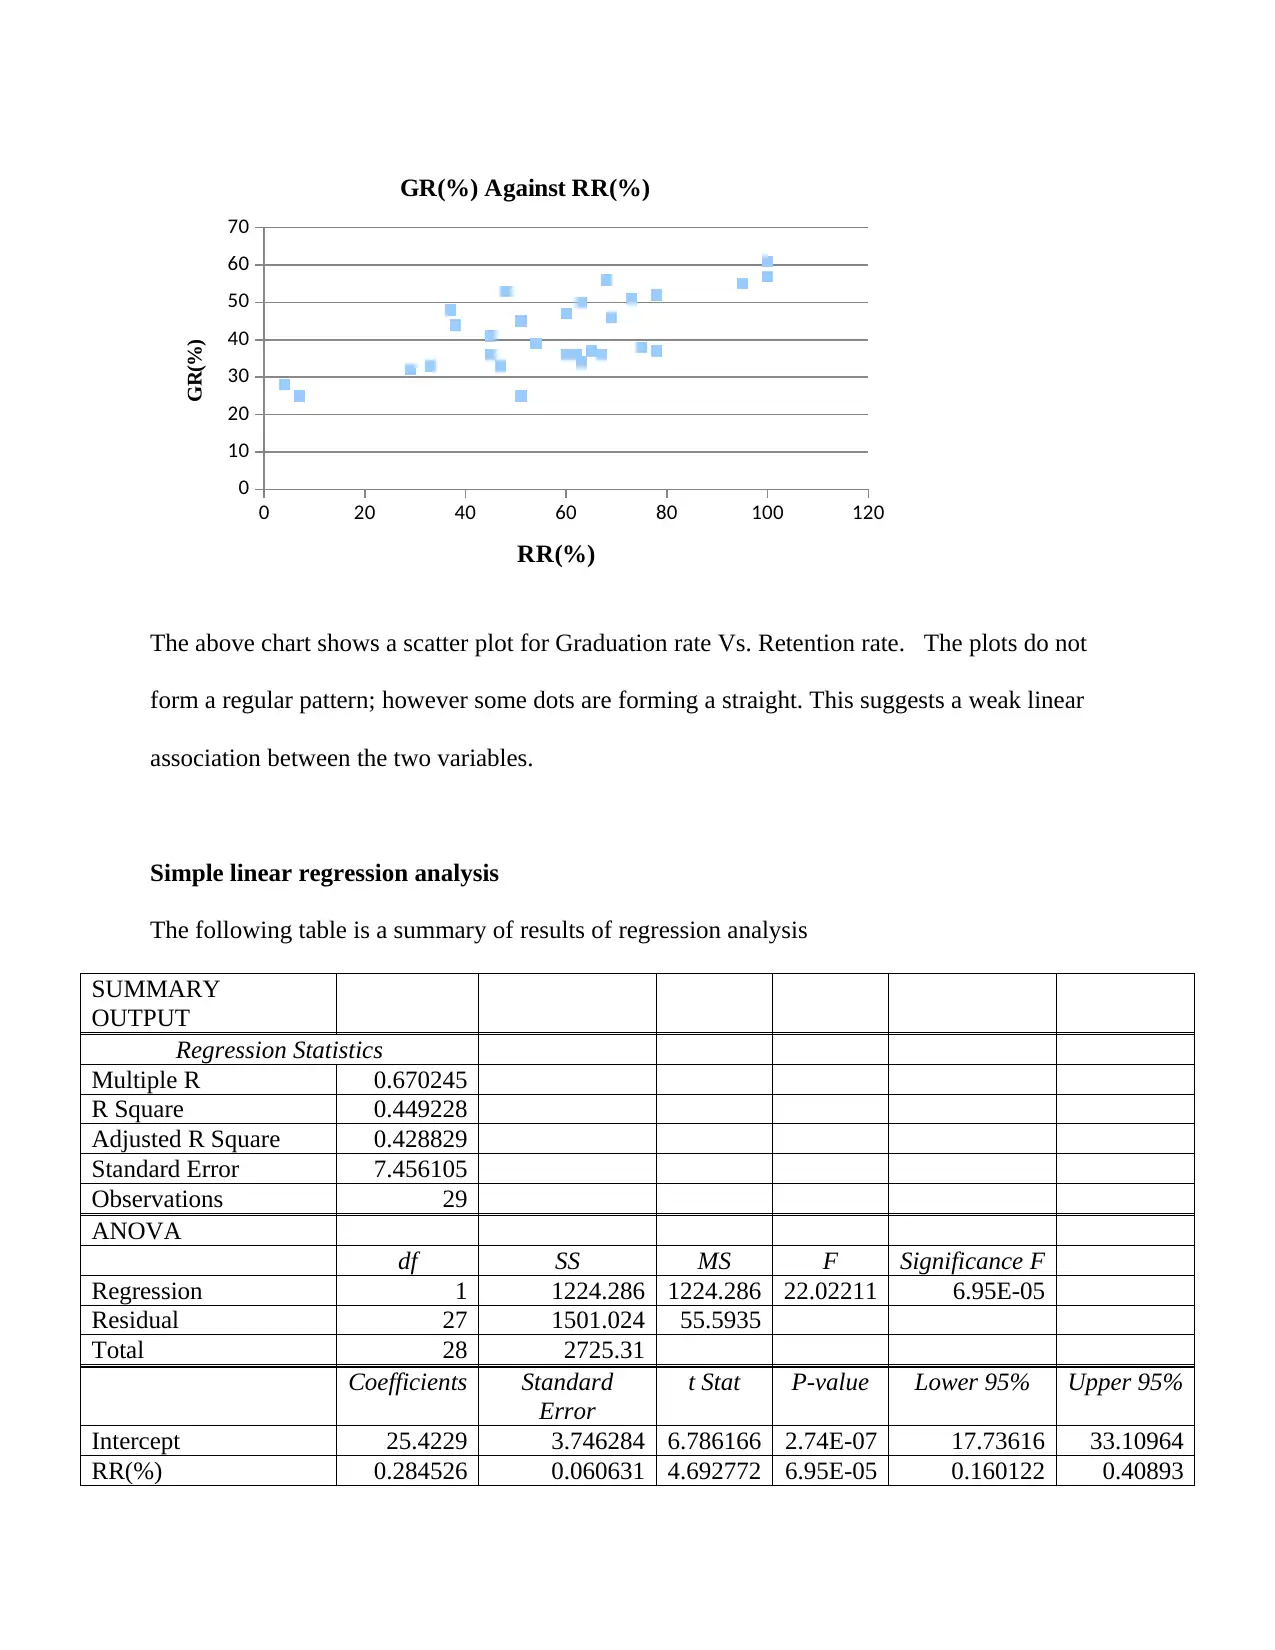
This report investigates the relationship between graduation rates (GR) and retention rates (RR) in higher education using simple linear regression analysis. The data, sourced from an online education database, includes GR and RR data from 29 different institutions. The analysis involves computing descriptive statistics, constructing a scatter diagram, and performing regression analysis using Microsoft Excel. The results indicate a weak positive linear association between RR and GR, with a correlation coefficient of 0.67. The estimated regression equation is Y = 0.285X + 25.423, where Y represents the graduation rate and X represents the retention rate. The slope coefficient suggests that for every 1% increase in retention rate, the graduation rate increases by 0.285%. The report also discusses the statistical significance and goodness of fit of the regression model, highlighting concerns for South University and the University of Phoenix based on their respective RR and GR. The report recommends that institutions adopt multiple regression models to incorporate more factors influencing graduation rates and introduce programs to improve student retention.
1 out of 9
Related Documents


Your All-in-One AI-Powered Toolkit for Academic Success.
+13062052269
info@desklib.com
Available 24*7 on WhatsApp / Email
![[object Object]](/_next/static/media/star-bottom.7253800d.svg)
Copyright © 2020–2026 A2Z Services. All Rights Reserved. Developed and managed by ZUCOL.