Regression Analysis: Impact of Retention on Graduation Rates

Verified

Added on  2023/04/21

|14
|2258
|256
Report
AI Summary
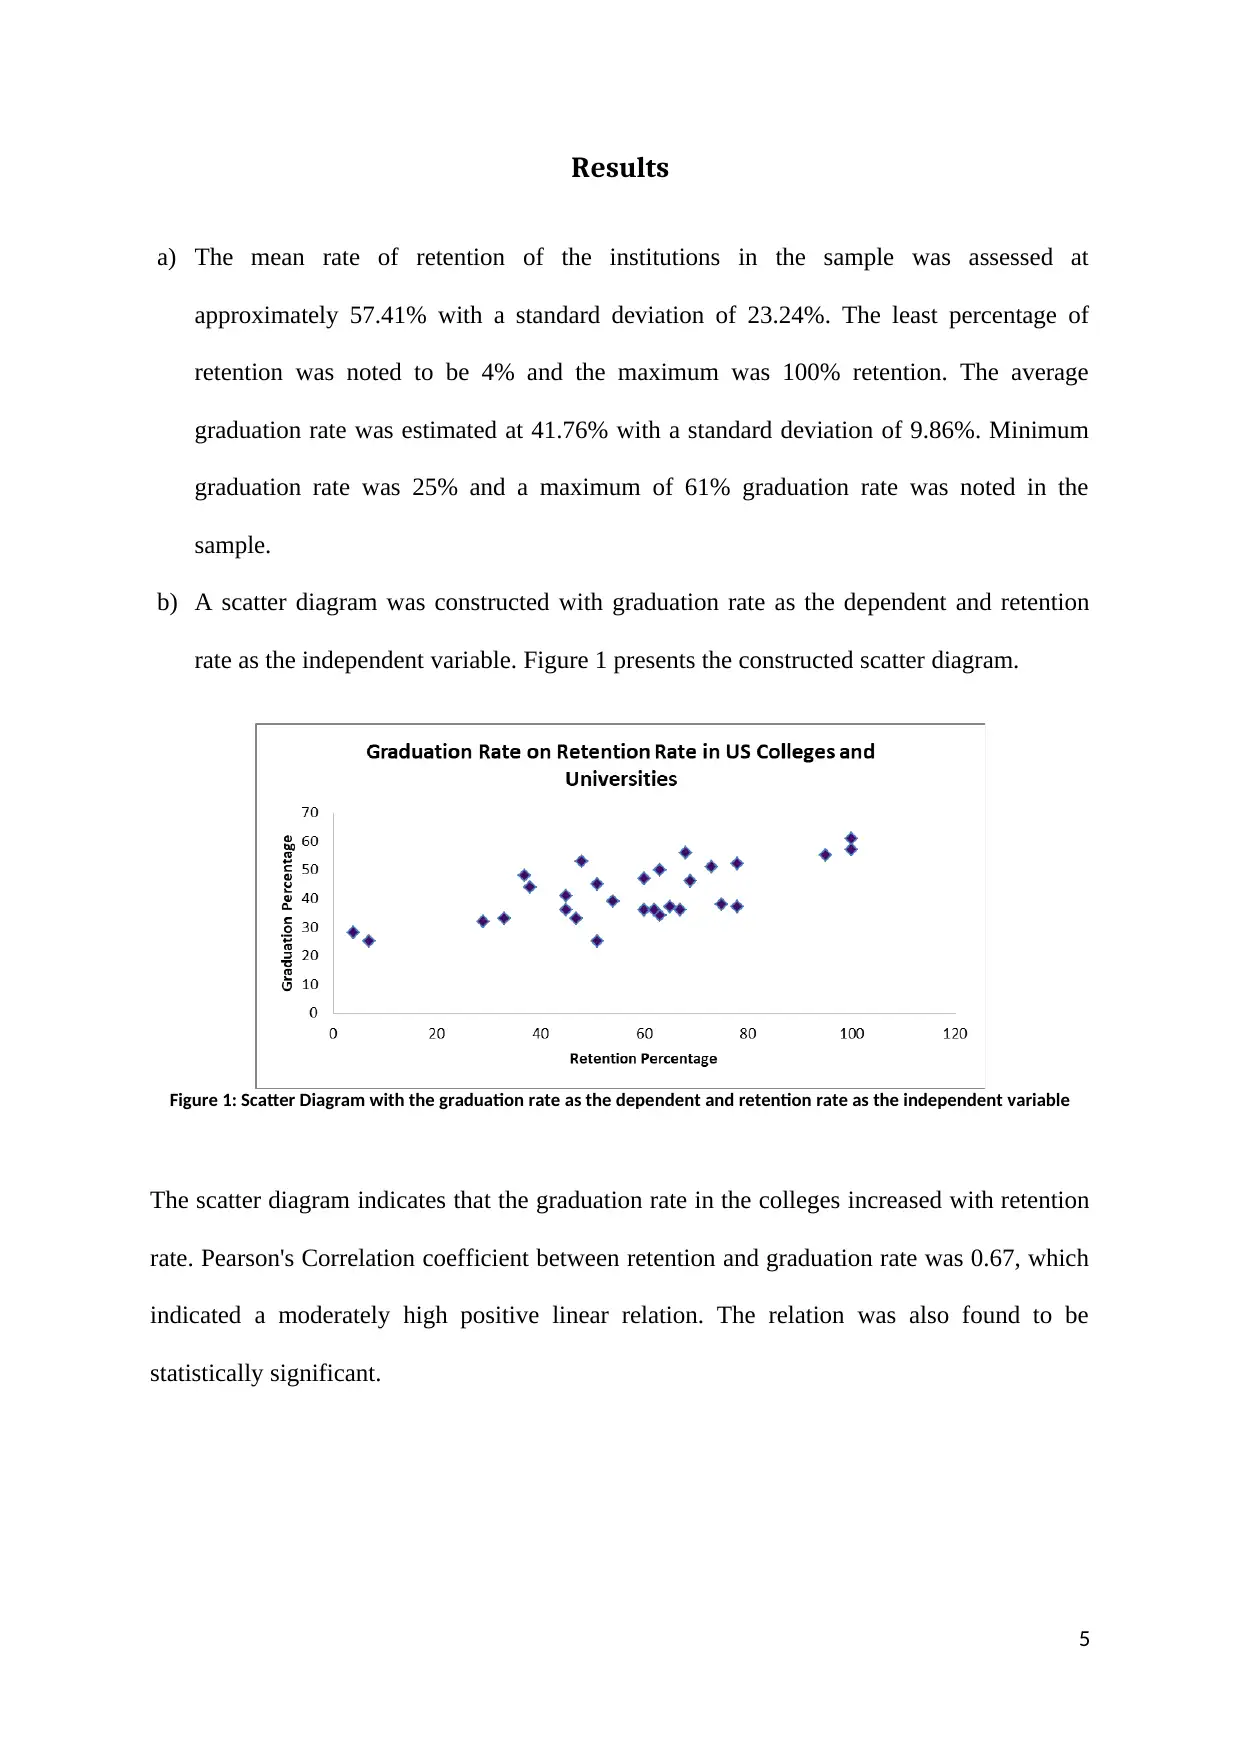
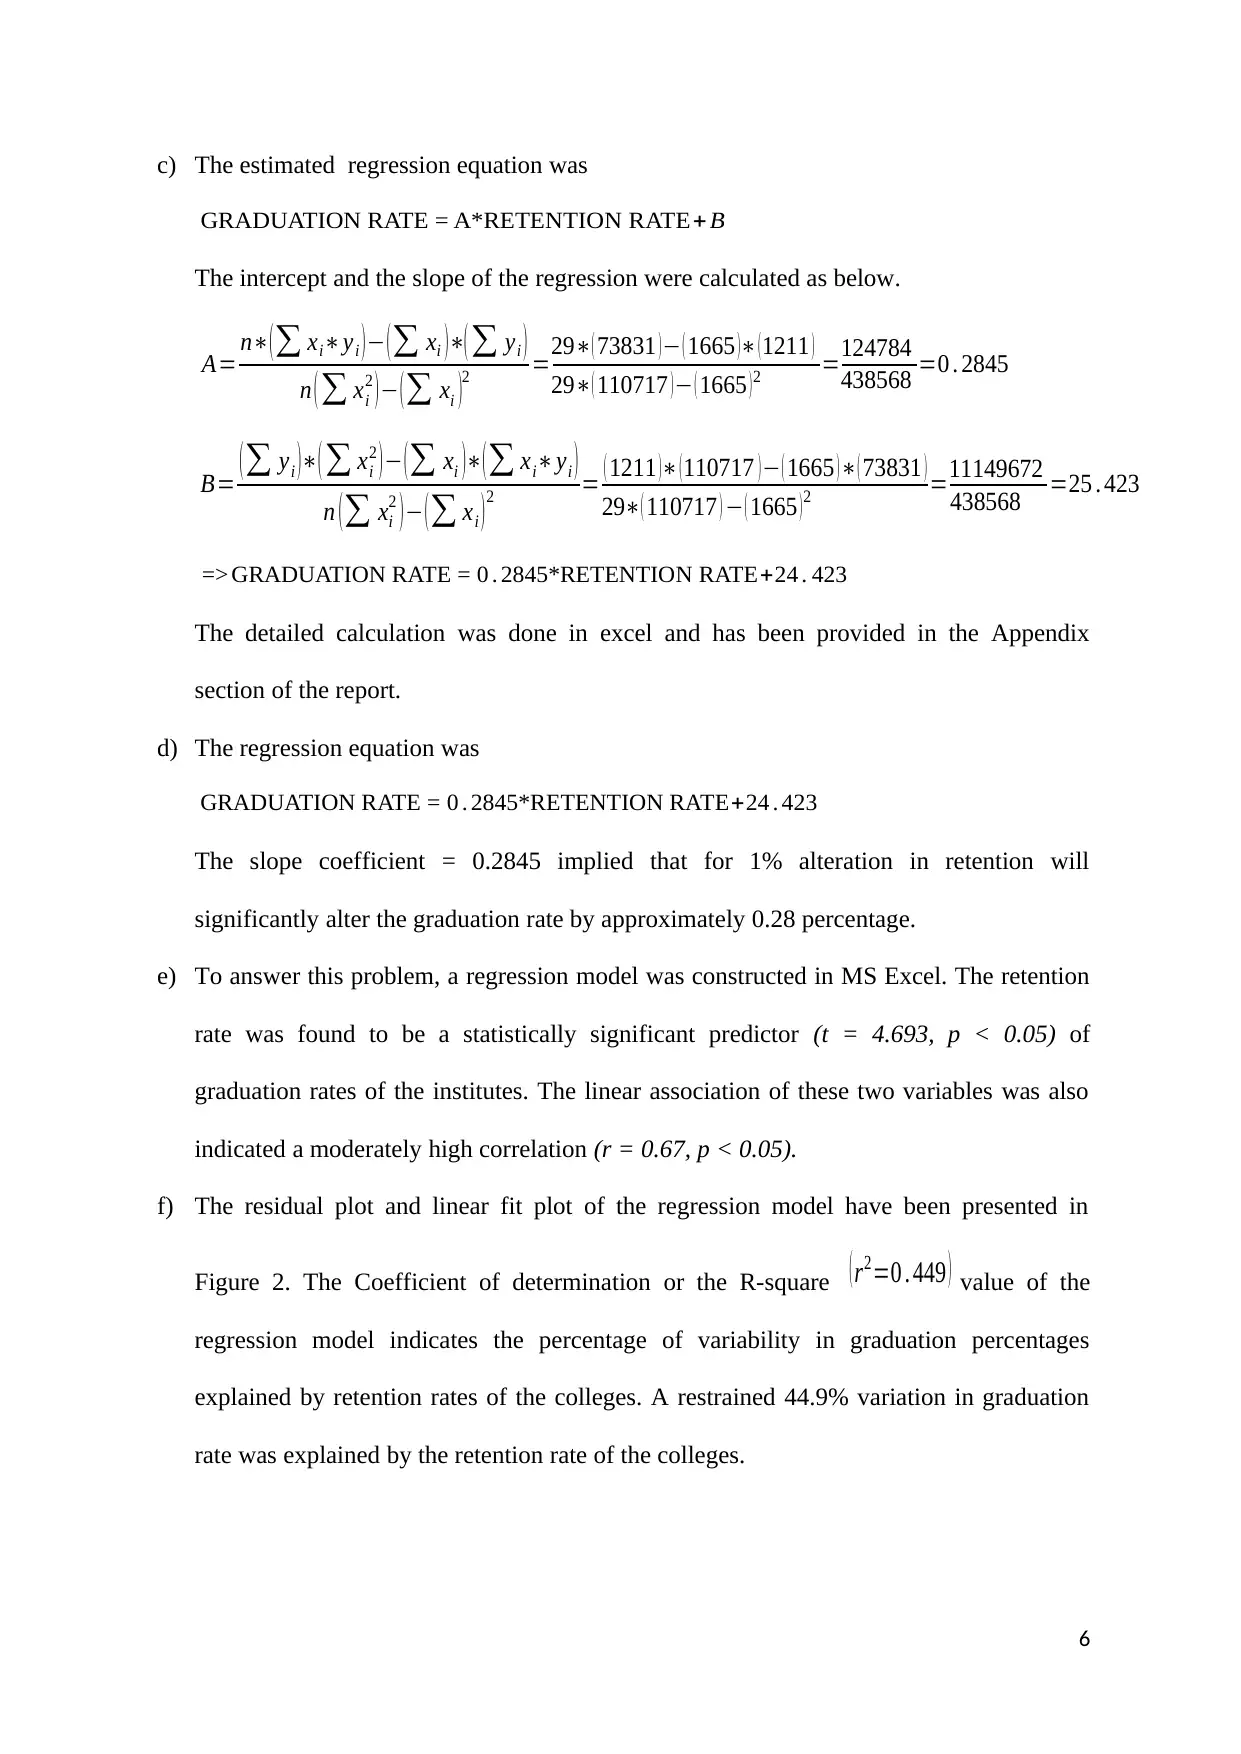
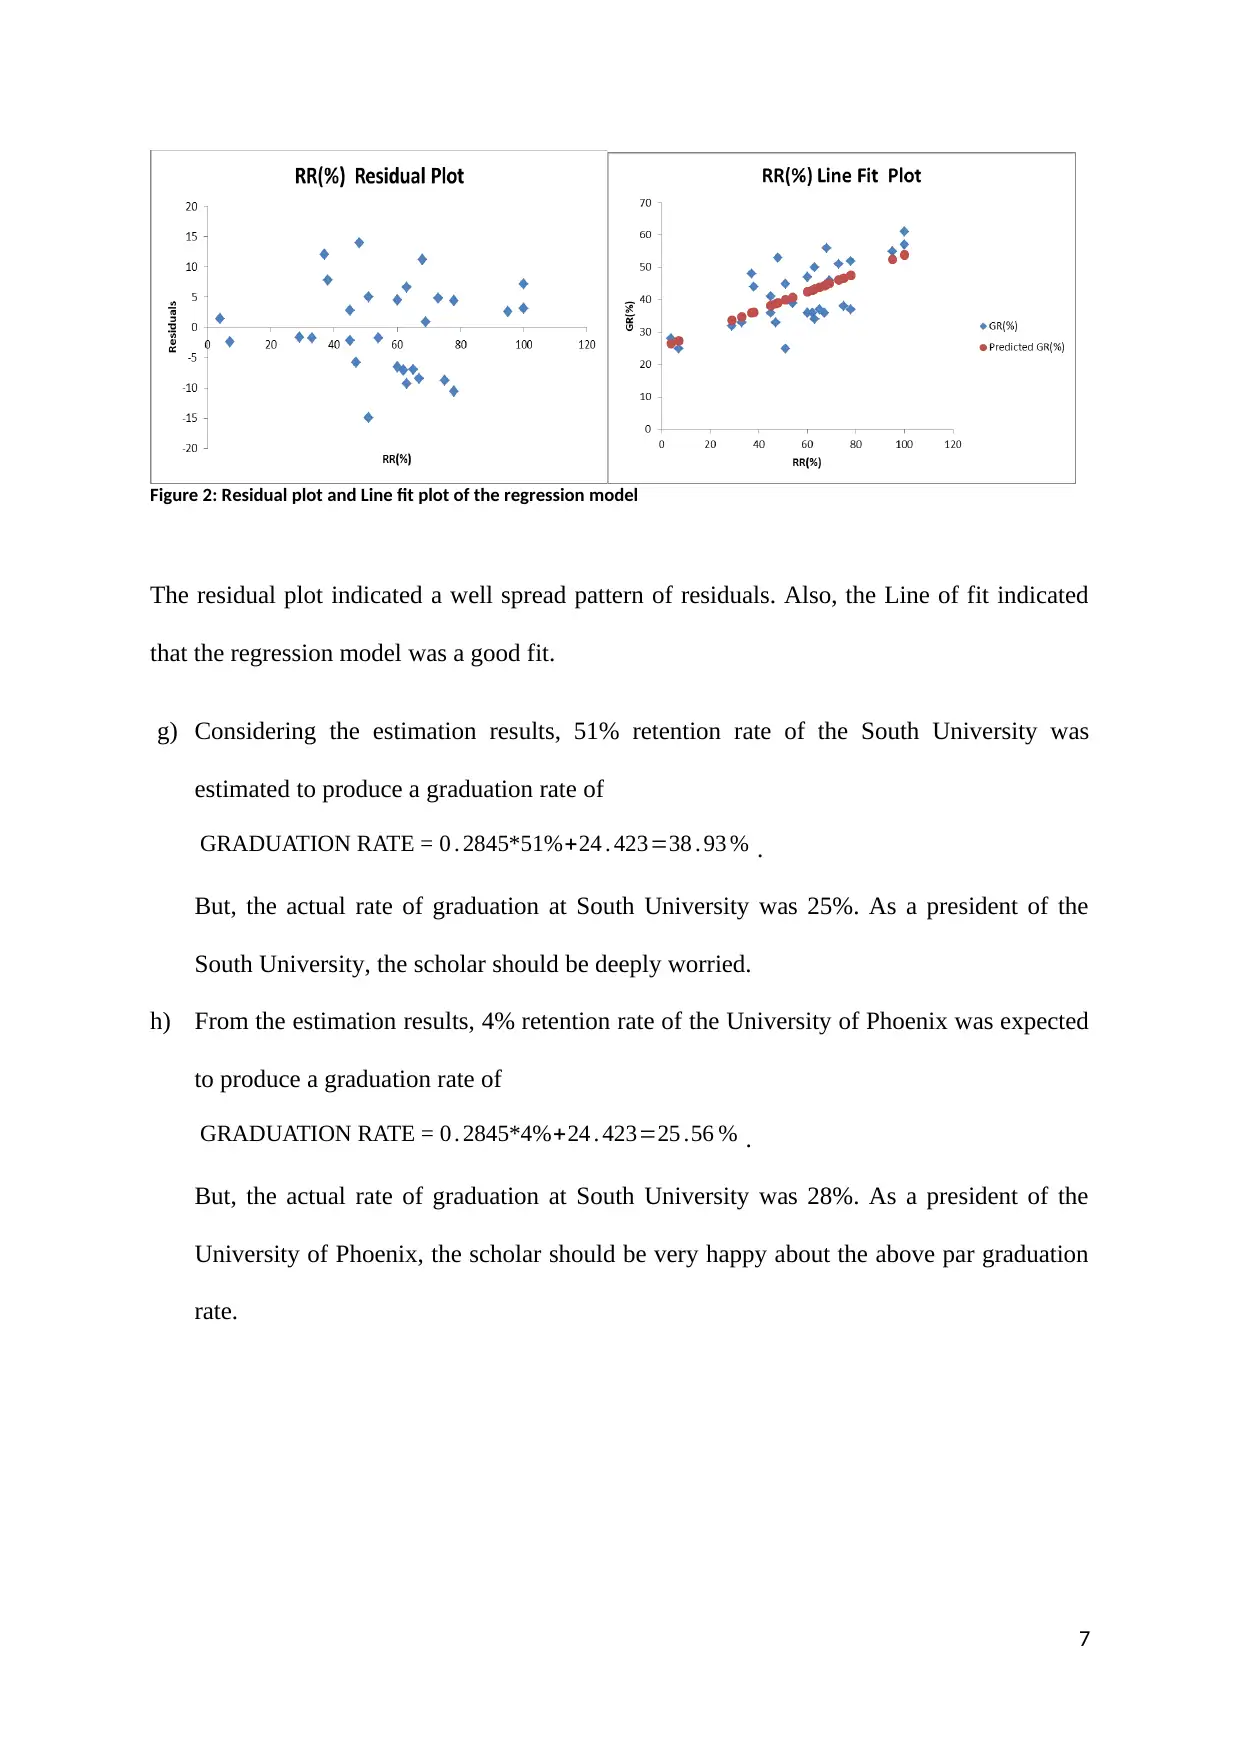
This report investigates the relationship between student retention rates and graduation rates in 29 colleges in the USA, using linear regression analysis. The study aims to create an estimation model for graduation success based on retention rates. The literature review highlights the higher attrition rates in online courses compared to traditional courses and the importance of student resilience. The methodology involves analyzing data from the selected colleges, calculating descriptive statistics, creating a scatter plot, and constructing a linear regression model. The results indicate a moderately high positive correlation between retention and graduation rates. The regression equation is presented, and its statistical significance is evaluated. The report also includes a residual plot and a line fit plot to assess the model's fit. Finally, the report discusses the implications of the findings, including the impact of retention on graduation rates, and provides recommendations for universities to improve their graduation rates by increasing retention rates and considering demographic and external predictors. The study acknowledges limitations, such as the small sample size and the exclusion of demographic and external factors. The report concludes by emphasizing the need for future studies with larger samples to enhance the validity and generalization of the results. Desklib provides solved assignments and past papers for students.
tabler-icon-diamond-filled.svg

Contribute Materials

Your contribution can guide someone’s learning journey. Share your documents today.
Document Page
Estimation Model for Graduation Success – A Perspective with
Student Retention in Online Courses
1
tabler-icon-diamond-filled.svg

Secure Best Marks with AI Grader

Need help grading? Try our AI Grader for instant feedback on your assignments.
Document Page
Abstract
With rapid growth of online programs, fears of retention rates are increasing. Models have
been developed to understand persistence of students in face-to-face situations, but many of
these structures do not exist for an online environment. Since the dropout is much higher in
online courses compared to face-to-face programs, the development of models to explain
online retention is considered a priority. This study moved in this direction by studying the
relationship between student retention and graduation rates for 29 colleges in the USA. Data
analysis shows an important and positive impact of higher retention on graduation rate of the
colleges.
2
Document Page
Introduction
The emphasis on higher education is increasingly focused on results rather than on structure.
Increased retention is thus objective of many institutions to assess and improve the quality of
its work. The dearth in a high percentage of retention has always challenged the education
system and this problem appears to be particularly acute in online courses.
This article creates a successful graduation percentage estimation model that takes retention
rate in colleges as the only predictor. The scholar believes that the model can serve as a
useful guide to choose the best university for the students in terms of successful completion
of courses.
Literature Review
This document outlines an estimation model to analyse the success percentage of graduation
in American colleges and universities. When it comes to online learning, the average number
seems of attrition seems to be higher than the traditional courses (Allen, & Seaman, 2010,
p.1-29). Although national statistics on distance learning are available, some claim that the
retention rate is 10 to 20% higher in online courses than on-campus education (Boston & Ice,
2010, p. 1593–1599).
E-learning is advancing from a marginal level in general education to an integrated part. In
the higher education sector, lack of resilience for a student is a complex and
multidimensional problem. Strategies for students' success should be considered as an
individual, institutional or program level (Cress, 2014, p. 294). Subsequent surveys have been
extended with various questions and factors that affect the retention of the students and their
3
Document Page
impact on the successful completion of programs (Halawa, Greene, & Mitchell, 2014, pp. 58–
65).
This study discusses the straight impact of retention rate on graduation rate in colleges and
universities of the USA (Talbert, 2012, p.22). Supplementary factors that affect student
performance, and support the student to succeed in formal education have been excluded
from the scope of this article (Xu, & Jaggars, 2013, p.5-25). A thorough review and validity
of the regression model in the context of e-learning suggest a moderately fit exemplary that
demonstrates the link between graduation rate and retention rate of the colleges (Tovar, 2014,
p. 766–782).
Methodology
A total of 29 colleges and universities in the USA were selected for the present research. The
sample size was less than 30, and this is an important limitation of the research (Schönbrodt,
& Perugini, 2013, p. 609–612). Among the surveyed institutes, the average rate of retention
was roughly 57.41%. The average rate of students successfully completing their graduation
was approximately 41.76%. This indicated that a large majority (58.24%) of the students
failed to successfully complete their programs to obtain graduation degree. Retention rate as
an independent factor was used to estimate the graduation rate of students (dependent
variable). A scatter plot was drawn for scrutinizing the linear relation between the variables.
A linear regression model was constructed and the validity, as well as statistical significance,
was investigated at a 5% level of significance (Montgomery, Peck, & Vining, 2012, p. 80-
100).
4
tabler-icon-diamond-filled.svg

Secure Best Marks with AI Grader

Need help grading? Try our AI Grader for instant feedback on your assignments.
Document Page
Results
a) The mean rate of retention of the institutions in the sample was assessed at
approximately 57.41% with a standard deviation of 23.24%. The least percentage of
retention was noted to be 4% and the maximum was 100% retention. The average
graduation rate was estimated at 41.76% with a standard deviation of 9.86%. Minimum
graduation rate was 25% and a maximum of 61% graduation rate was noted in the
sample.
b) A scatter diagram was constructed with graduation rate as the dependent and retention
rate as the independent variable. Figure 1 presents the constructed scatter diagram.
Figure 1: Scatter Diagram with the graduation rate as the dependent and retention rate as the independent variable
The scatter diagram indicates that the graduation rate in the colleges increased with retention
rate. Pearson's Correlation coefficient between retention and graduation rate was 0.67, which
indicated a moderately high positive linear relation. The relation was also found to be
statistically significant.
5
Document Page
c) The estimated regression equation was
GRADUATION RATE = A*RETENTION RATE+ B
The intercept and the slope of the regression were calculated as below.
A= n( xiyi ) ( xi )( yi )
n ( xi
2 ) ( xi )
2 =29( 73831 ) ( 1665 ) ( 1211 )
29( 110717 ) ( 1665 ) 2 =124784
438568 =0 . 2845
B= ( yi )( xi
2 ) ( xi )( xiyi )
n ( xi
2 ) ( xi ) 2 = ( 1211 ) ( 110717 ) ( 1665 ) ( 73831 )
29( 110717 ) ( 1665 ) 2 =11149672
438568 =25 . 423
=> GRADUATION RATE = 0 . 2845*RETENTION RATE+24 . 423
The detailed calculation was done in excel and has been provided in the Appendix
section of the report.
d) The regression equation was
GRADUATION RATE = 0 . 2845*RETENTION RATE+24 . 423
The slope coefficient = 0.2845 implied that for 1% alteration in retention will
significantly alter the graduation rate by approximately 0.28 percentage.
e) To answer this problem, a regression model was constructed in MS Excel. The retention
rate was found to be a statistically significant predictor (t = 4.693, p < 0.05) of
graduation rates of the institutes. The linear association of these two variables was also
indicated a moderately high correlation (r = 0.67, p < 0.05).
f) The residual plot and linear fit plot of the regression model have been presented in
Figure 2. The Coefficient of determination or the R-square ( r2=0 . 449 ) value of the
regression model indicates the percentage of variability in graduation percentages
explained by retention rates of the colleges. A restrained 44.9% variation in graduation
rate was explained by the retention rate of the colleges.
6
Document Page
Figure 2: Residual plot and Line fit plot of the regression model
The residual plot indicated a well spread pattern of residuals. Also, the Line of fit indicated
that the regression model was a good fit.
g) Considering the estimation results, 51% retention rate of the South University was
estimated to produce a graduation rate of
GRADUATION RATE = 0 . 2845*51%+24 . 423=38 . 93 % .
But, the actual rate of graduation at South University was 25%. As a president of the
South University, the scholar should be deeply worried.
h) From the estimation results, 4% retention rate of the University of Phoenix was expected
to produce a graduation rate of
GRADUATION RATE = 0 . 2845*4%+24 . 423=25 .56 % .
But, the actual rate of graduation at South University was 28%. As a president of the
University of Phoenix, the scholar should be very happy about the above par graduation
rate.
7
tabler-icon-diamond-filled.svg

Paraphrase This Document

Need a fresh take? Get an instant paraphrase of this document with our AI Paraphraser
Document Page
Discussion
The key results were: The average retention rate of the mechanism in the sample was
estimated at about 27.41%. The average graduation rate was estimated at 41.76% and the
standard deviation was 9.86%. Scatter chart shows that the graduation rate of colleges and
universities increases as the retention rate increases. The correlation coefficient between
Pearson retention rate and the graduation rate was 0.67. The estimated regression equation
was GRADUATION RATE = 0 . 2845*4%+24 . 423=25 .56 % . Retention rate was noted to be
statistically significant predictor of graduation completion rates in the institutions (t = 4,693,
p < 0.05).
The study has certain limitations: demographic factors such as age and gender were not
considered here. External factors, such as motivational support or individual learning
preferences were also ignored in the study.
The strength of the regression model was that the model was statistically significant and
retention rate alone was able to explain a 44.9% variation in graduation rates.
The positive and statistically significant impact of retention rate on graduation rate was
earlier noted in previous pieces of literature (Tsinidou, Gerogiannis, & Fitsilis, 2010, p.
227–244). Here, the scholar established a linear and positive impact of retention on
graduation.
A major policy implication was to recognize the extent of average retention and graduation
rates. Also, a subsidiary implication was to assess the impact of drop out students on the
graduation percentage of the colleges.
8
Document Page
Recommendations
The three recommendations are as follows.
1. Universities should try to increase the retention rates up to a point of inflection to
improve their graduation rates.
2. Demographic and external predictors should be used as mediators to estimate the
graduation percentage in universities.
3. Future studies should work on a larger sample for better validity and generalization of
the results.
9
Document Page
References
Allen, IE & Seaman, J 2010, Learning on Demand: Online Education in the United States,
2009, Sloan Consortium, pp.1-29 retrieved February 17, 2019, from <https://eric.ed.gov/?
id=ED529931>.
Boston, W & Ice, P 2010, ‘Comprehensive Assessment of Student Retention in Online
Learning Environments’, in Association for the Advancement of Computing in Education
(AACE), pp. 1593–1599, retrieved February 16, 2019, from
<https://www.learntechlib.org/primary/p/35779/>.
Cress, U 2014, ‘Proceedings of the European MOOC Stakeholder Summit 2014’, , pp. 294.
Halawa, S, Greene, D & Mitchell, J 2014, ‘Dropout prediction in MOOCs using learner
activity features’, Proceedings of the 2nd European MOOCs Stakeholders Summit, pp. 58–
65.
Montgomery, DC, Peck, EA & Vining, GG 2012, Introduction to Linear Regression
Analysis, John Wiley & Sons. pp. 80-100
Schönbrodt, FD & Perugini, M 2013, ‘At what sample size do correlations stabilize?’,
Journal of Research in Personality, vol. 47, no. 5, pp. 609–612, retrieved February 17, 2019,
from <http://www.sciencedirect.com/science/article/pii/S0092656613000858>.
Talbert, PY 2012, ‘Strategies to Increase Enrollment, Retention, and Graduation Rates’,
Journal of Developmental Education, vol. 36, no. 1, p. 22, retrieved February 17, 2019, from
<https://eric.ed.gov/?id=EJ1035683>.
10
tabler-icon-diamond-filled.svg

Secure Best Marks with AI Grader

Need help grading? Try our AI Grader for instant feedback on your assignments.
Document Page
Tovar, E 2014, ‘Student Engagement and Institutional Graduation Rates: Identifying High-
Impact Educational Practices for Community Colleges AU - Price, Derek V.’, Community
College Journal of Research and Practice, vol. 38, no. 9, pp. 766–782, retrieved February 17,
2019, from <https://naspa.tandfonline.com/doi/abs/10.1080/10668926.2012.719481>.
Tsinidou, M, Gerogiannis, V & Fitsilis, P 2010, ‘Evaluation of the factors that determine
quality in higher education: an empirical study’, Quality Assurance in Education, vol. 18, no.
3, pp. 227–244, retrieved February 17, 2019, from
<https://www.emeraldinsight.com/doi/abs/10.1108/09684881011058669>.
Xu, D & Jaggars, S 2013, ‘Adaptability to Online Learning: Differences Across Types of
Students and Academic Subject Areas’, pp.5-25 retrieved February 17, 2019, from
<https://doi.org/10.7916/D82N59NB>.
11
Document Page
Appendices
Data used in the study
Descriptive Statistics
12
Document Page
Correlation matrix
RR(%) GR(%)
RR(%) 1
GR(%) 0.670245 1
Hand calculation for regression
13
tabler-icon-diamond-filled.svg

Paraphrase This Document

Need a fresh take? Get an instant paraphrase of this document with our AI Paraphraser
Document Page
Excel regression output
Regression residual output
14
chevron_up_icon
1 out of 14
circle_padding
hide_on_mobile
zoom_out_icon
logo.png

Your All-in-One AI-Powered Toolkit for Academic Success.

Available 24*7 on WhatsApp / Email

[object Object]