Linear Regression Analysis: Life Satisfaction and GDP Report
VerifiedAdded on 2022/08/16
|13
|1689
|10
Report
AI Summary
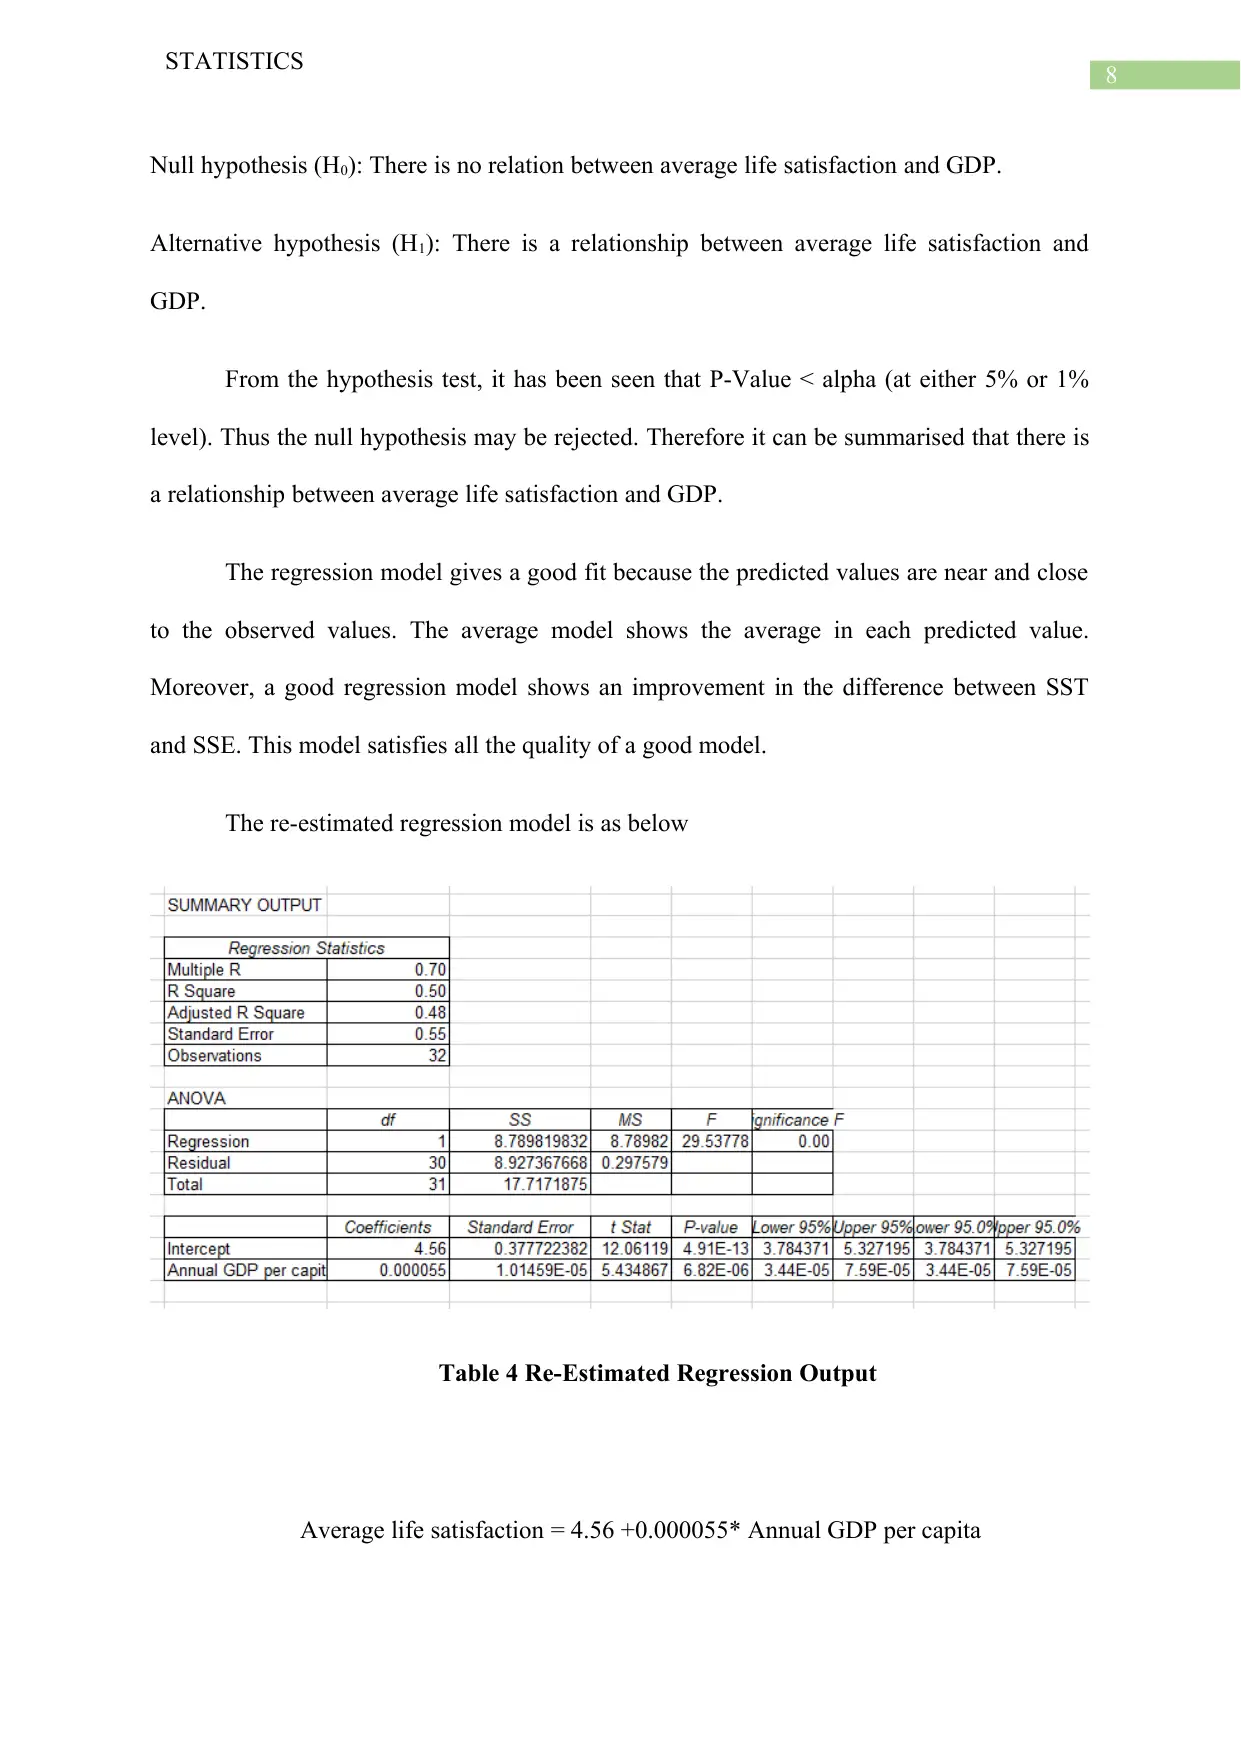
This report investigates the statistical relationship between average life satisfaction and GDP per capita, as requested by the OECD. The study begins with a concise statement of purpose, followed by a literature review exploring the existing research on the correlation between life satisfaction and GDP, including the Easterlin Paradox. The methodology section details the data source and the use of descriptive statistics and linear regression to analyze the relationship between the two variables across 35 countries. The results section presents summary statistics, including mean, standard deviation, minimum, and maximum values for both life satisfaction and GDP per capita. It also includes a scatter plot to visualize the relationship and presents the output of the regression analysis, including the correlation coefficient, coefficient of determination, and hypothesis testing results. The discussion section interprets the findings, highlighting the positive correlation between life satisfaction and GDP, and acknowledges the limitations of the study. Finally, the report offers recommendations based on the analysis, suggesting that increased GDP can lead to higher life satisfaction and emphasizing the importance of GDP growth for national development.

Running head: STATISTICS
Statistics
Name of the Student:
Name of the University:
Author note:
Statistics
Name of the Student:
Name of the University:
Author note:
Paraphrase This Document
Need a fresh take? Get an instant paraphrase of this document with our AI Paraphraser

1
STATISTICS
Table of Contents
Purpose.......................................................................................................................................2
Background................................................................................................................................3
Method.......................................................................................................................................4
Results........................................................................................................................................5
Discussion..................................................................................................................................9
Recommendations....................................................................................................................10
References and Bibliography...................................................................................................11

2
STATISTICS
Purpose
The main purpose of this study is to examine and associate statistically among the
average life satisfaction and Gross Domestic Product (GDP) per capita. In this study
descriptive summary measure, linear regression has been shown based on average life
satisfaction and Gross Domestic Product (GDP).
⊘ This is a preview!⊘
Do you want full access?
Subscribe today to unlock all pages.

Trusted by 1+ million students worldwide

3
STATISTICS
Background
The satisfaction of life is a monotonic increasing function with the income of a person
or a nation at some point. This study reflects the relation between life satisfaction and per
capita GDP. According to the purchasing power of parity, it is clear that if a nation has a
gross domestic product of fewer than 15,000 USD, then this shows the rich power of the
country is downflow (Proto and Rustichini 2013). The probability that the maximum level of
satisfaction of life is higher than 12% or less in the countries with a poor per capita GDP less
5,600 USD as compared to the countries with per capita GDP 15,000 USD. In other words, if
the income of a country higher than 17,000 USD then the probability that the satisfaction of
life has been increased with 2% of maximum with range. The life satisfaction on the USD
level is different among the high or low GDP of a country(Costanza et al.2014). In general,
life satisfaction is peaked at approximately 30,000 USD, but in the case of rich countries, it is
something different. In the United State of America (USA) from 1974 to 2004 per capita
income is approximately double; however, the mean level of a trend on happiness does not
shows an upward trend. This kind of puzzling and finding is known as Easterlin Paradox
(Kubiszewski et al. 2013). Different countries have different specific effects. The time is the
invariant effect and unobservable variable in the elimination of potential of a country that
specified the measurement errors and neglected the bias variable.
Paraphrase This Document
Need a fresh take? Get an instant paraphrase of this document with our AI Paraphraser

4
STATISTICS
Method
This study is based on life satisfaction and per capita GDP among 35 countries. The
summary measure and the regression analysis have been used to show the relation between
these two variables among the countries. The measure of central tendency, the measure of
dispersion and simple linear regression reflect the relationship of life satisfaction as
corresponding to GDP. In this study, the sample has been collected from 35 countries during
the period of 2017. The mean life satisfaction is measured 5 to 8 scale and the GDP shows in
dollars. The excel output shows the mean, median, mode, maximum, minimum, range,
standard deviation and simple linear regression. The model of a simple linear regression is as
below
Dependent variable = Intercept + Independent variables * X
In this study, average life satisfaction is the dependent variable and the per capita
income is the independent variable. The scatter plot has been applied to show the relation
between these two variables. In the regression output, the value of correlation, coefficient of
determination, standard error has been shown. Moreover, the ANOVA table and the value of
the coefficient, test statistic, critical value and the 95% confidence interval has been
discussed in the output of regression.

5
STATISTICS
Results
Table 1 Summary Statistics On Average life satisfaction
Table 1 shows the summary statistics of average life satisfaction. It has been seen that
the mean of the average life satisfaction is 6.6. The standard deviation of the average life
satisfaction is 0.75. The minimum and the maximum of average life satisfaction is 5.2 and
7.5.
Greece and Portugal have the lowest average life satisfaction and the Czech Republic and
Mexico has an average life satisfaction score.
⊘ This is a preview!⊘
Do you want full access?
Subscribe today to unlock all pages.

Trusted by 1+ million students worldwide

6
STATISTICS
Table 2 Summary Statistics on Annual GDP per capita
Table 2 shows the summary statistics of annual GDP per capita. It has been seen that
the mean of the GDP per capita is $ 39011.513. The median or the second quartile value of
these data set is $ 37843.040. The standard deviation of the annual GDP per capita is $
14006.215. The minimum and the maximum of average life satisfaction is $ 17122.53 and $
86788.14. Luxembourg has the highest annual GDP and Mexico has the lowest.
$0.00 $20,000.00 $40,000.00 $60,000.00 $80,000.00 $100,000.00
0.0
1.0
2.0
3.0
4.0
5.0
6.0
7.0
8.0 f(x) = 3.14329537364211E-05 x + 5.36518148151715
R² = 0.348913697376049
Scatter Plot on GDP versus Average Life
Satisfaction
Annual GDP per capita
Average life satisfaction
Figure 1 Scatter Plot on GDP versus Life satisfaction
Paraphrase This Document
Need a fresh take? Get an instant paraphrase of this document with our AI Paraphraser

7
STATISTICS
The figure 1 shows the relationship between two variables. In this scatter plot X-axis
represent the annual GDP per capita, and the Y-axis represents the average life satisfaction
score. It has been seen that the correlation between the two variables is positive and the value
of the correlation is 0.6. The coefficient of determination between these two variables is
0.348.
Table 3 Regression Output
The regression model between life satisfaction and the annual GDP per capita is as
below
Average life satisfaction = intercept + coefficient* Annual GDP per capita
Now,
Average life satisfaction = 5.37 +0.00003143* Annual GDP per capita *10,000
Average life satisfaction = 5.37 +0.3143* Annual GDP per capita
To test the association between average life satisfaction and GDP the following
hypothesis test has been applied.

8
STATISTICS
Null hypothesis (H0): There is no relation between average life satisfaction and GDP.
Alternative hypothesis (H1): There is a relationship between average life satisfaction and
GDP.
From the hypothesis test, it has been seen that P-Value < alpha (at either 5% or 1%
level). Thus the null hypothesis may be rejected. Therefore it can be summarised that there is
a relationship between average life satisfaction and GDP.
The regression model gives a good fit because the predicted values are near and close
to the observed values. The average model shows the average in each predicted value.
Moreover, a good regression model shows an improvement in the difference between SST
and SSE. This model satisfies all the quality of a good model.
The re-estimated regression model is as below
Table 4 Re-Estimated Regression Output
Average life satisfaction = 4.56 +0.000055* Annual GDP per capita
⊘ This is a preview!⊘
Do you want full access?
Subscribe today to unlock all pages.

Trusted by 1+ million students worldwide

9
STATISTICS
In this re-estimated model, the slope is increased. Thus the model is better as
compared to the table 3 regression model.
Discussion
The study on the relationship between annual GDP per capita and the average life
satisfaction declares the following results.
Greece and Portugal have the lowest average life satisfaction and the Czech
Republic and Mexico has an average life satisfaction score.
Luxembourg has the highest annual GDP per capita and Mexico has the
lowest.
The correlation between the average life satisfaction and GDP is positive and
the value of the correlation is 0.6. The coefficient of determination between
these two variables is 0.348.
The re-estimated model is better than the original model.
The linear regression model and the scatter plot is the best method to determine the
relationship between two variable. This is the strength of these studies. The limitations of this
study are affected by outliers. Hence the new and re-estimate the regression model.
The results of these studies show a consistent result as similar to the scientific
database US report. Both the report shows a positive and strong relationship between life
satisfaction and GDP.
Yes, the finding of this study has clear on the policy implications.
Paraphrase This Document
Need a fresh take? Get an instant paraphrase of this document with our AI Paraphraser

10
STATISTICS
Recommendations
The recommendations on life satisfaction and per capita GDP is as below
When the GDP of a country reaches $ 20,400 then the happiness increases.
A person highly satisfies in their life when the GDP of a country increases. Thus this
means that when income increases, then the happiness increases.
GDP is the most important factor in the development of a country. Hence the higher
GDP reflects higher satisfaction. It is recommended to all the countries of the world
that they increase their GDP and develop their country.

11
STATISTICS
References and Bibliography
Amrhein, V., Trafimow, D. and Greenland, S., 2019. Inferential statistics as descriptive
statistics: There is no replication crisis if we don’t expect replication. The American
Statistician, 73(sup1), pp.262-270.
Cameron, A.C. and Trivedi, P.K., 2013. Regression analysis of count data (Vol. 53).
Cambridge university press.
Chatterjee, S. and Hadi, A.S., 2015. Regression analysis by example. John Wiley & Sons.
Costanza, R., Kubiszewski, I., Giovannini, E., Lovins, H., McGlade, J., Pickett, K.E.,
Ragnarsdóttir, K.V., Roberts, D., De Vogli, R. and Wilkinson, R., 2014. Development: Time
to leave GDP behind. Nature News, 505(7483), p.283.
Gunst, R.F., 2018. Regression analysis and its application: a data-oriented approach.
Routledge.
Hinton, P.R., 2014. Statistics explained. Routledge.
Holcomb, Z.C., 2016. Fundamentals of descriptive statistics. Routledge.
⊘ This is a preview!⊘
Do you want full access?
Subscribe today to unlock all pages.

Trusted by 1+ million students worldwide
1 out of 13
Related Documents

Your All-in-One AI-Powered Toolkit for Academic Success.
+13062052269
info@desklib.com
Available 24*7 on WhatsApp / Email
Unlock your academic potential
Copyright © 2020–2025 A2Z Services. All Rights Reserved. Developed and managed by ZUCOL.