Lipid Peroxidation Assay: Liver Homogenate and Antioxidant Effects
VerifiedAdded on 2023/04/21
|18
|1940
|285
Practical Assignment
AI Summary
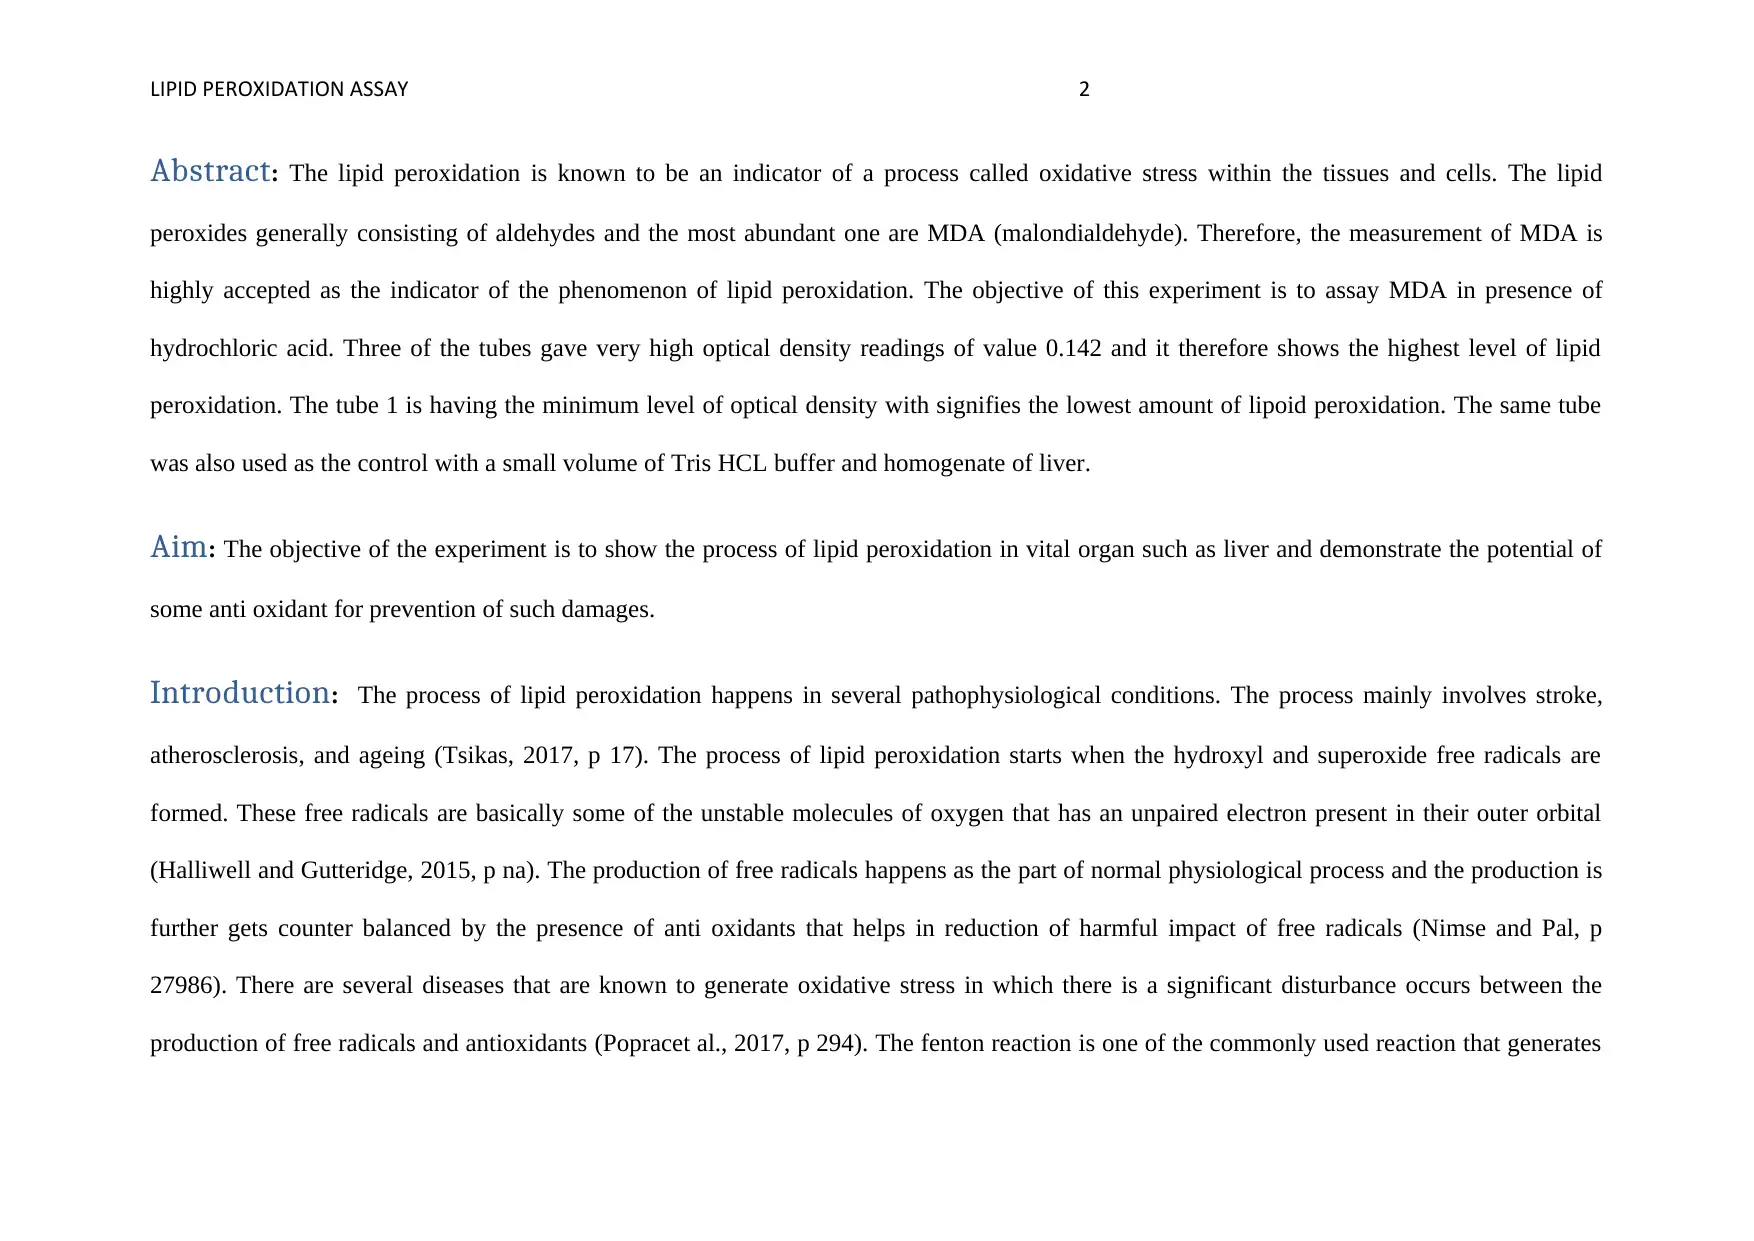
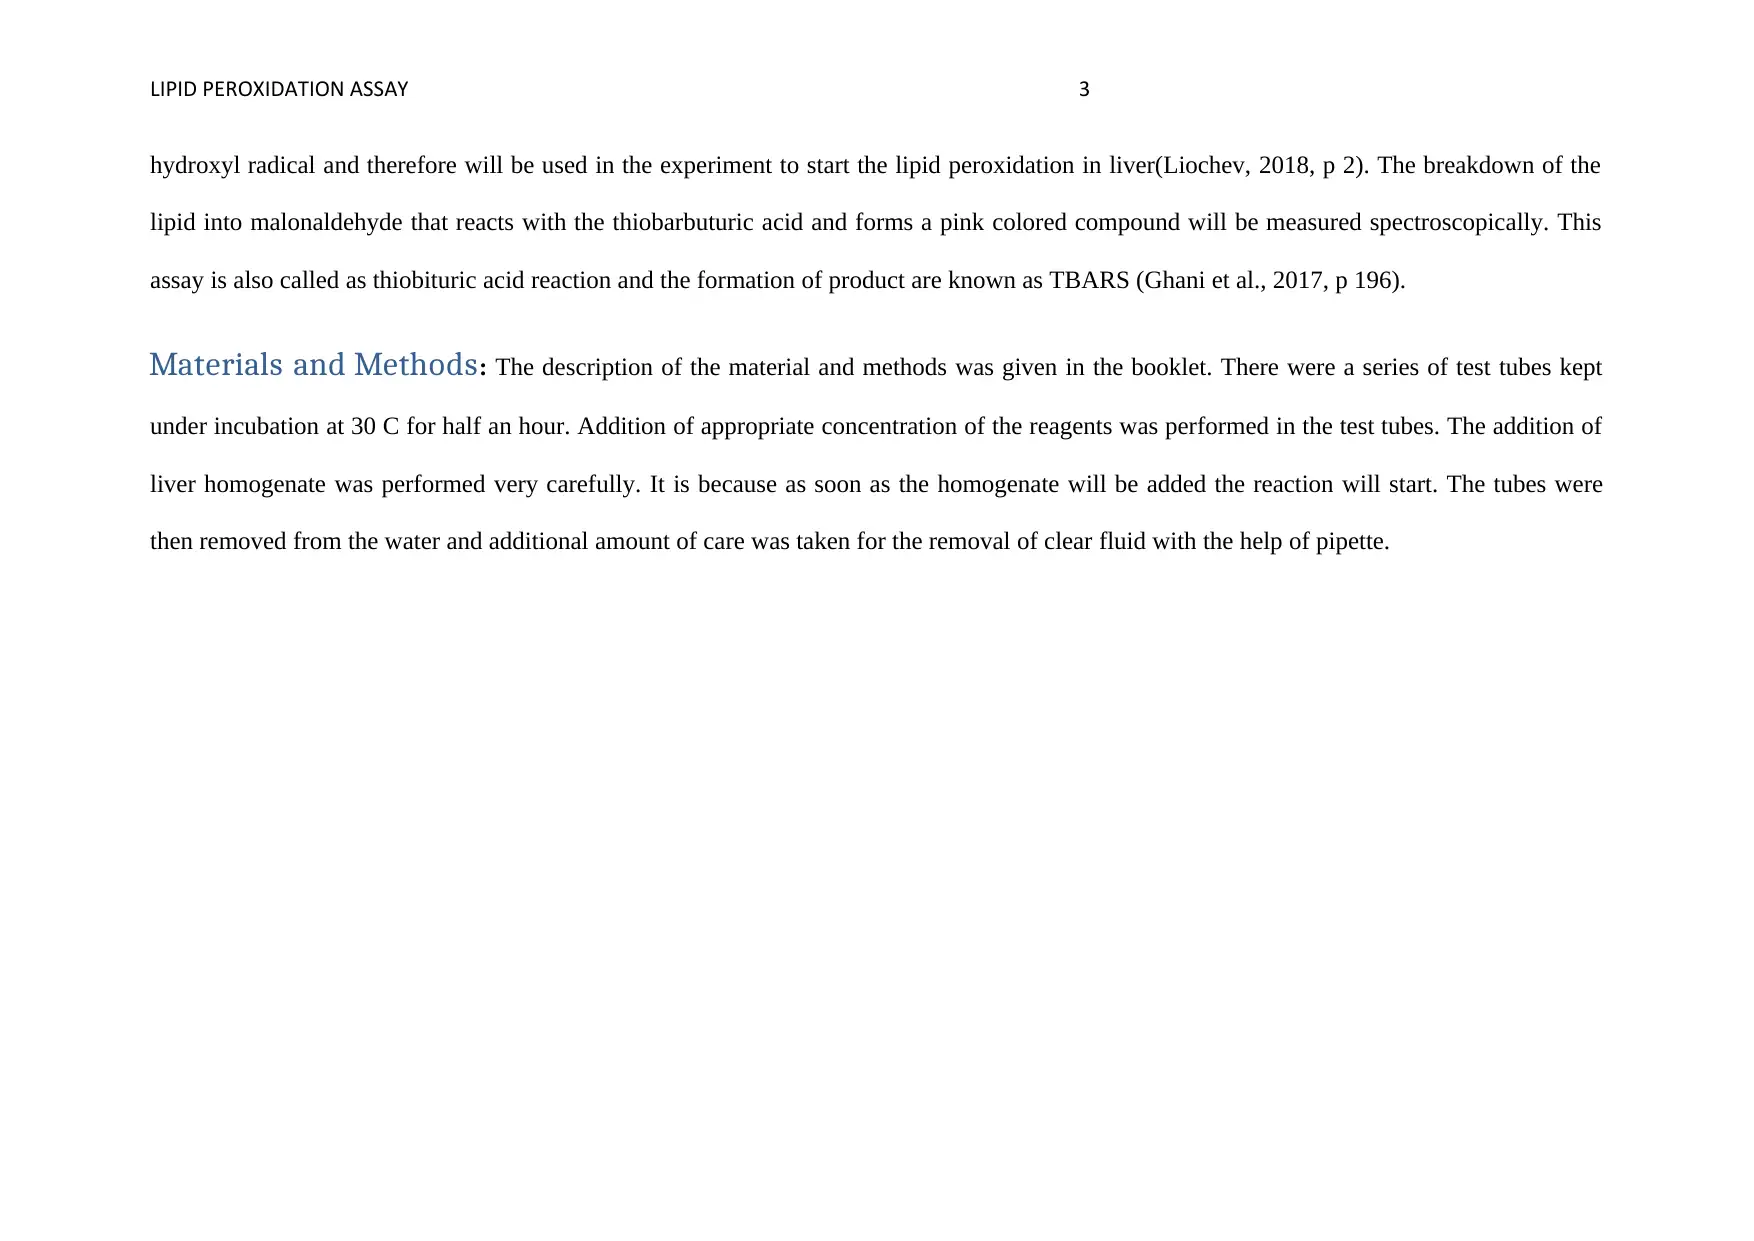
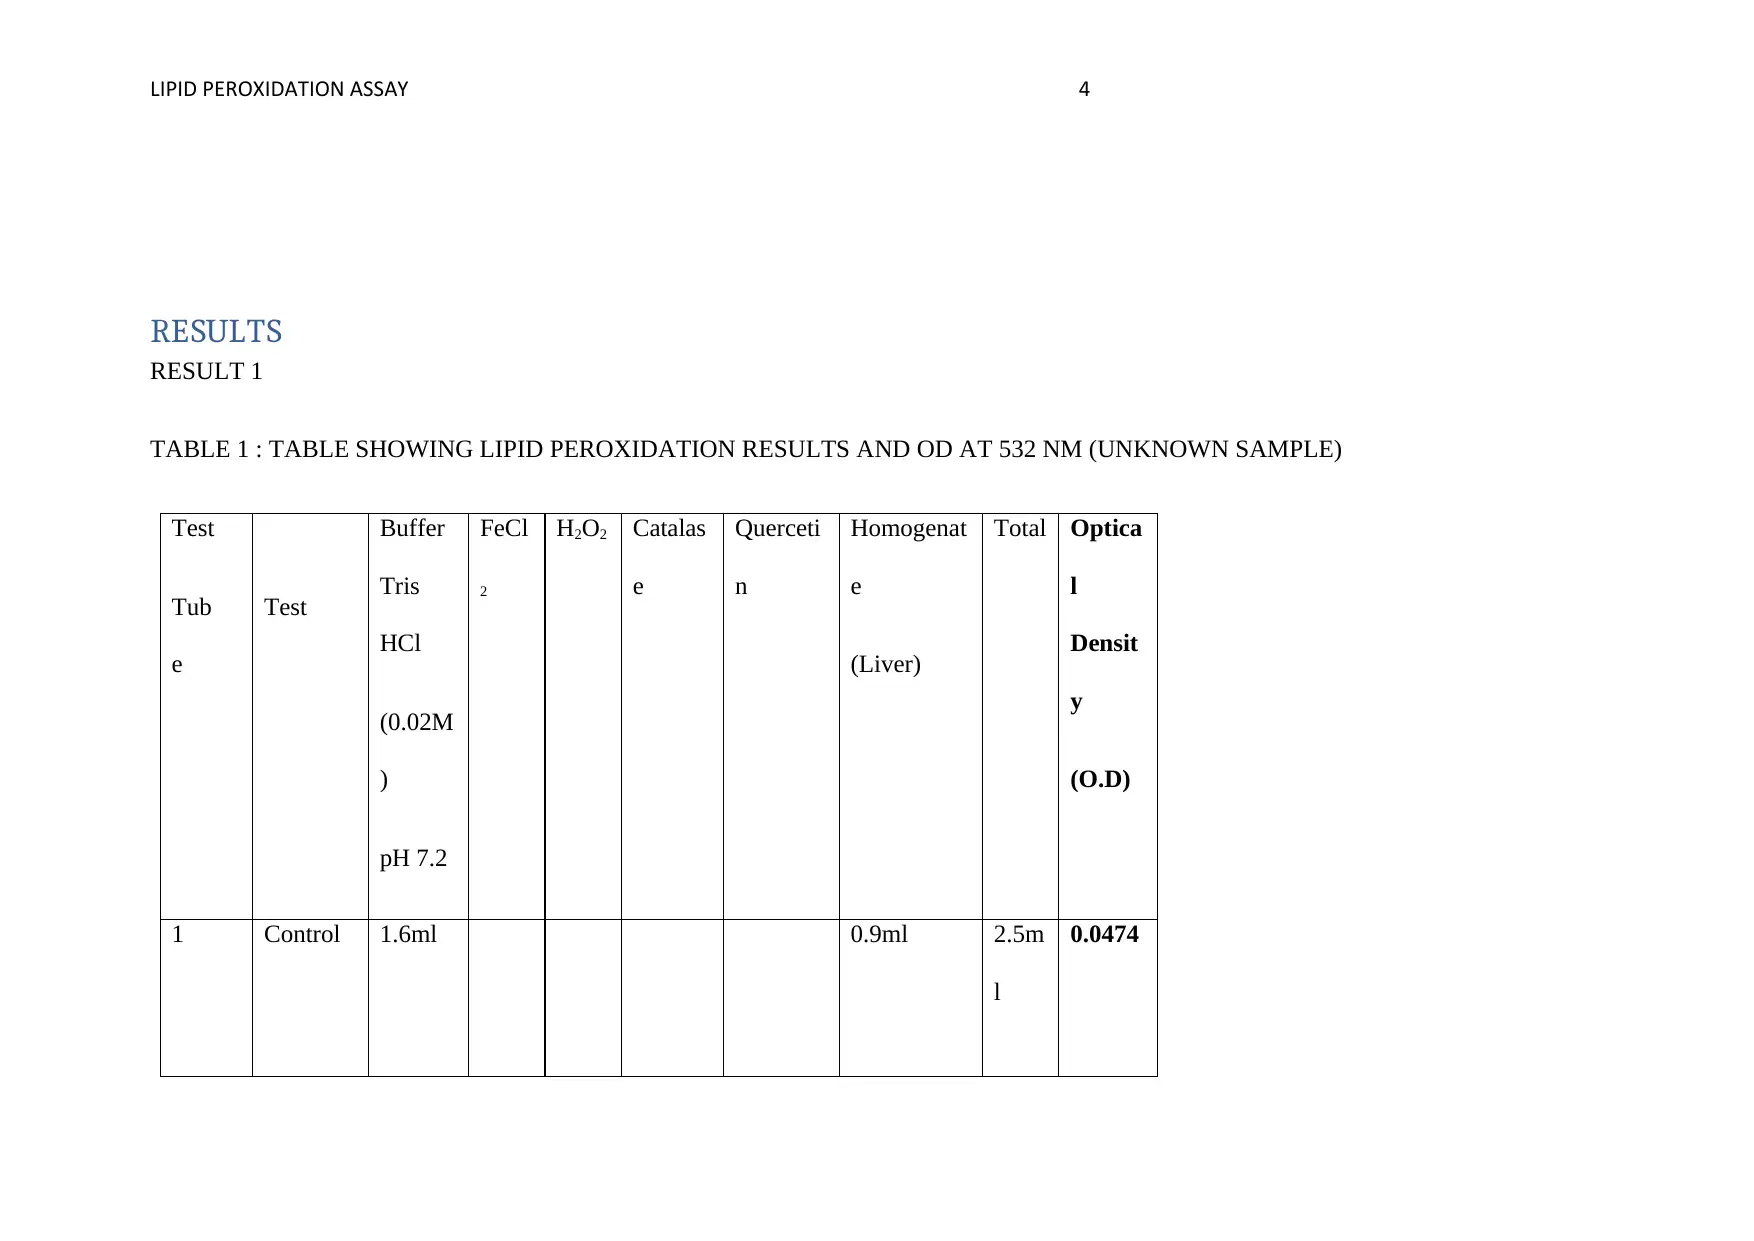
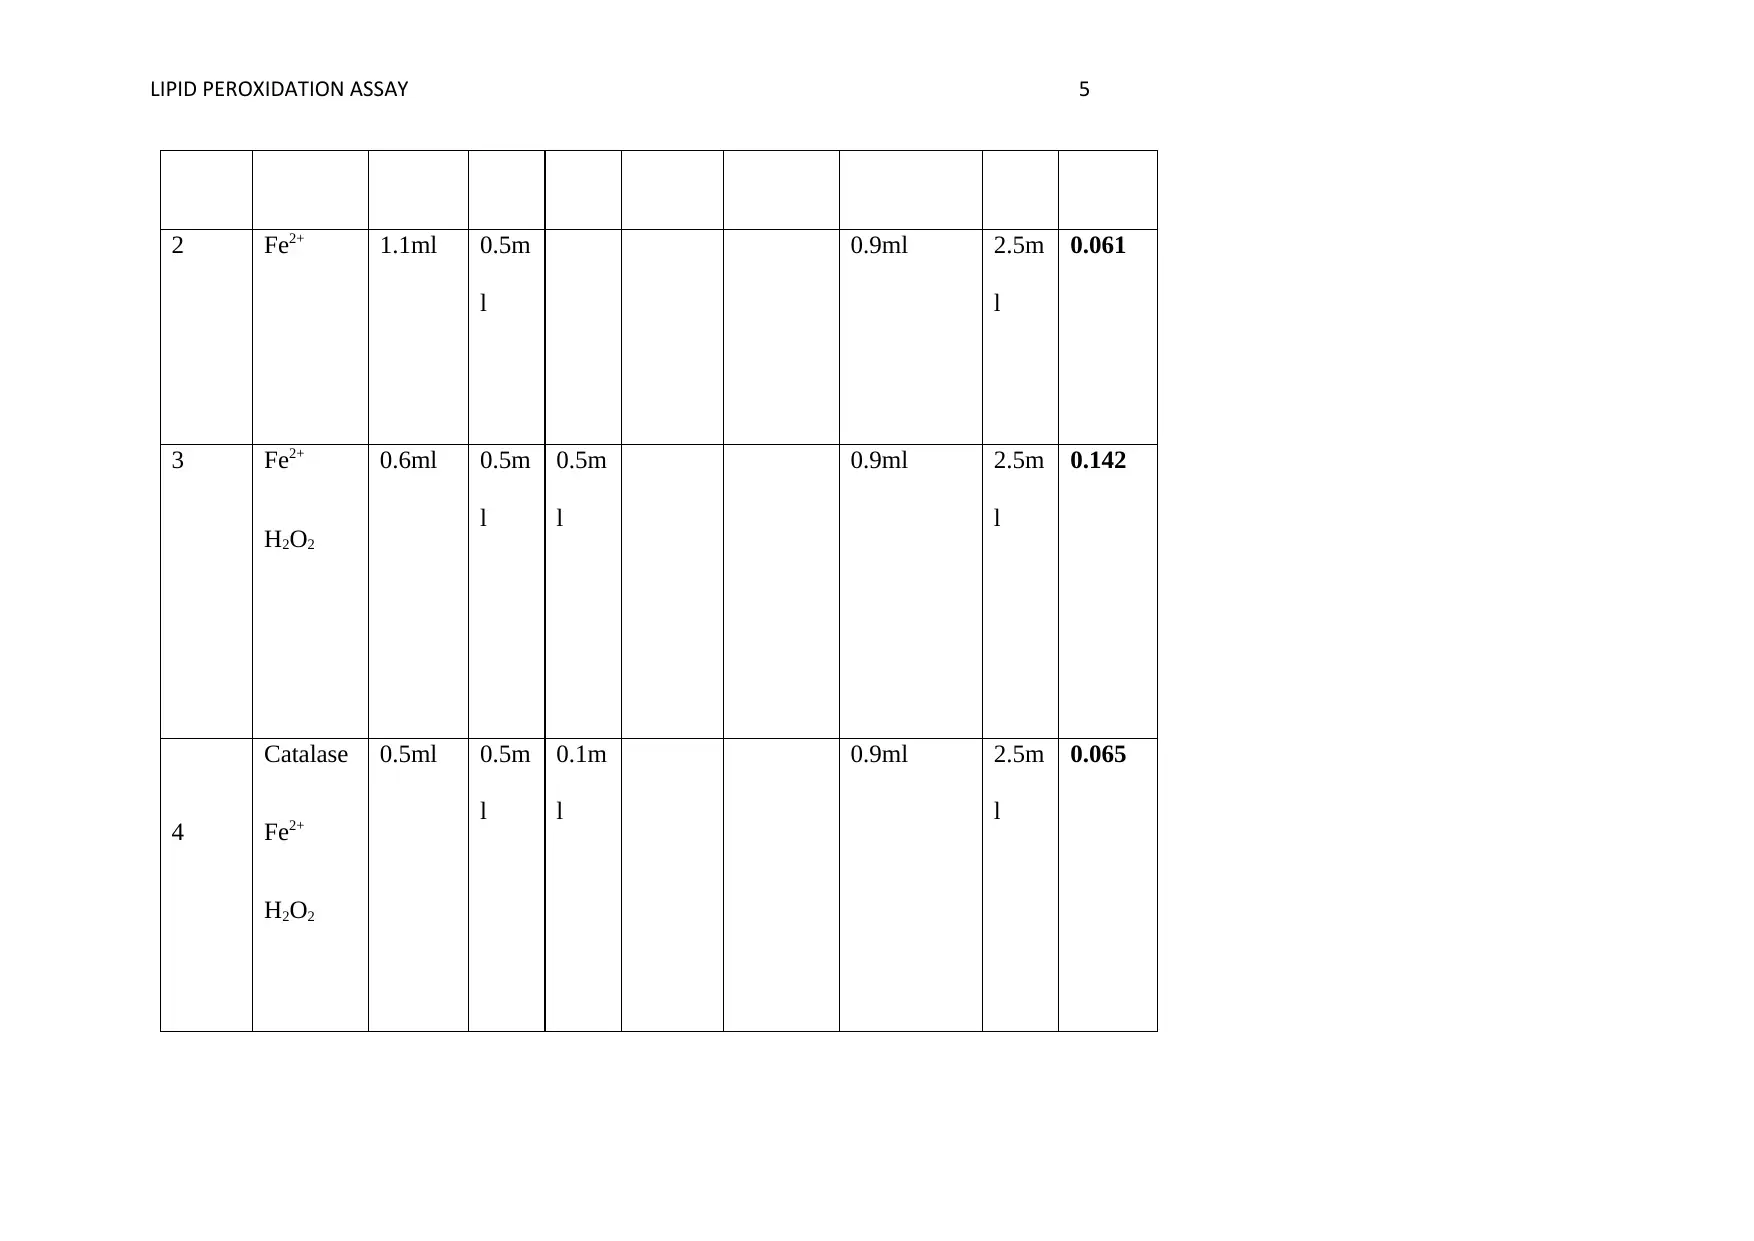
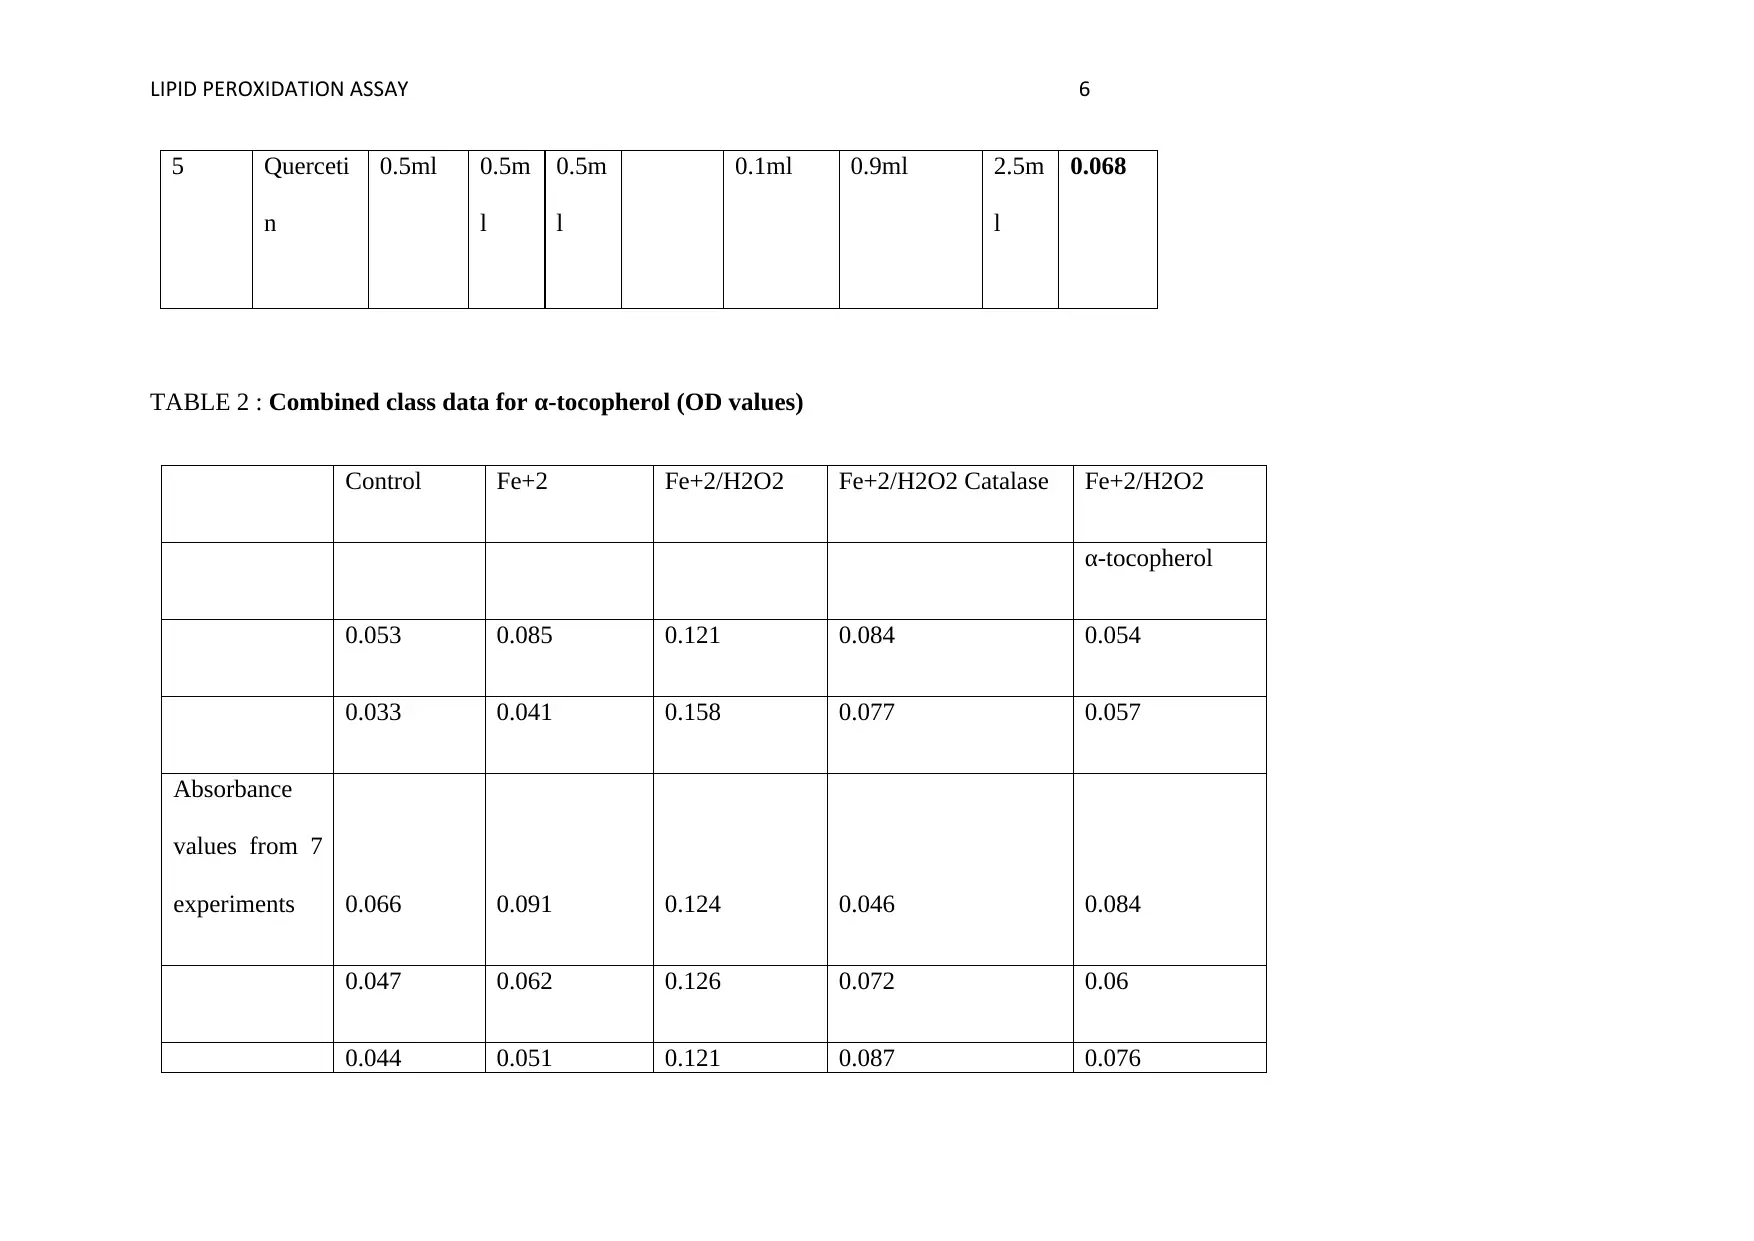
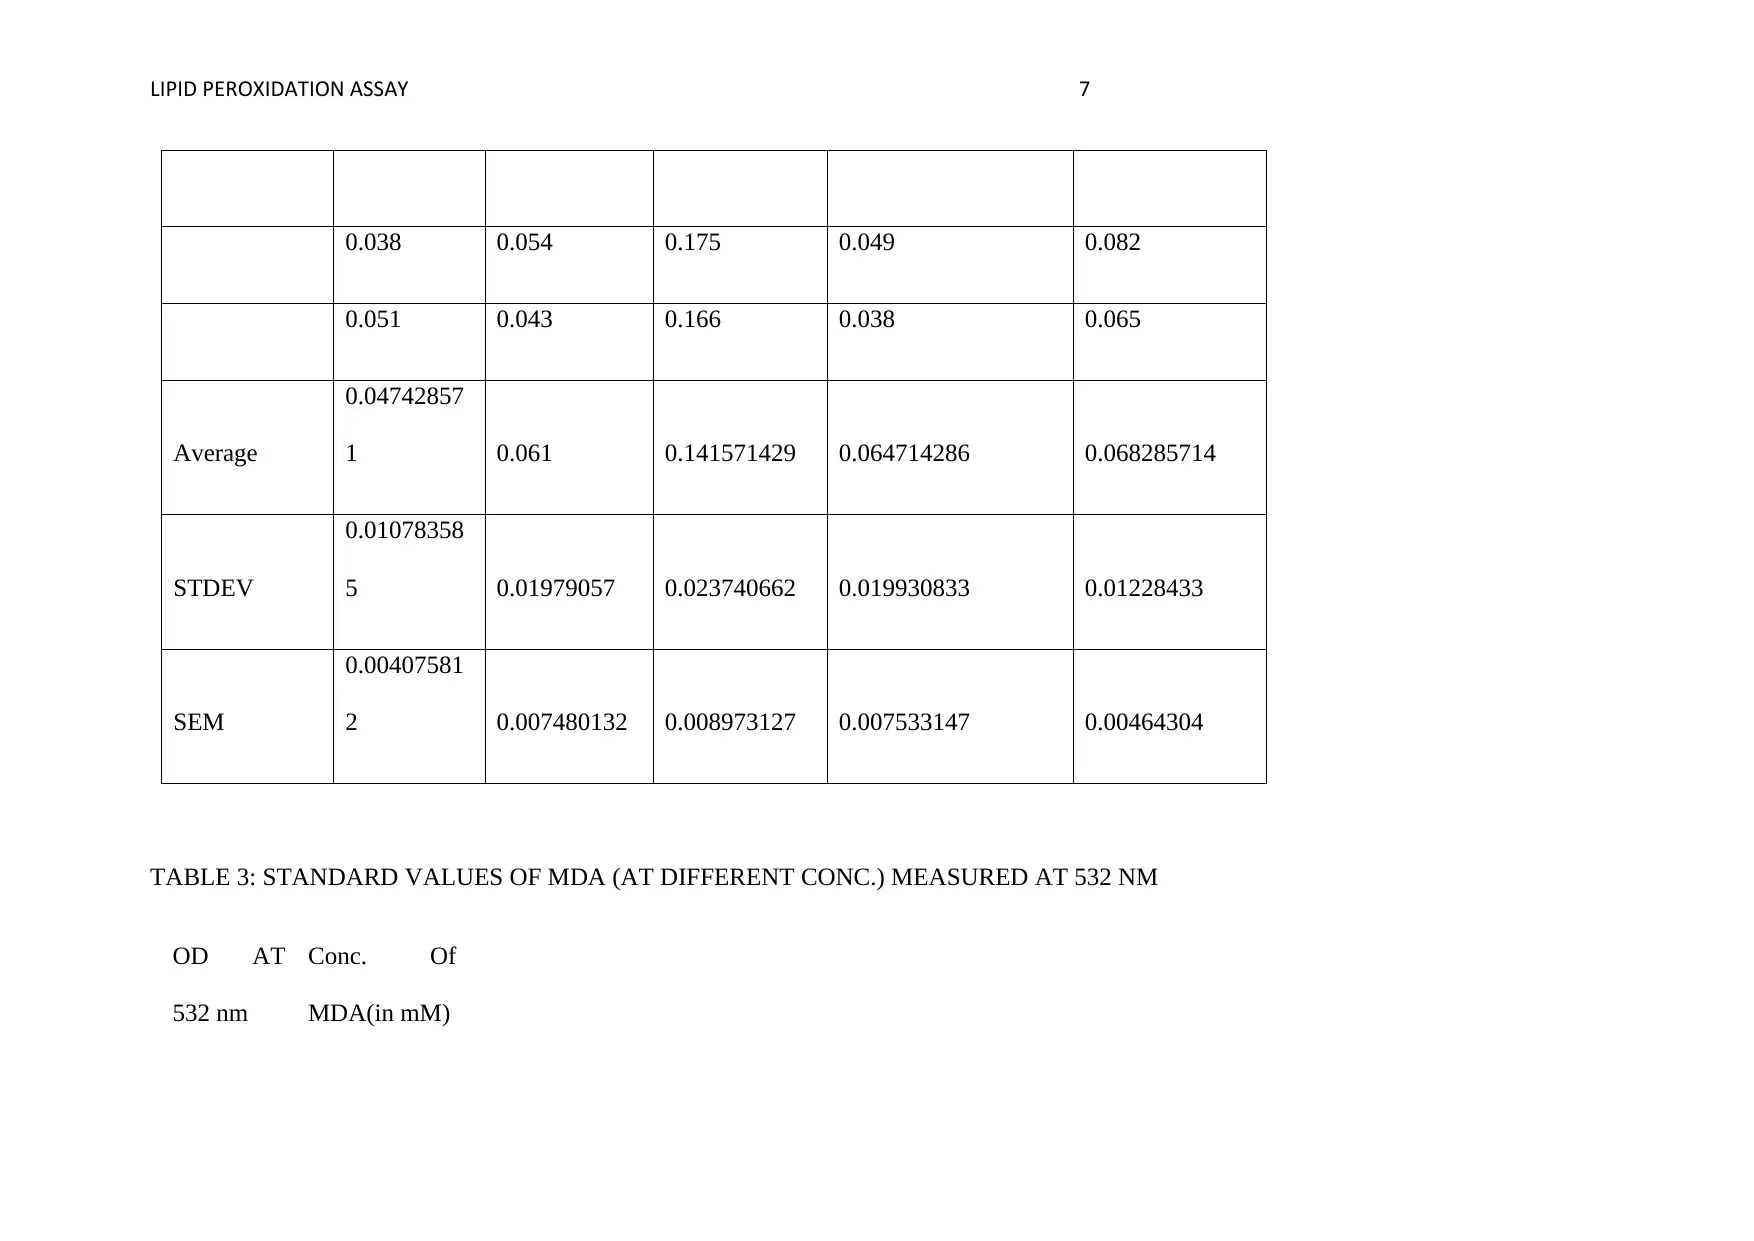
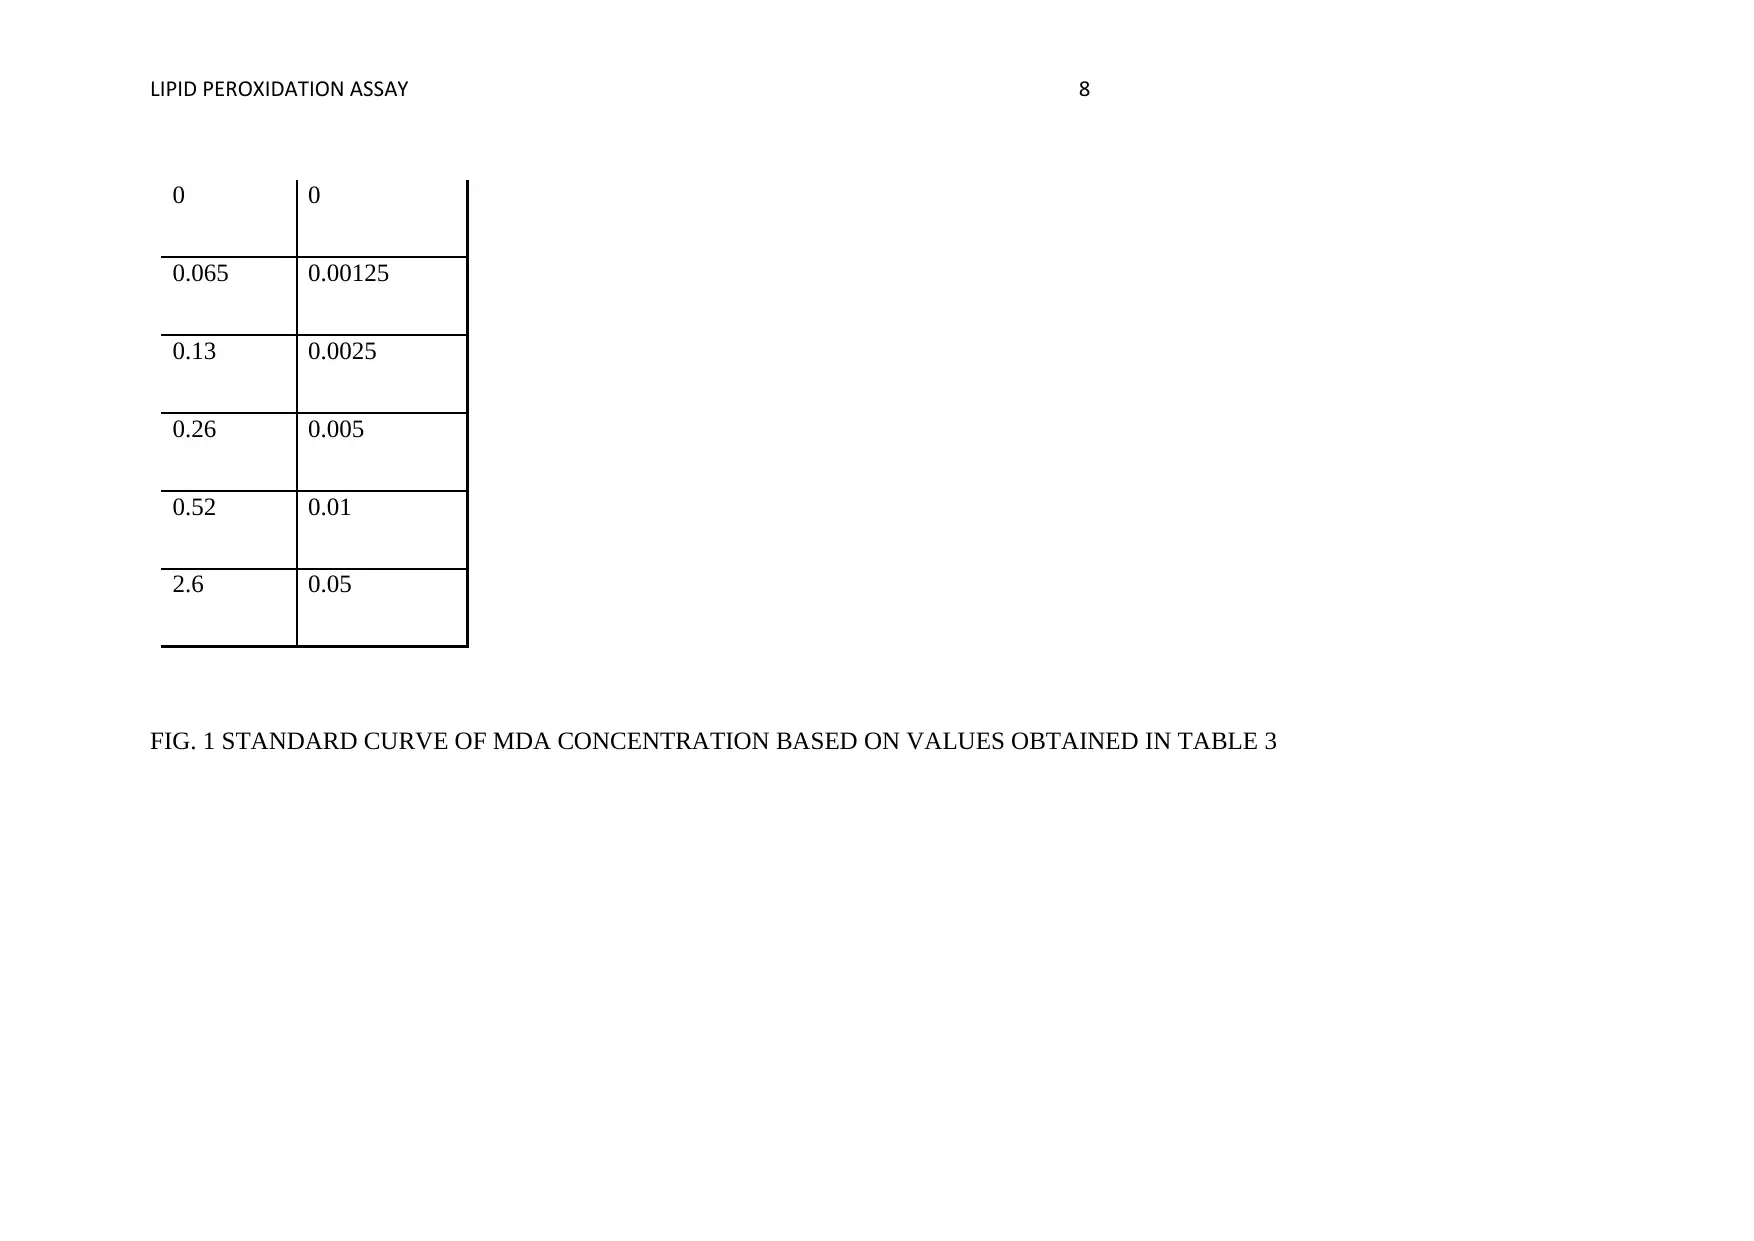
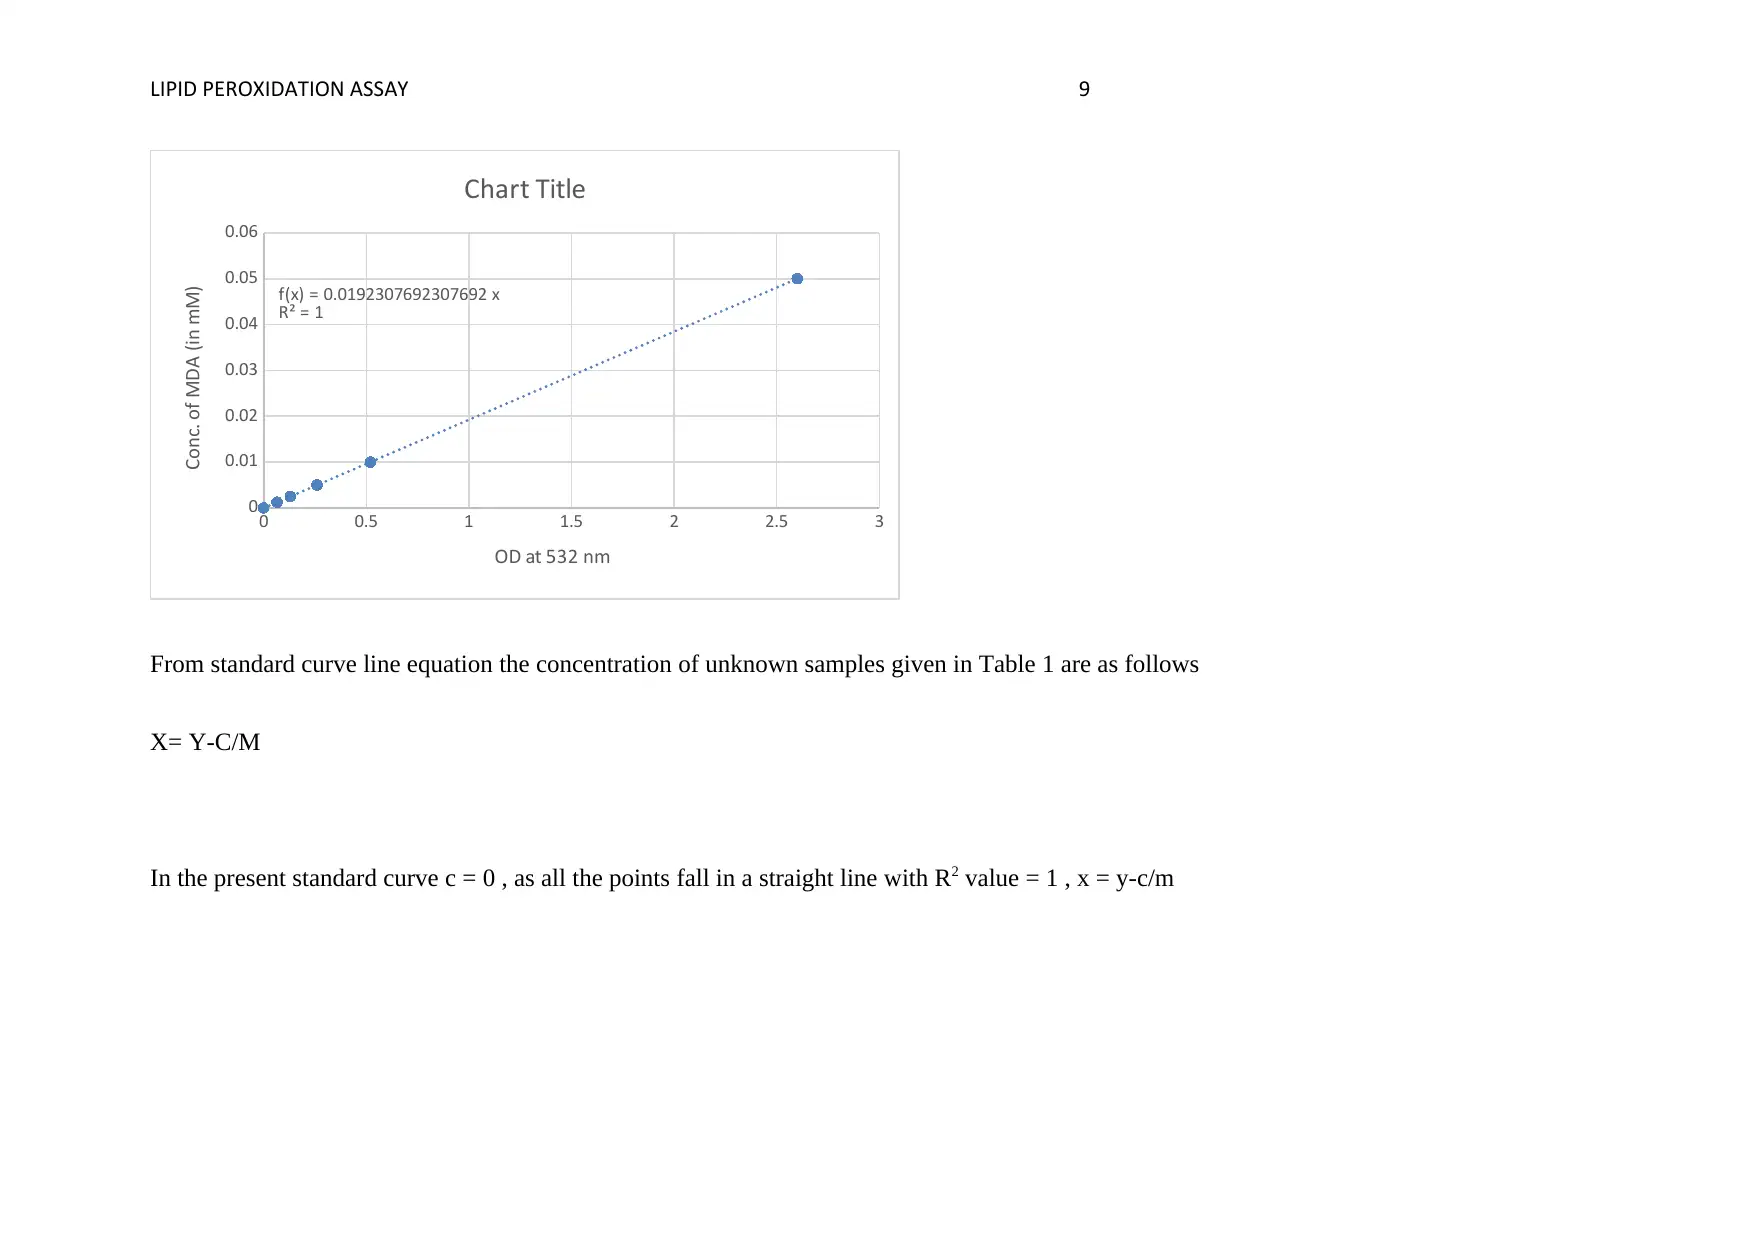
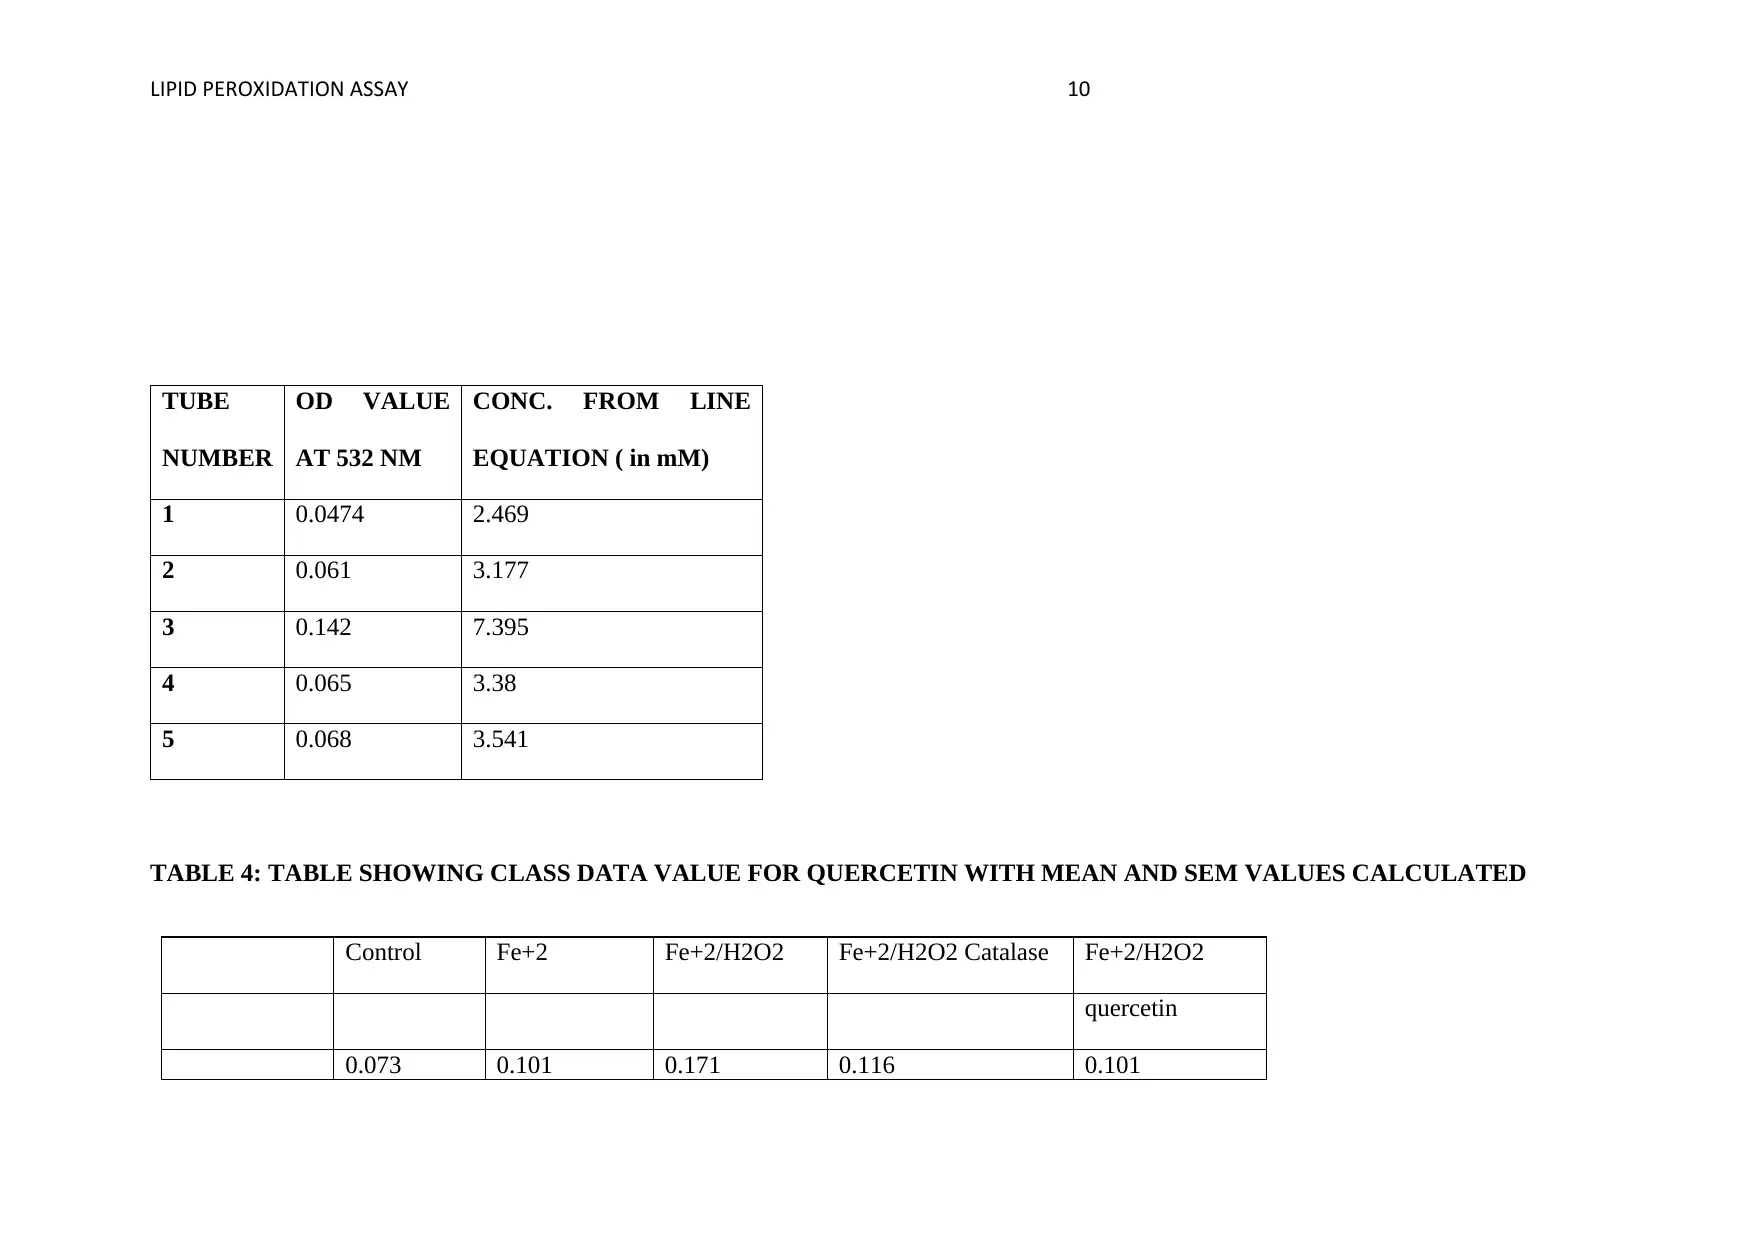
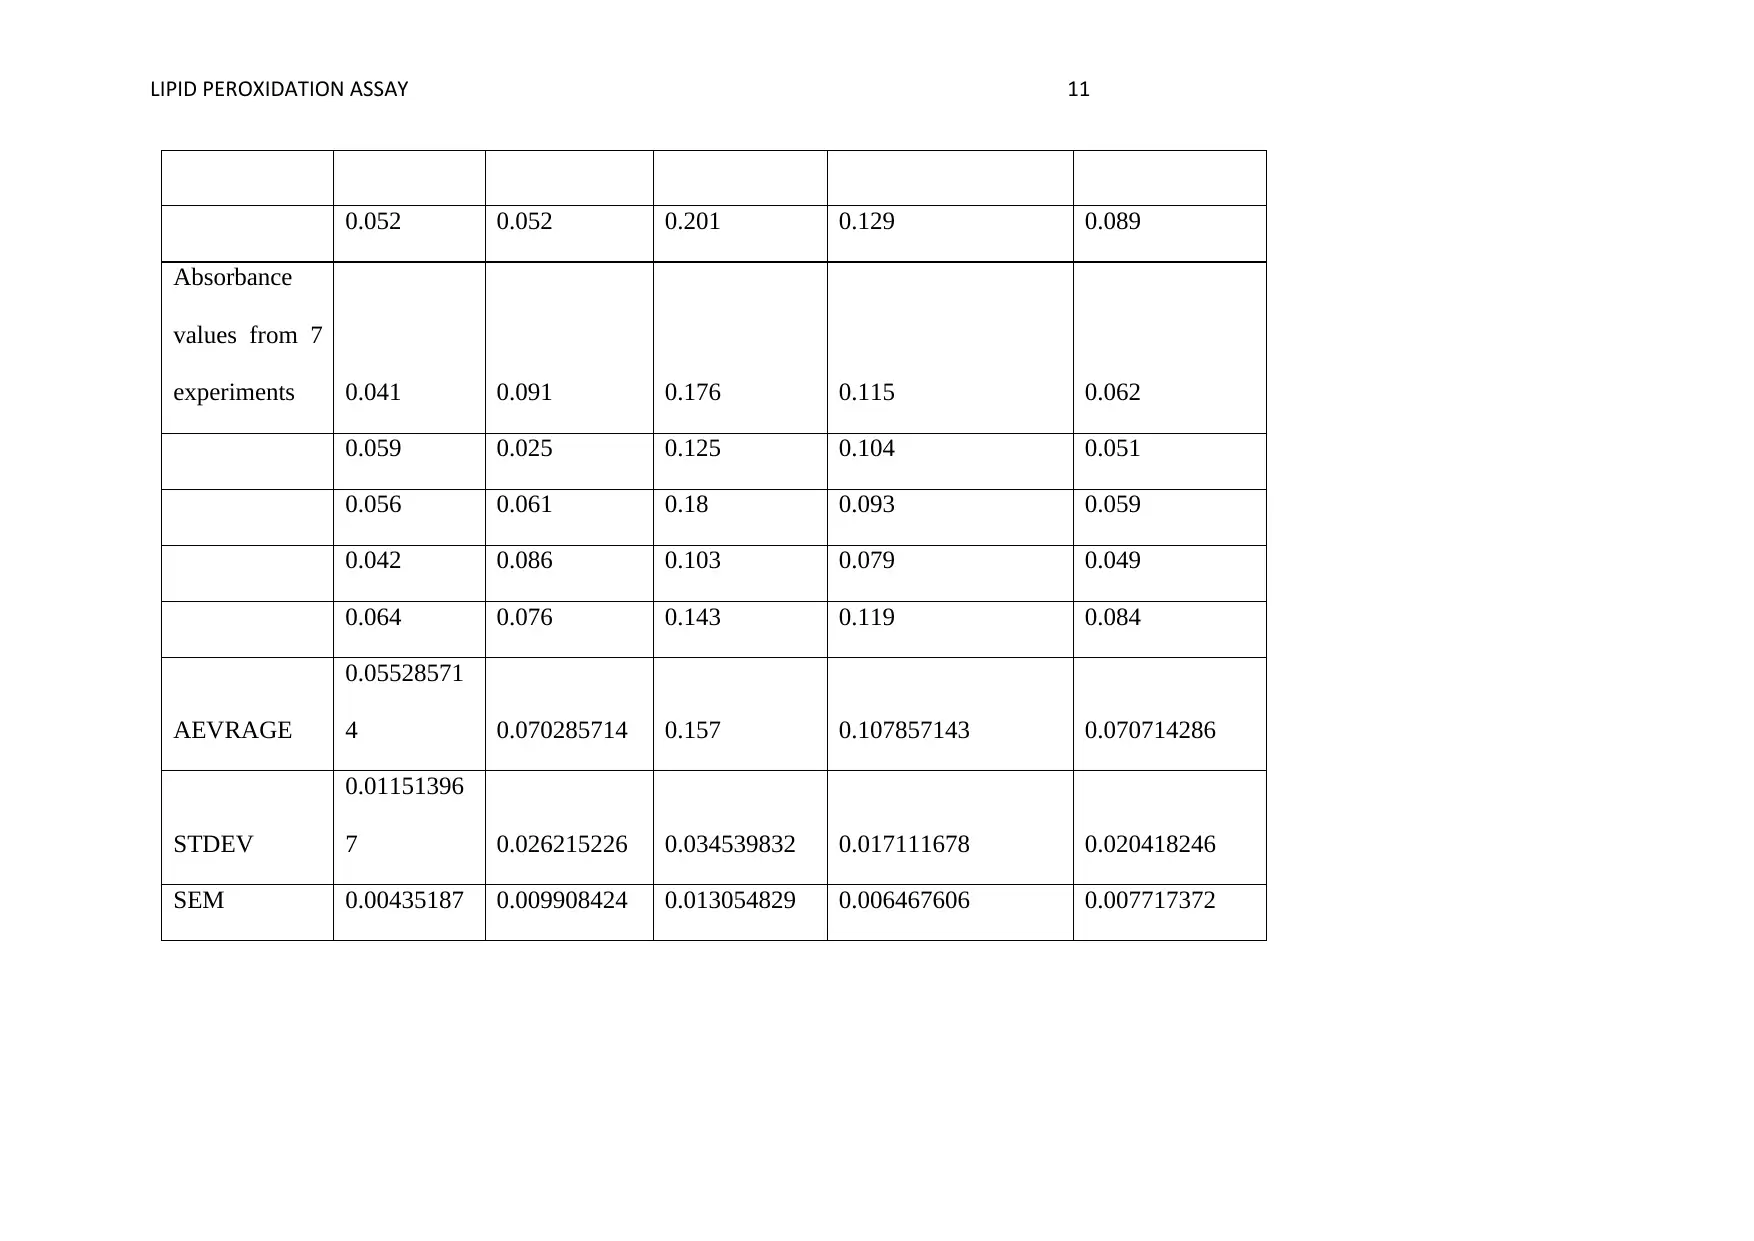
This assignment presents a lipid peroxidation assay conducted to investigate the degradative process in liver tissue and the potential protective effects of antioxidants. The assay measures malondialdehyde (MDA), an indicator of lipid peroxidation, using the thiobarbituric acid reaction. The experiment involved treating liver homogenate with various reagents, including ferrous ions, hydrogen peroxide, catalase, and quercetin (an antioxidant), and measuring the optical density (OD) at 532 nm. The results show variations in lipid peroxidation levels across different test tubes, with the control tube exhibiting the lowest OD and a tube with ferrous ions and hydrogen peroxide showing the highest. The addition of quercetin was used to demonstrate the effects of an antioxidant. Data analysis included the creation of a standard curve for MDA concentration and calculations of mean, standard deviation, and standard error of the mean. The discussion highlights the process of lipid peroxidation, the role of free radicals, the protective effects of antioxidants, and potential experimental limitations.
1 out of 18

Your All-in-One AI-Powered Toolkit for Academic Success.
+13062052269
info@desklib.com
Available 24*7 on WhatsApp / Email
![[object Object]](/_next/static/media/star-bottom.7253800d.svg)
Copyright © 2020–2026 A2Z Services. All Rights Reserved. Developed and managed by ZUCOL.