Factors Influencing Literacy Rates: A Comparative Analysis (STT100)
VerifiedAdded on 2022/09/26
|11
|2268
|37
Report
AI Summary
This report examines the factors influencing literacy rates in different countries. The study investigates the relationship between literacy rates and demographic factors like age and gender, utilizing secondary data from the UNESCO Institute for Statistics. Descriptive statistics were used to find the mean, median, and range of literacy rates across different age groups and genders. Inferential statistical tests, including ANOVA and t-tests, were conducted to determine the significance of the relationships. The results reveal that both age and gender significantly impact literacy rates, with younger populations and males generally exhibiting higher literacy levels. The analysis highlights the literacy gap and its implications for global development, offering insights into the importance of addressing these disparities.
Running head: LITERACY RATES OF DIFFERENT COUNTRIES 1
FACTORS AFFECTING LITERACY RATES FOR DIFFERENT COUNTRIES
Student name:
Institutional Affiliation:
FACTORS AFFECTING LITERACY RATES FOR DIFFERENT COUNTRIES
Student name:
Institutional Affiliation:
Paraphrase This Document
Need a fresh take? Get an instant paraphrase of this document with our AI Paraphraser
LITERACY RATES OF DIFFERENT COUNTRIES 2
Abstract
Literacy rates have been accredited by many as the sure source of a country’s
development. Furthermore high level of education has been associated with better standards of
living through reduction of poverty, high incomes by the learned, promotion of equality, health-
related benefits, reduction in crime, economic growth, environmental benefits, and reducing
gender-based violence among others. World Governments have set up schools so that both young
and adults can acquire knowledge essential for making their nations great. Likewise, parents and
people responsible for young ones have tried in all ends to ensure their children acquire this
magic of transformation. In different countries, literacy levels vary based on how favorable
literacy-affecting factors are managed. Schools fluctuate in numbers for countries. Likewise,
class and curriculum structure, methods of teaching, environment for learning, parental habits,
gender valuation, age, and government involvement among other factors influence levels at
which countries have their rates of literacy.
Several research works have been conducted to establish factors affecting literacy rates.
This study sought to establish whether age and gender affected the rates of literacy for world
countries. Descriptive statistics were conducted to give the general mean for world literacy in
gender and age. Results showed that there was a mean difference in literacy rates for age groups
as well as gender. Inferential statistics tests were conducted to confirm the relationship between
gender and age on levels of literacy. From the results, both age and gender have a significant
influence on countries’ rates of literacy.
LITERACY RATES OF DIFFERENT COUNTRIES 3
Introduction
Literacy rates refer to the aggregate sum of educated persons in a specific age group,
conveyed as a percentage of the entire population for that specific cohort. Literacy rates among
the adult measure the total number of learned persons for people aged 15 years and above while
youth literacy rate measures literacy for people of 15-24. It is calculated by dividing the literate
number of a given cohort by the total population for that respective age group (UNESCO
INSTITUTE FOR STATISTICS, 2019). The current average literacy value for the world is
86.3%; 90% for males and 82.7% for females translating to a 7.3% gender difference.
Nonetheless, this varies per country depending on conditions. For a long period, world countries
have struggled to fill the gender gap in education. However, west and central African countries,
and southern Asian countries still have a large gap to fill. For instance, countries like India have
a wide gap as literate men are 80% while women are 65.46% strongly showing that gender
remains a factor that influences literacy rates (VITAL VOICES, 2019).
There is a difference in literacy rates for young and old adults; young people are proved to
have high rates of literacy than the aging persons. This, however, vary from country to country.
With the aging adults nearing retirement, countries invest much knowledge in the young to
replace them this is essential for the forward and positive growth of a country.
Statement of the problem
The study sought to find the relationship between the literacy rate and two demographic
factors (age and gender). This will be important in sorting the problem of low literacy levels in
different countries that have threatened some countries' development.
⊘ This is a preview!⊘
Do you want full access?
Subscribe today to unlock all pages.
Trusted by 1+ million students worldwide
LITERACY RATES OF DIFFERENT COUNTRIES 4
Research Questions
1. Is there a significant relationship between literacy rate and age?
2. Does literacy rate for different countries vary by gender?
Research Hypothesis
1. Null hypothesis (H0): There is no significant relationship between age and literacy rate in
different countries
The alternative hypothesis (HA): There is a significant relationship between age and
literacy rate in different countries
2. Null hypothesis (H0): There is no significant difference in the literacy rate for the male
and female in various countries.
The alternative hypothesis (HA): There is a significant difference in the literacy rate for
males and females.
Literature Review
The rate of literacy for both the youths (15-24) and adults are the determinants for a
system of education. There has been observed a positive trend in this number due to the
expanded opportunities of education with youth’s literacy level increasing to 91% over the past
two decades (UNICEF, 2019). Countries vary according to rates of literacy. According to 2019
statistics North Korea was number one in the list for countries with the highest rates of literacy at
100%. It was followed closely by Latvia, Ukraine, Tajikistan, Poland, Lithuania, Kazakhstan,
Azerbaijan and Georgian countries (Tigernix, 2019). In general rates of literacy are high in
developed countries with sufficient facilities and resources to support. However, in various
Paraphrase This Document
Need a fresh take? Get an instant paraphrase of this document with our AI Paraphraser
LITERACY RATES OF DIFFERENT COUNTRIES 5
places of Central and West Africa, the literacy rates among the youths still lie below 50%
suggesting that there is low enrolment along with low rates of retention.
About 67% of the countries have achieved an almost equal gender in literacy rates.
Nonetheless, countries in west and central Africa, and South Asia have a significantly higher
number of illiterate females. A gender parity 0.85 stands for the west and central Africa showing
that out of every 100 women, 85 are illiterate (UNICEF, 2019). This comes about due to the
developing state of these African countries and the level of campaign against gender biases.
The youths and young adults enjoy the advantage of the latest schooling and make a larger
proportion of those with extended formal education when compared to aging adults. However,
older adults benefit heavily from experience. Considering age specifically, there is a high rate of
literacy among younger adults as compared to the almost retiring adults (Reynard, 2017). This,
however, differ across countries; Belgium, Finland, Slovenia, Canada, and Poland have a more
than 50 point difference in the literacy rates for these two age groups. On the other hand, New
Zealand and the USA have a rate difference of fewer than 20 points for the age groups.
Furthermore, the literacy score range is larger for older adults even though some countries
display a fair similarity for both age groups (Statistics Canada, 2000).
Generally, countries with low rates of literacy like Chad, 30.8%, are relatively less
developed. Such countries suffer from less available manpower and personnel to work in various
fields, lower-income, lower-quality jobs, lower living standards, high levels of unemployment,
inability to acquire and understand important information, limited access to long educational and
professional developments, and spending much in importing specialists. Likewise, they suffer
from an international trade deficit, and low economic growth (Literacy Foundation, 2020).
LITERACY RATES OF DIFFERENT COUNTRIES 6
Methodology
This research involved the use of secondary data acquired from the UNESCO Institute of
Statistics (UNESCO institute for statistics, 2020). A cleaning process was conducted where
countries with no data were removed. The data was then put to a descriptive statistics calculator
which calculated descriptive statistics. Further, an inferential analysis was conducted on
Microsoft Excel.
Results
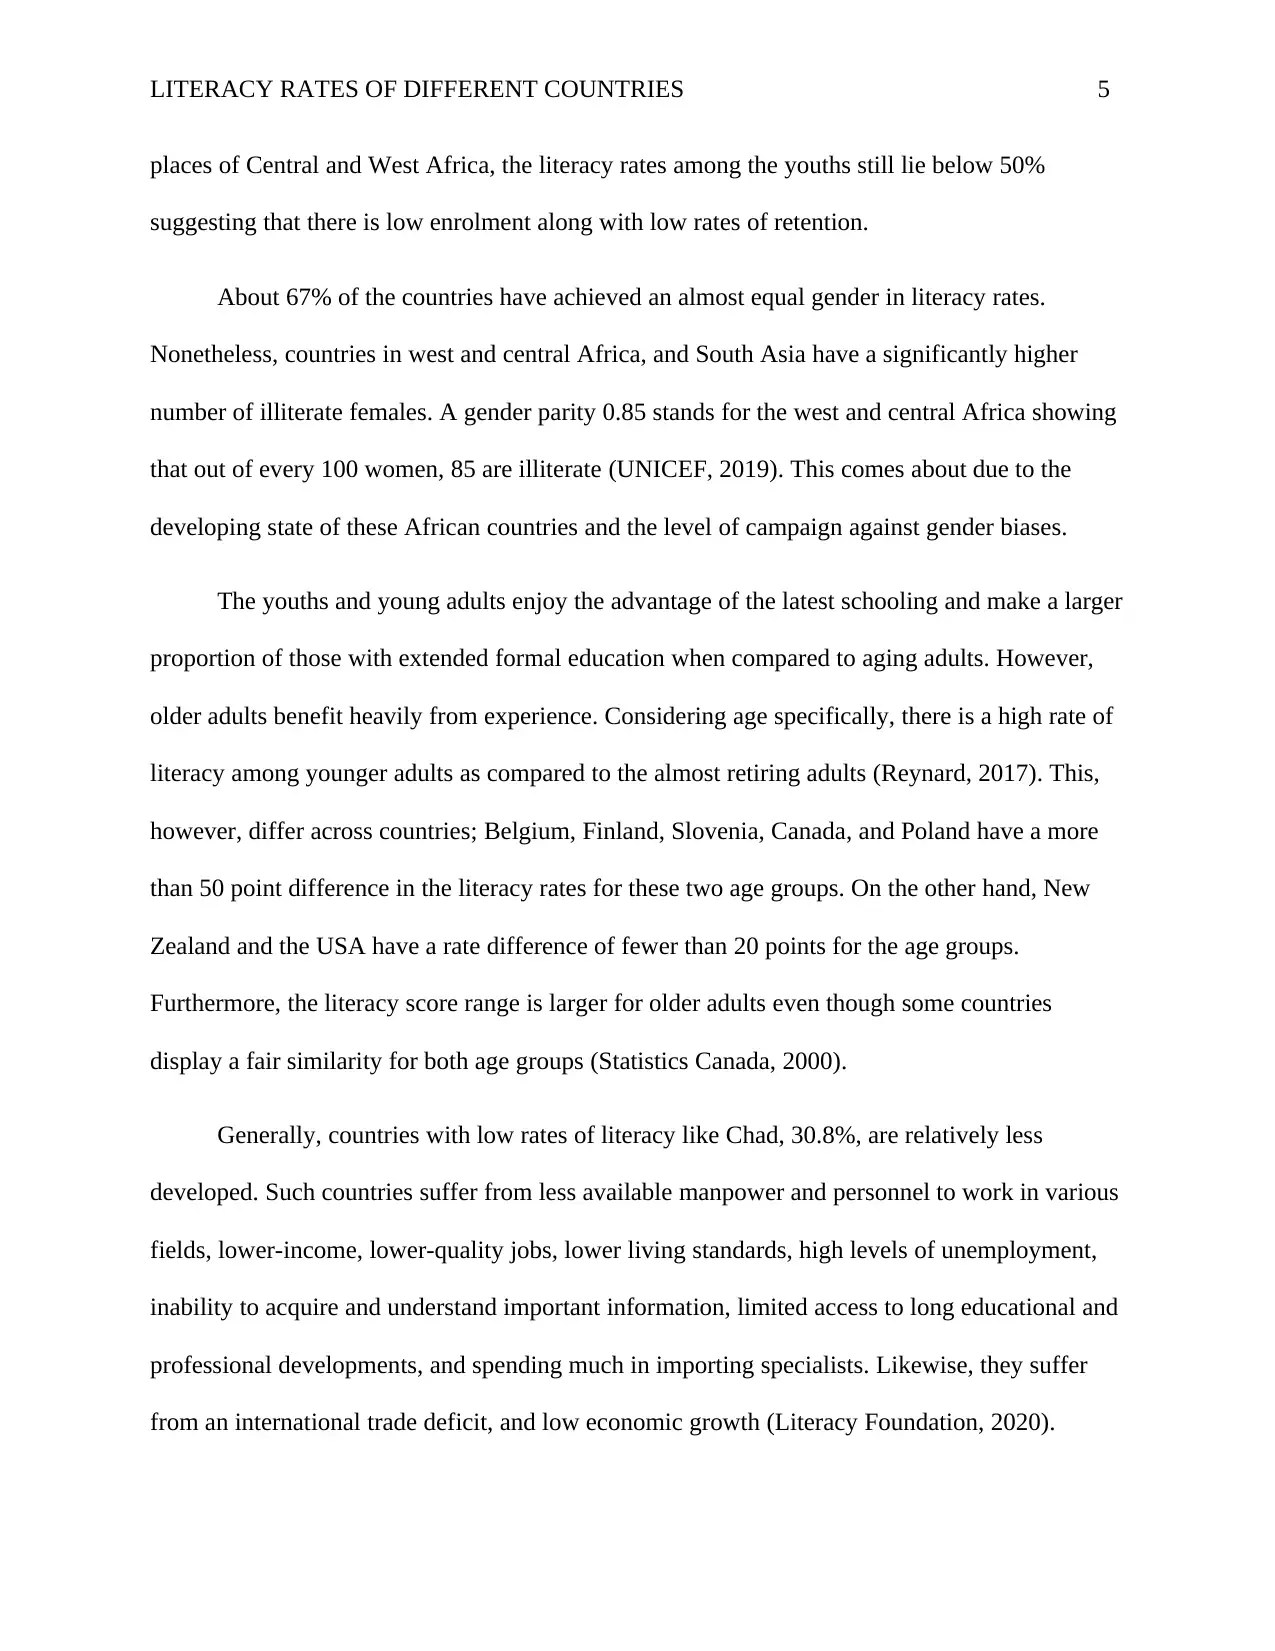
Fig 1. Graph of youth gender parity index
A graph of gender parity index bar graph showed that many youths had a parity index of 1.00,
(N=123, 74.1%). This was followed by 0.90 (N=16, 9.6%) and 0.70 and 0.80 both of (N=7,
4.2%). Least number of youth index recorded were for 0.50, 0.83, 0.97 and 1.20 (N=1, 0.6%).
Methodology
This research involved the use of secondary data acquired from the UNESCO Institute of
Statistics (UNESCO institute for statistics, 2020). A cleaning process was conducted where
countries with no data were removed. The data was then put to a descriptive statistics calculator
which calculated descriptive statistics. Further, an inferential analysis was conducted on
Microsoft Excel.
Results
Fig 1. Graph of youth gender parity index
A graph of gender parity index bar graph showed that many youths had a parity index of 1.00,
(N=123, 74.1%). This was followed by 0.90 (N=16, 9.6%) and 0.70 and 0.80 both of (N=7,
4.2%). Least number of youth index recorded were for 0.50, 0.83, 0.97 and 1.20 (N=1, 0.6%).
⊘ This is a preview!⊘
Do you want full access?
Subscribe today to unlock all pages.
Trusted by 1+ million students worldwide
LITERACY RATES OF DIFFERENT COUNTRIES 7
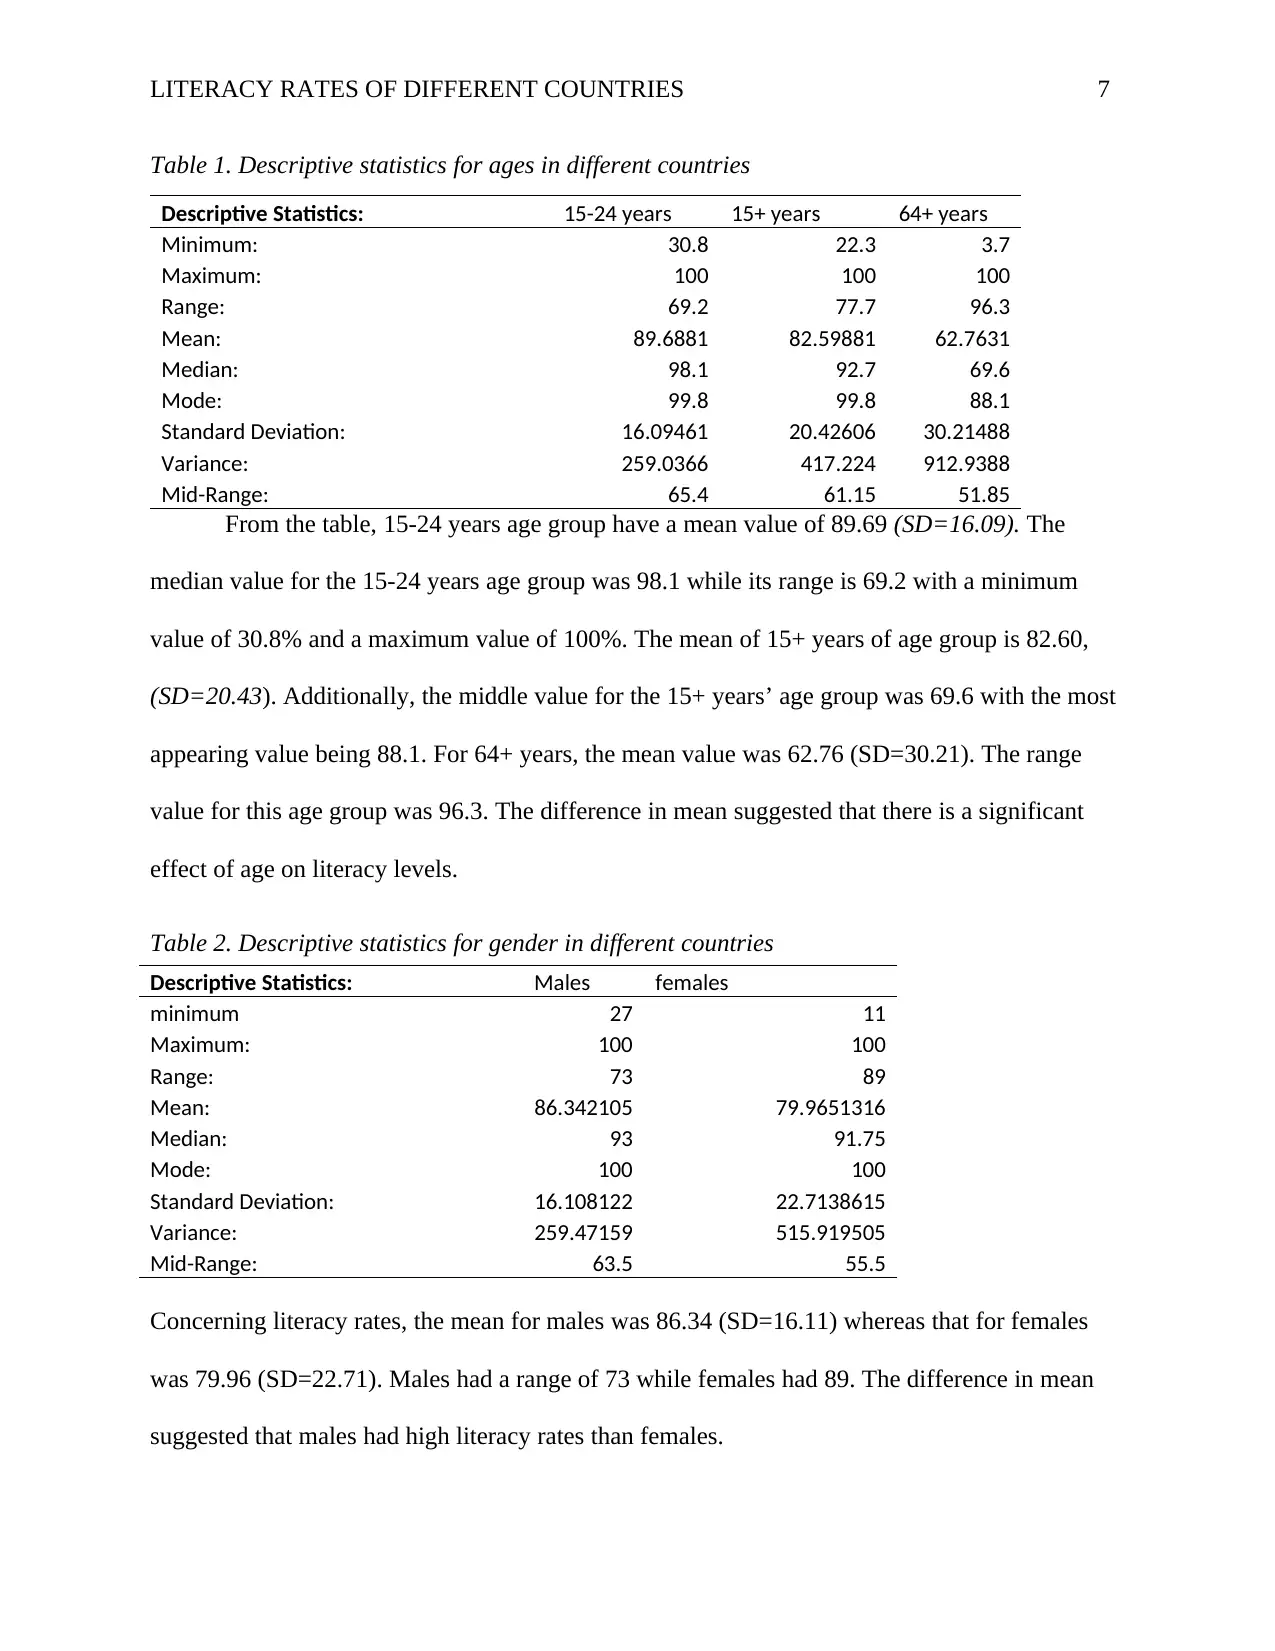
Table 1. Descriptive statistics for ages in different countries
Descriptive Statistics: 15-24 years 15+ years 64+ years
Minimum: 30.8 22.3 3.7
Maximum: 100 100 100
Range: 69.2 77.7 96.3
Mean: 89.6881 82.59881 62.7631
Median: 98.1 92.7 69.6
Mode: 99.8 99.8 88.1
Standard Deviation: 16.09461 20.42606 30.21488
Variance: 259.0366 417.224 912.9388
Mid-Range: 65.4 61.15 51.85
From the table, 15-24 years age group have a mean value of 89.69 (SD=16.09). The
median value for the 15-24 years age group was 98.1 while its range is 69.2 with a minimum
value of 30.8% and a maximum value of 100%. The mean of 15+ years of age group is 82.60,
(SD=20.43). Additionally, the middle value for the 15+ years’ age group was 69.6 with the most
appearing value being 88.1. For 64+ years, the mean value was 62.76 (SD=30.21). The range
value for this age group was 96.3. The difference in mean suggested that there is a significant
effect of age on literacy levels.
Table 2. Descriptive statistics for gender in different countries
Concerning literacy rates, the mean for males was 86.34 (SD=16.11) whereas that for females
was 79.96 (SD=22.71). Males had a range of 73 while females had 89. The difference in mean
suggested that males had high literacy rates than females.
Descriptive Statistics: Males females
minimum 27 11
Maximum: 100 100
Range: 73 89
Mean: 86.342105 79.9651316
Median: 93 91.75
Mode: 100 100
Standard Deviation: 16.108122 22.7138615
Variance: 259.47159 515.919505
Mid-Range: 63.5 55.5
Paraphrase This Document
Need a fresh take? Get an instant paraphrase of this document with our AI Paraphraser
LITERACY RATES OF DIFFERENT COUNTRIES 8
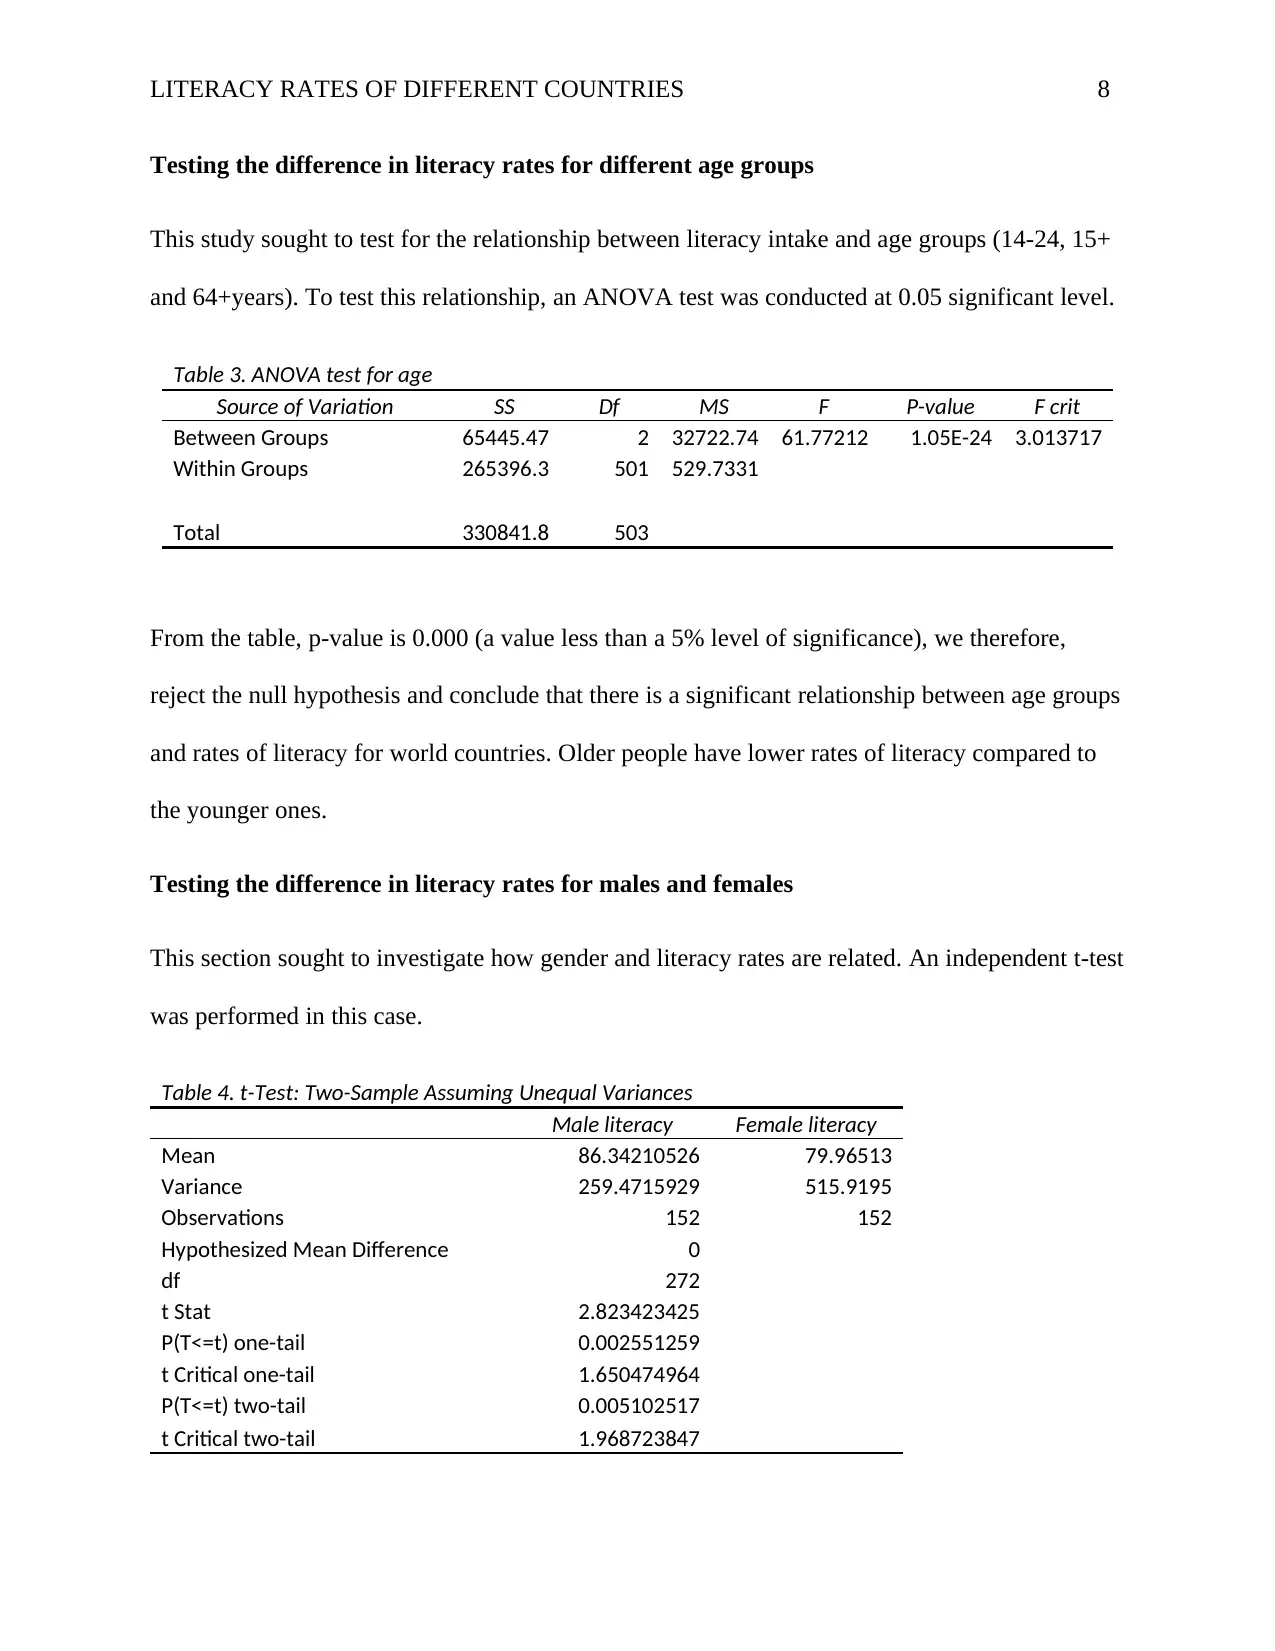
Testing the difference in literacy rates for different age groups
This study sought to test for the relationship between literacy intake and age groups (14-24, 15+
and 64+years). To test this relationship, an ANOVA test was conducted at 0.05 significant level.
Table 3. ANOVA test for age
Source of Variation SS Df MS F P-value F crit
Between Groups 65445.47 2 32722.74 61.77212 1.05E-24 3.013717
Within Groups 265396.3 501 529.7331
Total 330841.8 503
From the table, p-value is 0.000 (a value less than a 5% level of significance), we therefore,
reject the null hypothesis and conclude that there is a significant relationship between age groups
and rates of literacy for world countries. Older people have lower rates of literacy compared to
the younger ones.
Testing the difference in literacy rates for males and females
This section sought to investigate how gender and literacy rates are related. An independent t-test
was performed in this case.
Table 4. t-Test: Two-Sample Assuming Unequal Variances
Male literacy Female literacy
Mean 86.34210526 79.96513
Variance 259.4715929 515.9195
Observations 152 152
Hypothesized Mean Difference 0
df 272
t Stat 2.823423425
P(T<=t) one-tail 0.002551259
t Critical one-tail 1.650474964
P(T<=t) two-tail 0.005102517
t Critical two-tail 1.968723847
LITERACY RATES OF DIFFERENT COUNTRIES 9
From the test, there was a significant difference in literacy rates for the males (M=86.34,
SD=126.11, N=152) and females (M=79.97, SD=22.71, N=152) conditions; t (271) =2.82,
p=0.002. This result suggests that we reject the null hypothesis at 5% significant level and
conclude that there is a significant difference in the literacy rates for males and females in world
countries. Males are highly literate compared to females.
Conclusion
The study aimed at examining how age and gender affect the rates of literacy for different
countries. From the results, gender is vital in determining world literacy rates. Males have higher
percentage rates of literacy rates as compared to females. Likewise, age is significantly related to
the rates of literacy. For instance, younger people tend to be more literate than the old ones.
⊘ This is a preview!⊘
Do you want full access?
Subscribe today to unlock all pages.
Trusted by 1+ million students worldwide
LITERACY RATES OF DIFFERENT COUNTRIES 10
References
Literacy Foundation. (2020). Consequences of illiteracy. Causes of Illiteracy. Retrieved from
https://www.fondationalphabetisation.org/en/causes-of-illiteracy/consequences-of-
illiteracy/
Reynard, R. (2017). Technology and digital media are changing the meaning of literacy and
creating new challenges for teaching and learning. Redefining Literacy in the Digital Age.
Retrieved from https://campustechnology.com/articles/2017/01/10/redefining-literacy-in-
the-digital-age.aspx
Statistics Canada. (2000). LIteracy in the Information age. Final Report of The Internation Adult
Literacy Survey, 33.
Tigernix. (2019, October 11). Who are the world's top 15 countries with high literacy rates in
2019? Retrieved from https://www.tigernix.com/home/blog/top-15-literacy-rate-2019
UNESCO INSTITUTE FOR STATISTICS. (2019). Literacy rate. Sustainable Development
Goals. Retrieved from http://uis.unesco.org/en/glossary-term/literacy-rate
UNESCO Institute for statistics. (2020, March 25). List of countries by literacy rate. Retrieved
from https://en.wikipedia.org/wiki/List_of_countries_by_literacy_rate
UNICEF. (2019). Literacy among youth is rising, but young women lag. Literacy. Retrieved
from https://data.unicef.org/topic/education/literacy/
VITAL VOICES. (2019). The Literacy Gender Gap. International Literacy Day: The Literacy
Gender Gap. Retrieved from https://www.vitalvoices.org/2019/09/international-literacy-
day-the-literacy-gender-gap/
Paraphrase This Document
Need a fresh take? Get an instant paraphrase of this document with our AI Paraphraser

LITERACY RATES OF DIFFERENT COUNTRIES 11
1 out of 11
Related Documents


Your All-in-One AI-Powered Toolkit for Academic Success.
+13062052269
info@desklib.com
Available 24*7 on WhatsApp / Email
![[object Object]](/_next/static/media/star-bottom.7253800d.svg)
Unlock your academic potential
Copyright © 2020–2026 A2Z Services. All Rights Reserved. Developed and managed by ZUCOL.