Comprehensive Analysis and Forecasting of Liverpool Wind Speed Data

Verified

Added on  2021/02/20

|10
|1738
|60
Report
AI Summary
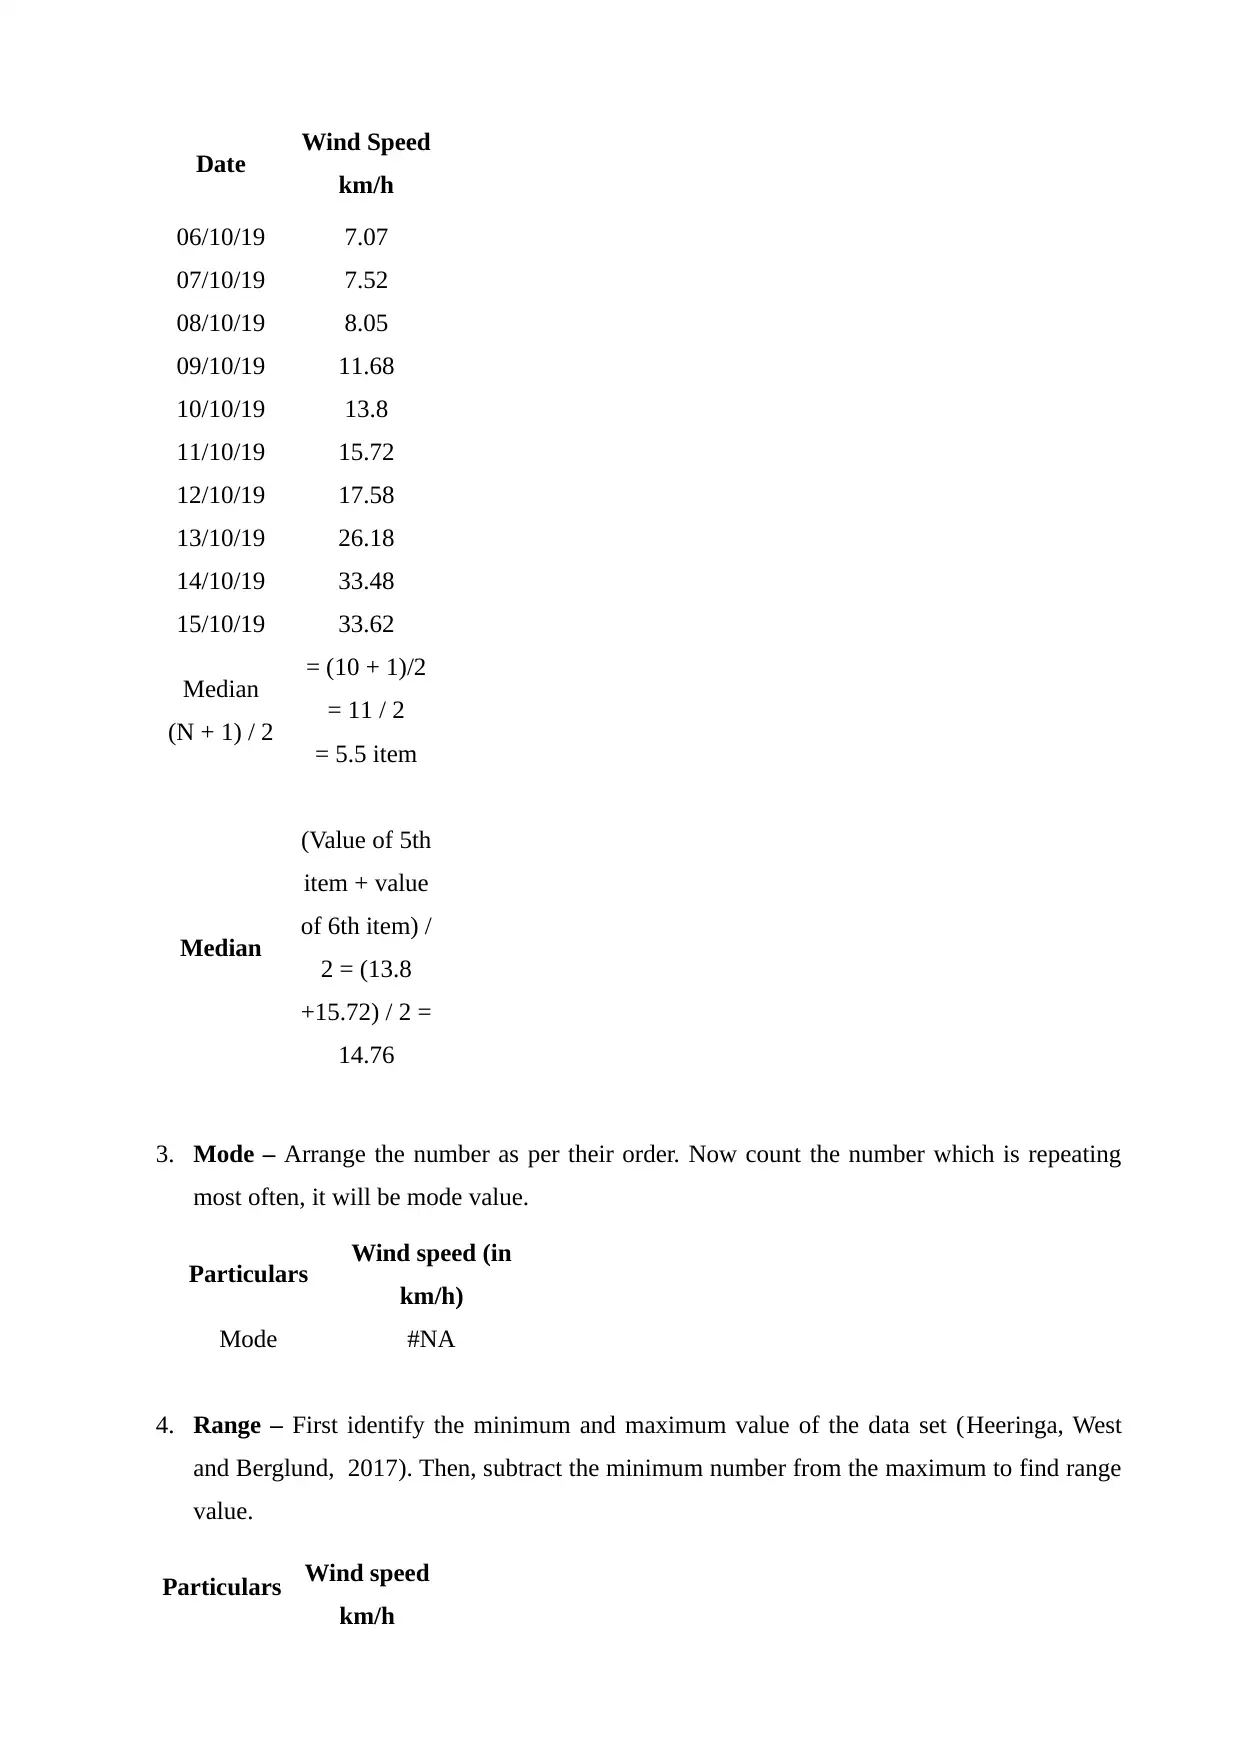
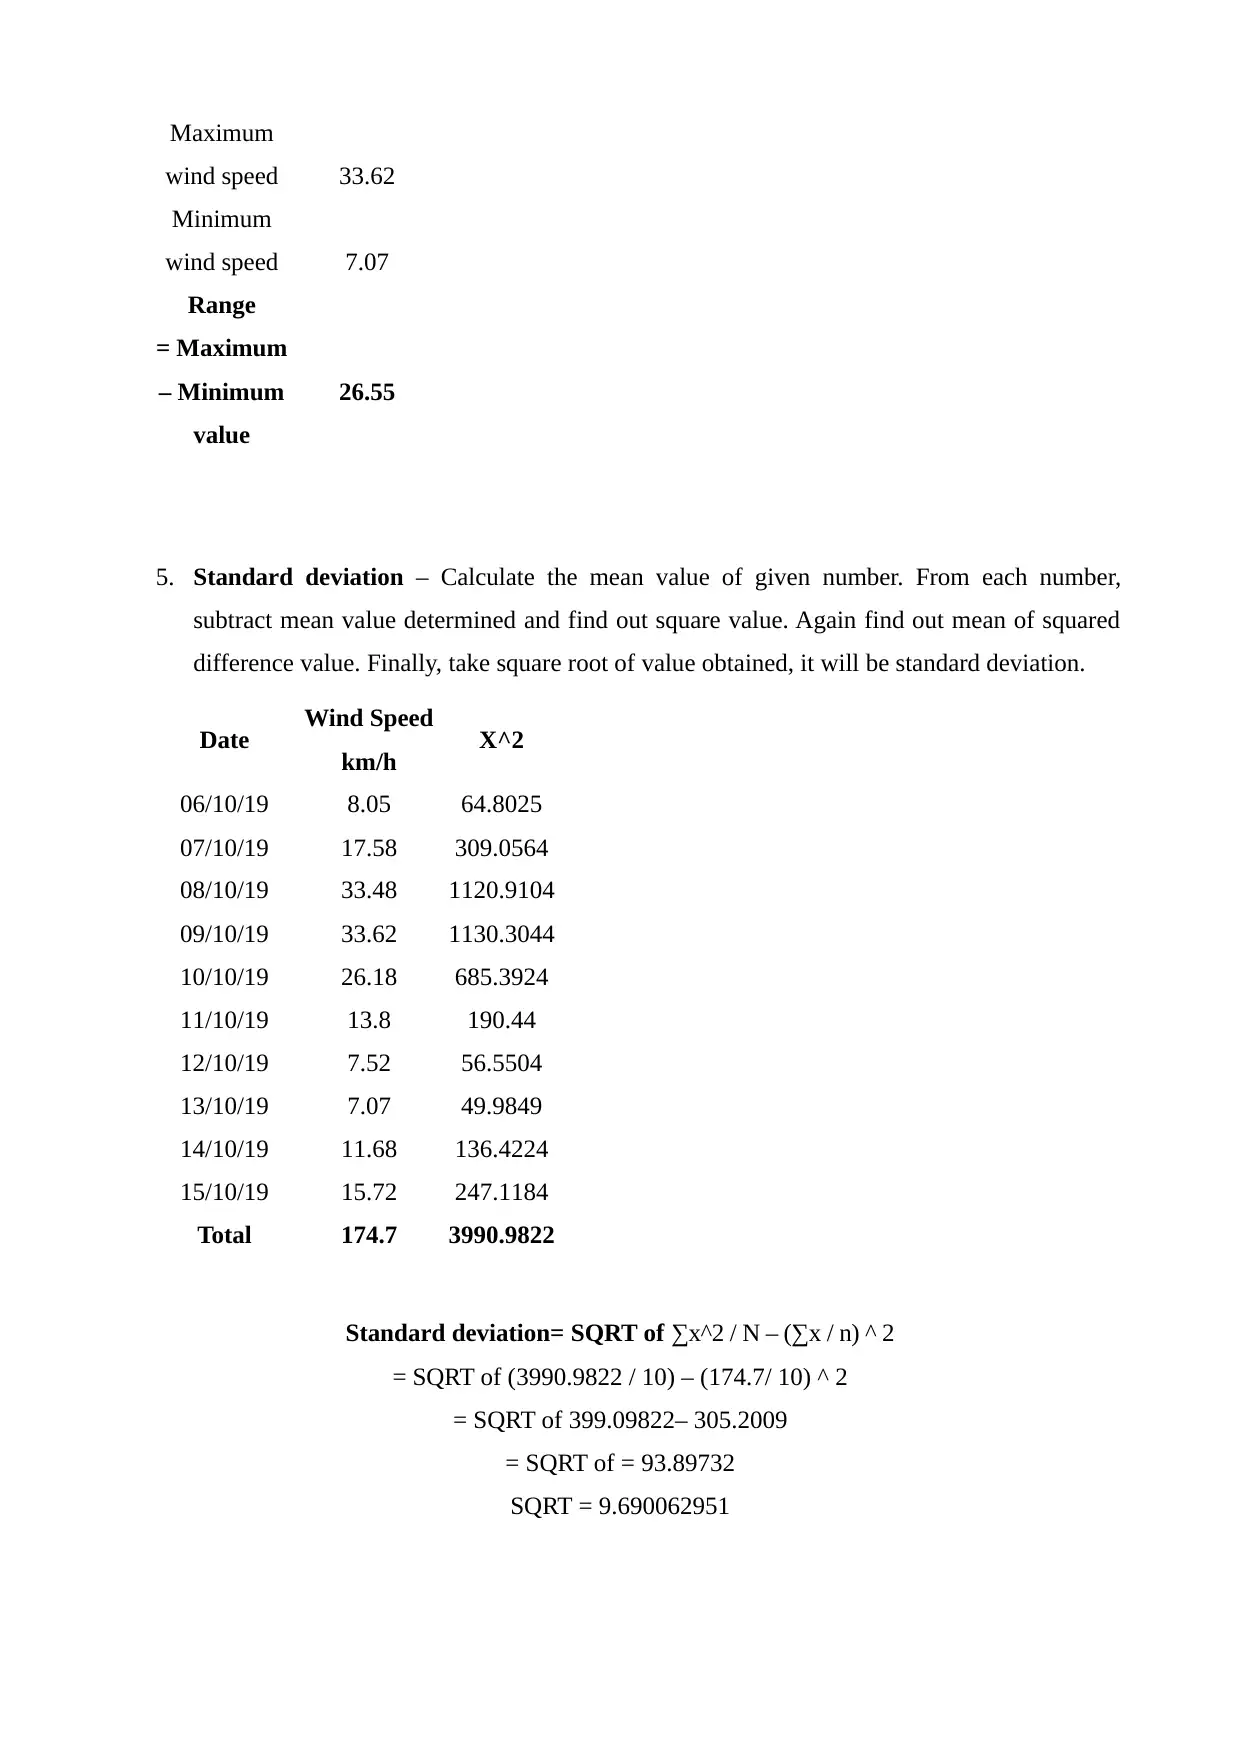
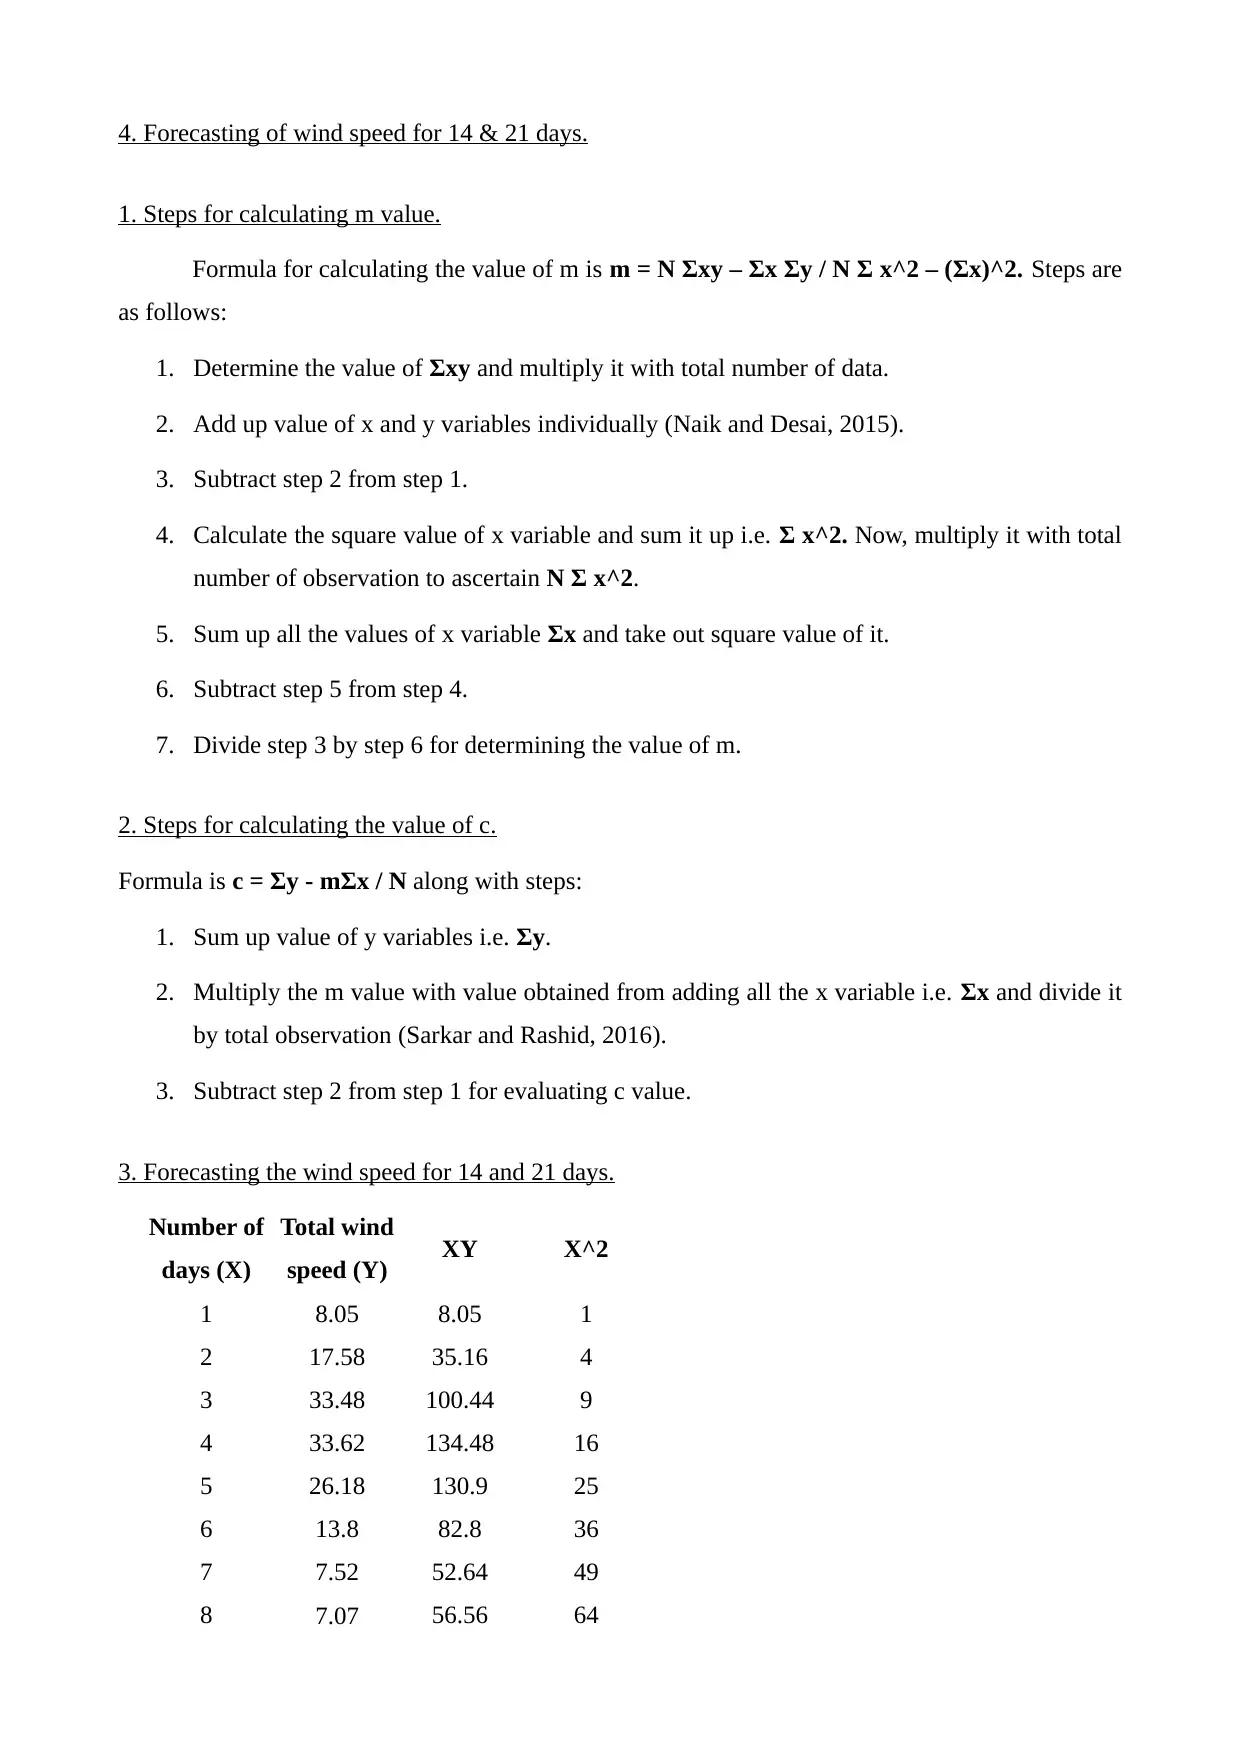
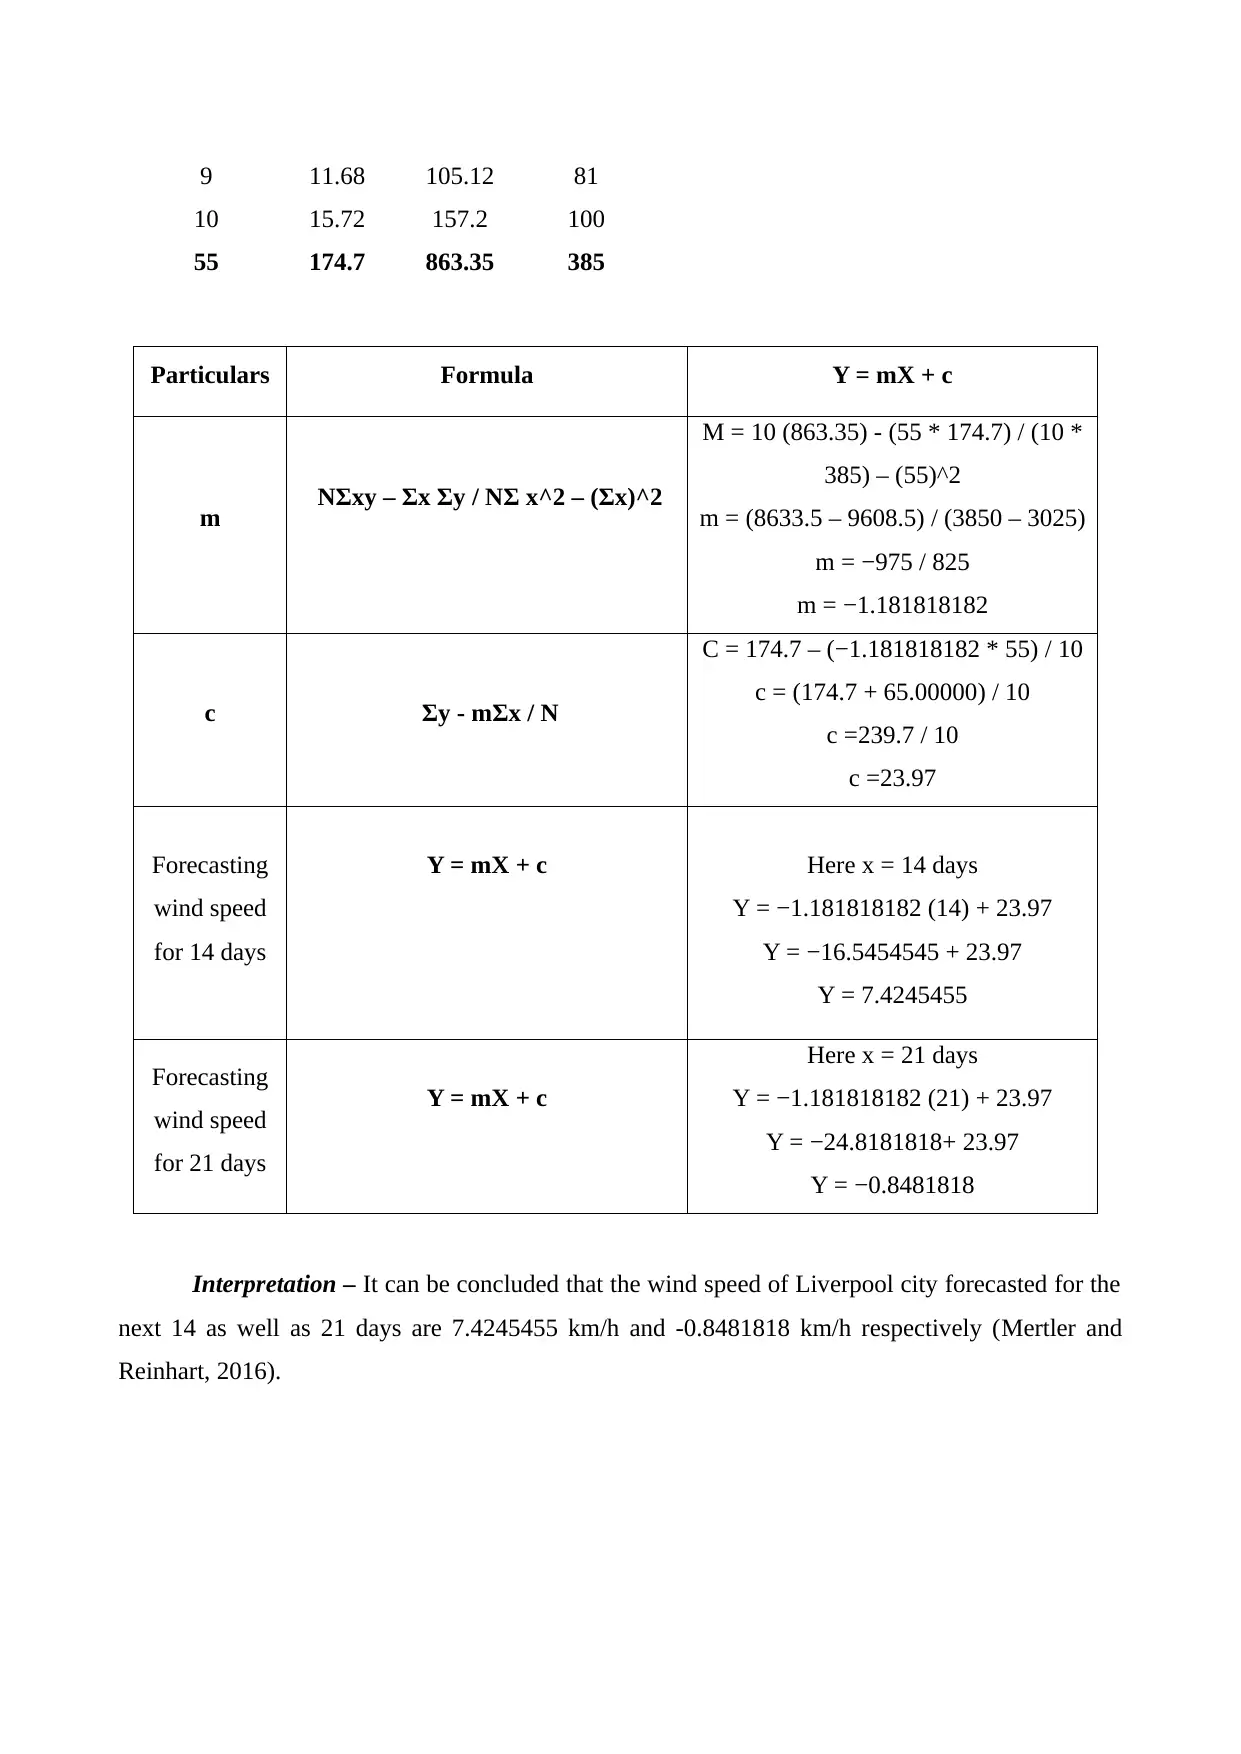
This report presents a comprehensive analysis of wind speed data collected over ten consecutive days in Liverpool, UK. The analysis begins with the arrangement of data in tabular form, followed by the visual presentation of data through bar and line charts. The report then calculates key statistical measures, including mean, median, mode, range, and standard deviation, providing a detailed understanding of the dataset's characteristics. Furthermore, the report employs linear forecasting techniques to predict wind speeds for the subsequent 14 and 21 days. The methodology for calculating the 'm' and 'c' values, essential components of the linear equation, is clearly outlined. The report concludes with an interpretation of the findings, highlighting the fluctuating wind speed patterns and the forecasted values for future days.
Document Page
Numeracy and data analysis
tabler-icon-diamond-filled.svg

Paraphrase This Document

Need a fresh take? Get an instant paraphrase of this document with our AI Paraphraser
Document Page
Table of Contents
INTRODUCTION ...............................................................................................................................3
MAIN BODY.......................................................................................................................................3
1. Arrangement of data in table form. .............................................................................................3
2. Presentation of data in chart and graph form...............................................................................3
3. Calculation of data set..................................................................................................................4
4. Forecasting of wind speed for 14 & 21 days...............................................................................7
1. Steps for calculating m value.......................................................................................................7
2. Steps for calculating the value of c..............................................................................................7
3. Forecasting the wind speed for 14 and 21 days...........................................................................7
CONCLUSION....................................................................................................................................9
REFERENCES...................................................................................................................................10
Document Page
INTRODUCTION
Analysis of data is considered as one of the most important part of the research study which has to
be done in an effective as well as proper manner so as to determine a clear picture of data gathered.
With the help of different statistical tools and measures such as charts, graphs, excels etc. this report
will provide data analysis of all the data collected related to the wind speed of last 10 consecutive
days of Liverpool city, United Kingdom. At last, linear forecasting will be done of wind speed for
14 as well as 21 days of Liverpool city.
MAIN BODY
1. Arrangement of data in table form.
Date Wind speed
km/h
06/10/19 8.05
07/10/19 17.58
08/10/19 33.48
09/10/19 33.62
10/10/19 26.18
11/10/19 13.8
12/10/19 7.52
13/10/19 7.07
14/10/19 11.68
15/10/19 15.72
2. Presentation of data in chart and graph form.
1. Bar chart
Document Page
2. Line chart
Interpretation -From the above bar graph as well as line chart it can be interpreted that the
wind speed of Liverpool city, UK has been showing fluctuating trend in the past 10 consecutive
days (Chambers, 2017). The maximum wind speed of the Liverpool city was 33.62 km/hr as on 9
October 2019 with the lowest speed of wind as 7.07 km/hr on 13 October 2019.
06/10/2019
07/10/2019
08/10/2019
09/10/2019
10/10/2019
11/10/2019
12/10/2019
13/10/2019
14/10/2019
15/10/2019
0
5
10
15
20
25
30
35
40
Wind speed km/hr
06/10/2019
07/10/2019
08/10/2019
09/10/2019
10/10/2019
11/10/2019
12/10/2019
13/10/2019
14/10/2019
15/10/2019
0 5 10 15 20 25 30 35 40
8.05
17.58
33.48
33.62
26.18
13.8
7.52
7.07
11.68
15.72
Wind speed km/hr
tabler-icon-diamond-filled.svg

Paraphrase This Document

Need a fresh take? Get an instant paraphrase of this document with our AI Paraphraser
Document Page
3. Calculation of data set.
Particular Wind speed
km/h
Mean 17.47
Median 14.76
Mode #NA
Range 26.55
Standard
deviation 10.21
1. Mean – Add all the values of the given data set (Wickham, 2016). Now divide the value
obtain from adding up with the total number of items present to ascertain mean value.
Date Wind Speed km/h
06/10/19 8.05
07/10/19 17.58
08/10/19 33.48
09/10/19 33.62
10/10/19 26.18
11/10/19 13.8
12/10/19 7.52
13/10/19 7.07
14/10/19 11.68
15/10/19 15.72
N = 10
Total (∑X) 174.7
Mean
∑X ÷ N
174.7/ 10
= 17.47
2. Median – Sort out all the items in data set by arranging in ascending order (Crowder,
2017). Find out average value of the two middle number value.
Document Page
Date Wind Speed
km/h
06/10/19 7.07
07/10/19 7.52
08/10/19 8.05
09/10/19 11.68
10/10/19 13.8
11/10/19 15.72
12/10/19 17.58
13/10/19 26.18
14/10/19 33.48
15/10/19 33.62
Median
(N + 1) / 2
= (10 + 1)/2
= 11 / 2
= 5.5 item
Median
(Value of 5th
item + value
of 6th item) /
2 = (13.8
+15.72) / 2 =
14.76
3. Mode – Arrange the number as per their order. Now count the number which is repeating
most often, it will be mode value.
Particulars Wind speed (in
km/h)
Mode #NA
4. Range – First identify the minimum and maximum value of the data set (Heeringa, West
and Berglund, 2017). Then, subtract the minimum number from the maximum to find range
value.
Particulars Wind speed
km/h
Document Page
Maximum
wind speed 33.62
Minimum
wind speed 7.07
Range
= Maximum
– Minimum
value
26.55
5. Standard deviation – Calculate the mean value of given number. From each number,
subtract mean value determined and find out square value. Again find out mean of squared
difference value. Finally, take square root of value obtained, it will be standard deviation.
Date Wind Speed
km/h X^2
06/10/19 8.05 64.8025
07/10/19 17.58 309.0564
08/10/19 33.48 1120.9104
09/10/19 33.62 1130.3044
10/10/19 26.18 685.3924
11/10/19 13.8 190.44
12/10/19 7.52 56.5504
13/10/19 7.07 49.9849
14/10/19 11.68 136.4224
15/10/19 15.72 247.1184
Total 174.7 3990.9822
Standard deviation= SQRT of ∑x^2 / N – (∑x / n) ^ 2
= SQRT of (3990.9822 / 10) – (174.7/ 10) ^ 2
= SQRT of 399.09822– 305.2009
= SQRT of = 93.89732
SQRT = 9.690062951
tabler-icon-diamond-filled.svg

Paraphrase This Document

Need a fresh take? Get an instant paraphrase of this document with our AI Paraphraser
Document Page
4. Forecasting of wind speed for 14 & 21 days.
1. Steps for calculating m value.
Formula for calculating the value of m is m = N Σxy – Σx Σy / N Σ x^2 – (Σx)^2. Steps are
as follows:
1. Determine the value of Σxy and multiply it with total number of data.
2. Add up value of x and y variables individually (Naik and Desai, 2015).
3. Subtract step 2 from step 1.
4. Calculate the square value of x variable and sum it up i.e. Σ x^2. Now, multiply it with total
number of observation to ascertain N Σ x^2.
5. Sum up all the values of x variable Σx and take out square value of it.
6. Subtract step 5 from step 4.
7. Divide step 3 by step 6 for determining the value of m.
2. Steps for calculating the value of c.
Formula is c = Σy - mΣx / N along with steps:
1. Sum up value of y variables i.e. Σy.
2. Multiply the m value with value obtained from adding all the x variable i.e. Σx and divide it
by total observation (Sarkar and Rashid, 2016).
3. Subtract step 2 from step 1 for evaluating c value.
3. Forecasting the wind speed for 14 and 21 days.
Number of
days (X)
Total wind
speed (Y) XY X^2
1 8.05 8.05 1
2 17.58 35.16 4
3 33.48 100.44 9
4 33.62 134.48 16
5 26.18 130.9 25
6 13.8 82.8 36
7 7.52 52.64 49
8 7.07 56.56 64
Document Page
9 11.68 105.12 81
10 15.72 157.2 100
55 174.7 863.35 385
Particulars Formula Y = mX + c
m NΣxy – Σx Σy / NΣ x^2 – (Σx)^2
M = 10 (863.35) - (55 * 174.7) / (10 *
385) – (55)^2
m = (8633.5 – 9608.5) / (3850 – 3025)
m = −975 / 825
m = −1.181818182
c Σy - mΣx / N
C = 174.7 – (−1.181818182 * 55) / 10
c = (174.7 + 65.00000) / 10
c =239.7 / 10
c =23.97
Forecasting
wind speed
for 14 days
Y = mX + c Here x = 14 days
Y = −1.181818182 (14) + 23.97
Y = −16.5454545 + 23.97
Y = 7.4245455
Forecasting
wind speed
for 21 days
Y = mX + c
Here x = 21 days
Y = −1.181818182 (21) + 23.97
Y = −24.8181818+ 23.97
Y = −0.8481818
Interpretation – It can be concluded that the wind speed of Liverpool city forecasted for the
next 14 as well as 21 days are 7.4245455 km/h and -0.8481818 km/h respectively (Mertler and
Reinhart, 2016).
Document Page
CONCLUSION
From the report it can be concluded that the wind speed of Liverpoot city, UK is showing
fluctuating trend with maximum speed of 33.62 km/h on 9 October 2019 and 7.07 km/h as
minimum speed of wind on 13 October 2019. Also, as per forecasting it has been assessed that the
speed of wind in next 14 and 21 days will be 7.4245455 km/h and -0.8481818 km/h respectively.
chevron_up_icon
1 out of 10
circle_padding
hide_on_mobile
zoom_out_icon
[object Object]