Finance for Managers: Lloyds Bank and Barclays Bank Analysis Report
VerifiedAdded on 2019/12/04
|18
|5389
|43
Report
AI Summary
This report provides a comparative financial analysis of Lloyds Bank Plc and Barclays Bank Plc, focusing on their performance and key financial ratios. It examines various aspects, including turnover, profits, shareholder funds, current ratios, return on capital employed, solvency ratios, gearing ratios, ROE, and PE ratios. The analysis highlights the impact of the 2008 financial crisis on both banks and evaluates their recovery strategies. The report also includes a comparison of their assets and discusses the implications of the Lloyds TBS split. The study uses tables to present data and provides insights into the strengths and weaknesses of both banks, offering a comprehensive overview for financial managers. The report also includes a discussion on the limitations of ratio analysis.

FINANCE FOR MANAGERS
Paraphrase This Document
Need a fresh take? Get an instant paraphrase of this document with our AI Paraphraser
TABLE OF CONTENTS
Introduction......................................................................................................................................1
Analysis and comparison of Lloyds bank and Barclays bank.....................................................1
Analysis and comparison of Lloyds bank ..................................................................................5
The different financial and non-financial areas considered by an investor.................................6
Challenges and risk faced by Lloyds bank .................................................................................8
Recommendations.......................................................................................................................9
Conclusion.....................................................................................................................................11
References......................................................................................................................................12

INDEX OF TABLES
Table 1: Comparison between Lloyds and Barclays........................................................................1
Table 2: Assets Comparison between Lloyds and Barclays............................................................4
Table 3: Comparison between Lloyds ratios...................................................................................4
⊘ This is a preview!⊘
Do you want full access?
Subscribe today to unlock all pages.
Trusted by 1+ million students worldwide
INTRODUCTION
Financial management helps a manager to define the goals of an organization. He
allocates resources and provides direction to the various functions of the business. A manager
studies the financial information and takes necessary decisions to ensure that the company is
prepared of any future uncertainty (Tugas, 2012). The report focuses on the comparison of
financial performance of Lloyds Bank Plc and Barclays Bank Plc. Moreover, the evaluation of
problem solving techniques and mechanism adopted by Lloyds Bank Plc has also been included
in the report. Lloyds Bank Plc is Brutish retail and commercial bank with its headquarters in
London, UK (Llyods banking group, 2016). It is among the big four clearing banks of the nation.
Barclays Bank Plc is a multinational bank which has its business operations in more than 50
countries.
Analysis and comparison of Lloyds bank and Barclays bank
Lloyds Bank Plc has been facing tough competition from the Barclays Bank Plc. Lloyds
has a simple business model and it is limited to UK (Krzysko and Marciniak, 2001). On the other
hand, Barclays is a diversified back and provides services like retail banking, commercial
banking, credit cards and investment banking around the world. Financial crisis had a huge
impact on the business of banks and financial institutions. There were lot of restrictions on them
and the policies were also stringent. It was very difficult to get credit in Europe. It is for the same
reason that the UK government bought stakes in Lloyds bank. Many banks failed after the
financial crisis and it affected the entire European economy. However, as the economy started to
recover the policies, regulations began to reduce. Lloyds bank had profits of more than £1,899
million after the crisis of 2008. It has shown strong performance with its current combined ratio
of 91.3%. The total assets of Lloyds stood at £2 billion at the end of year 2008. The performance
of Lloyds bank improved after the split up of Lloyd TBS. All the banks in Euro zone have been
facing difficulties because the recovery rate of economy has been slow.
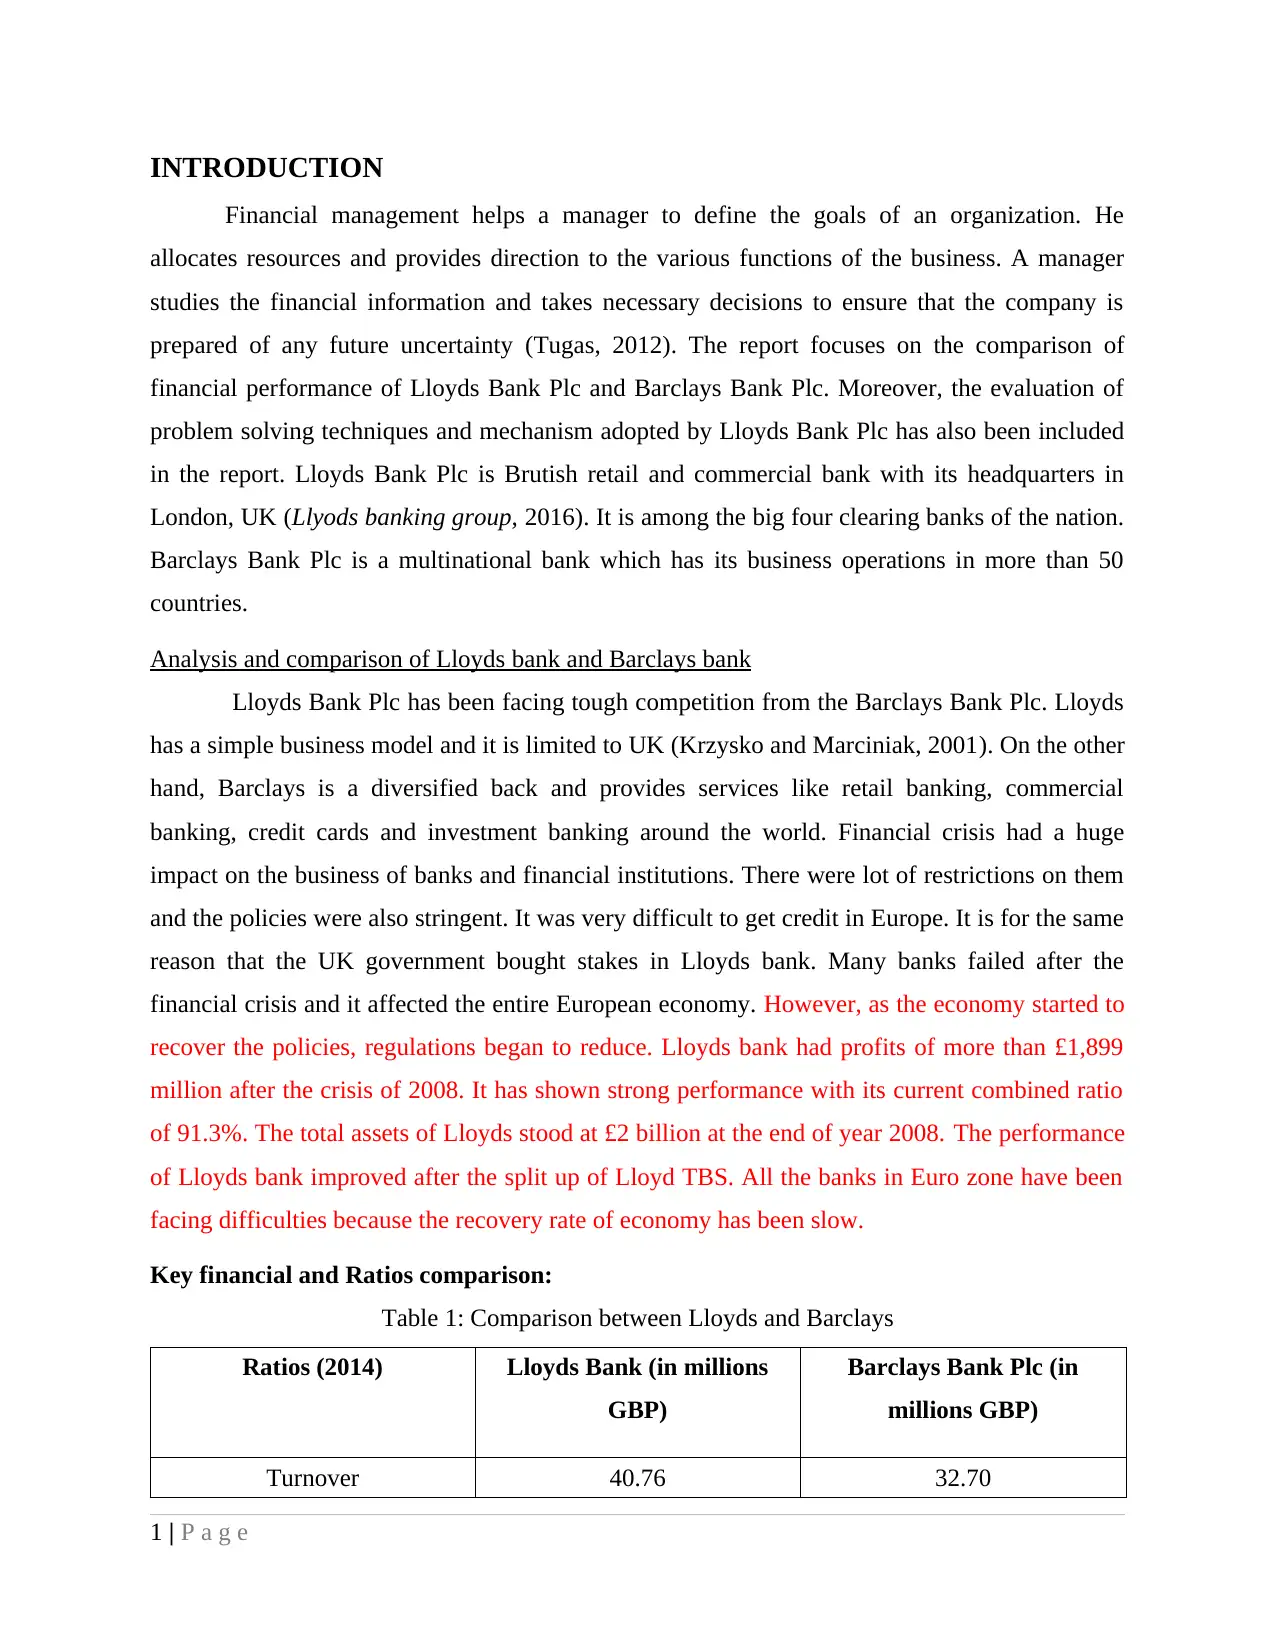
Key financial and Ratios comparison:
Table 1: Comparison between Lloyds and Barclays
Ratios (2014) Lloyds Bank (in millions
GBP)
Barclays Bank Plc (in
millions GBP)
Turnover 40.76 32.70
1 | P a g e
Financial management helps a manager to define the goals of an organization. He
allocates resources and provides direction to the various functions of the business. A manager
studies the financial information and takes necessary decisions to ensure that the company is
prepared of any future uncertainty (Tugas, 2012). The report focuses on the comparison of
financial performance of Lloyds Bank Plc and Barclays Bank Plc. Moreover, the evaluation of
problem solving techniques and mechanism adopted by Lloyds Bank Plc has also been included
in the report. Lloyds Bank Plc is Brutish retail and commercial bank with its headquarters in
London, UK (Llyods banking group, 2016). It is among the big four clearing banks of the nation.
Barclays Bank Plc is a multinational bank which has its business operations in more than 50
countries.
Analysis and comparison of Lloyds bank and Barclays bank
Lloyds Bank Plc has been facing tough competition from the Barclays Bank Plc. Lloyds
has a simple business model and it is limited to UK (Krzysko and Marciniak, 2001). On the other
hand, Barclays is a diversified back and provides services like retail banking, commercial
banking, credit cards and investment banking around the world. Financial crisis had a huge
impact on the business of banks and financial institutions. There were lot of restrictions on them
and the policies were also stringent. It was very difficult to get credit in Europe. It is for the same
reason that the UK government bought stakes in Lloyds bank. Many banks failed after the
financial crisis and it affected the entire European economy. However, as the economy started to
recover the policies, regulations began to reduce. Lloyds bank had profits of more than £1,899
million after the crisis of 2008. It has shown strong performance with its current combined ratio
of 91.3%. The total assets of Lloyds stood at £2 billion at the end of year 2008. The performance
of Lloyds bank improved after the split up of Lloyd TBS. All the banks in Euro zone have been
facing difficulties because the recovery rate of economy has been slow.
Key financial and Ratios comparison:
Table 1: Comparison between Lloyds and Barclays
Ratios (2014) Lloyds Bank (in millions
GBP)
Barclays Bank Plc (in
millions GBP)
Turnover 40.76 32.70
1 | P a g e
Paraphrase This Document
Need a fresh take? Get an instant paraphrase of this document with our AI Paraphraser
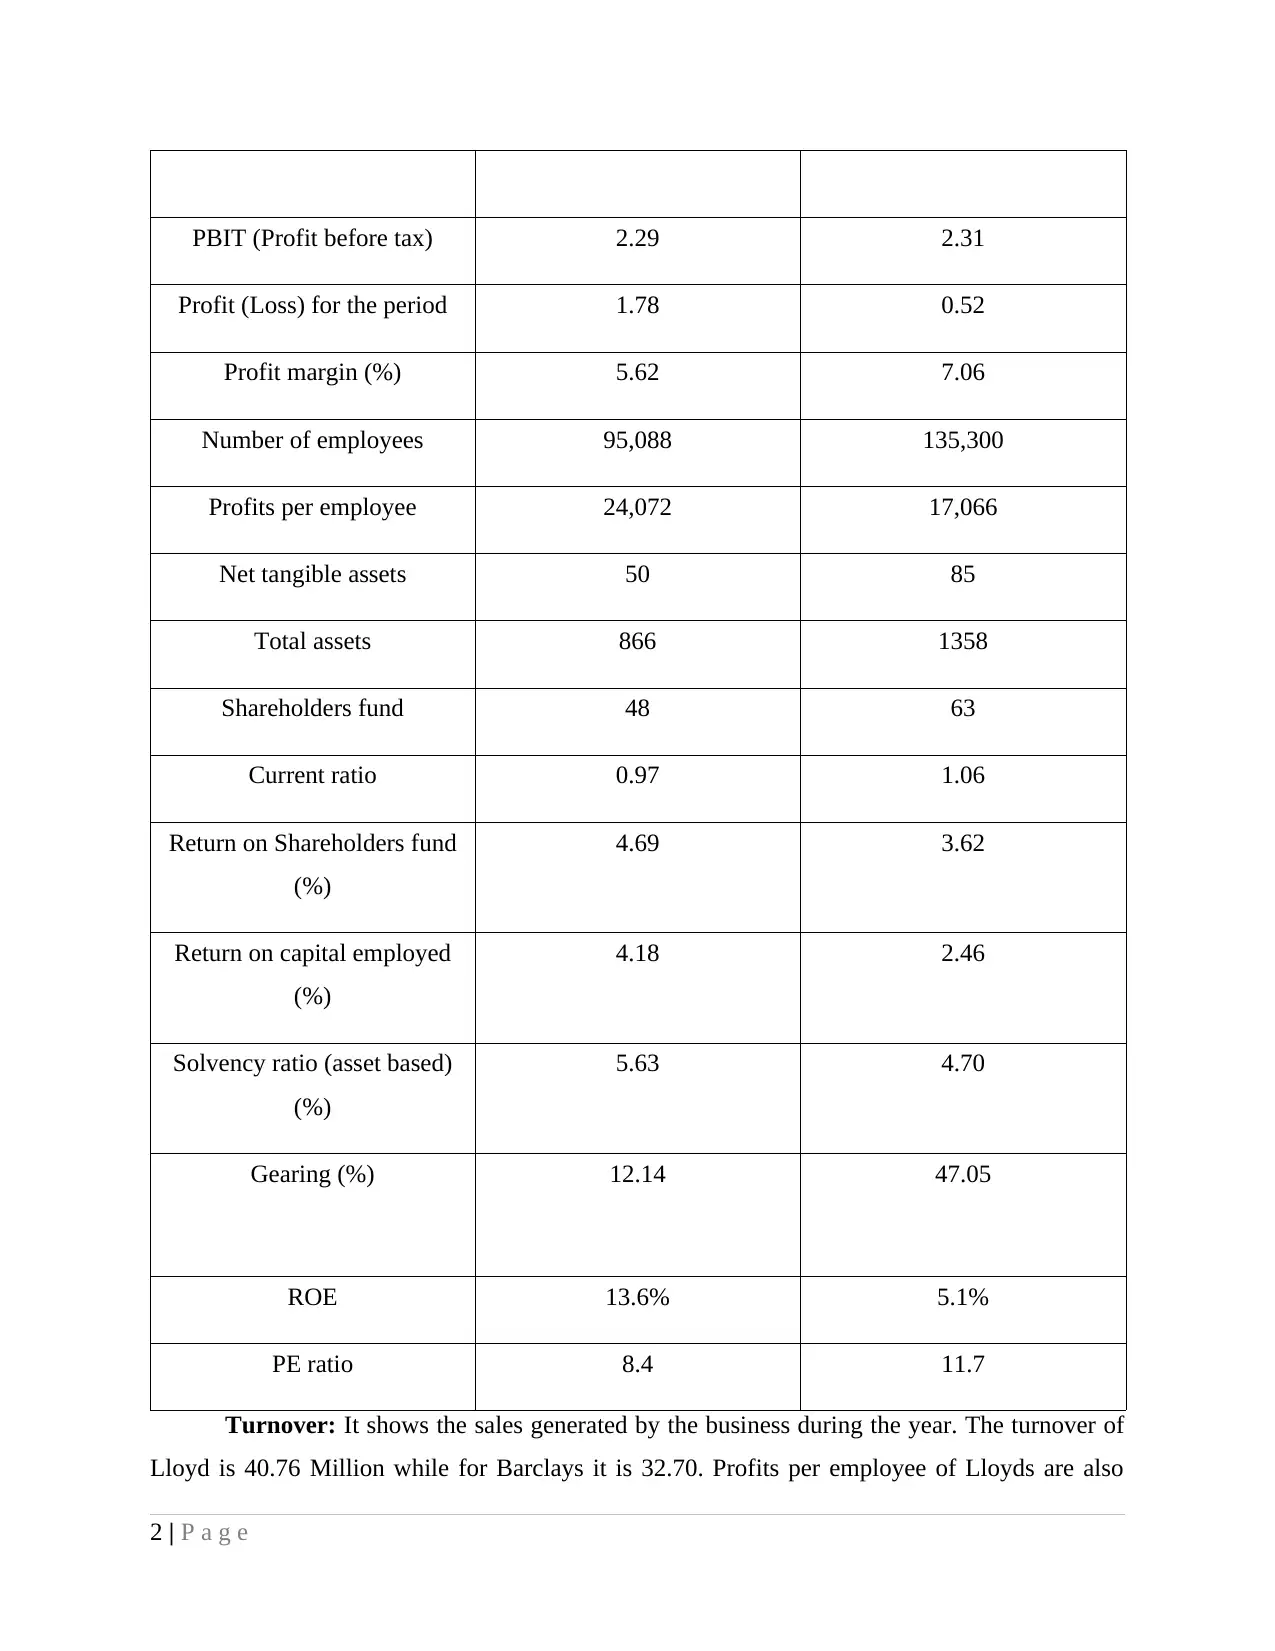
PBIT (Profit before tax) 2.29 2.31
Profit (Loss) for the period 1.78 0.52
Profit margin (%) 5.62 7.06
Number of employees 95,088 135,300
Profits per employee 24,072 17,066
Net tangible assets 50 85
Total assets 866 1358
Shareholders fund 48 63
Current ratio 0.97 1.06
Return on Shareholders fund
(%)
4.69 3.62
Return on capital employed
(%)
4.18 2.46
Solvency ratio (asset based)
(%)
5.63 4.70
Gearing (%) 12.14 47.05
ROE 13.6% 5.1%
PE ratio 8.4 11.7
Turnover: It shows the sales generated by the business during the year. The turnover of
Lloyd is 40.76 Million while for Barclays it is 32.70. Profits per employee of Lloyds are also
2 | P a g e
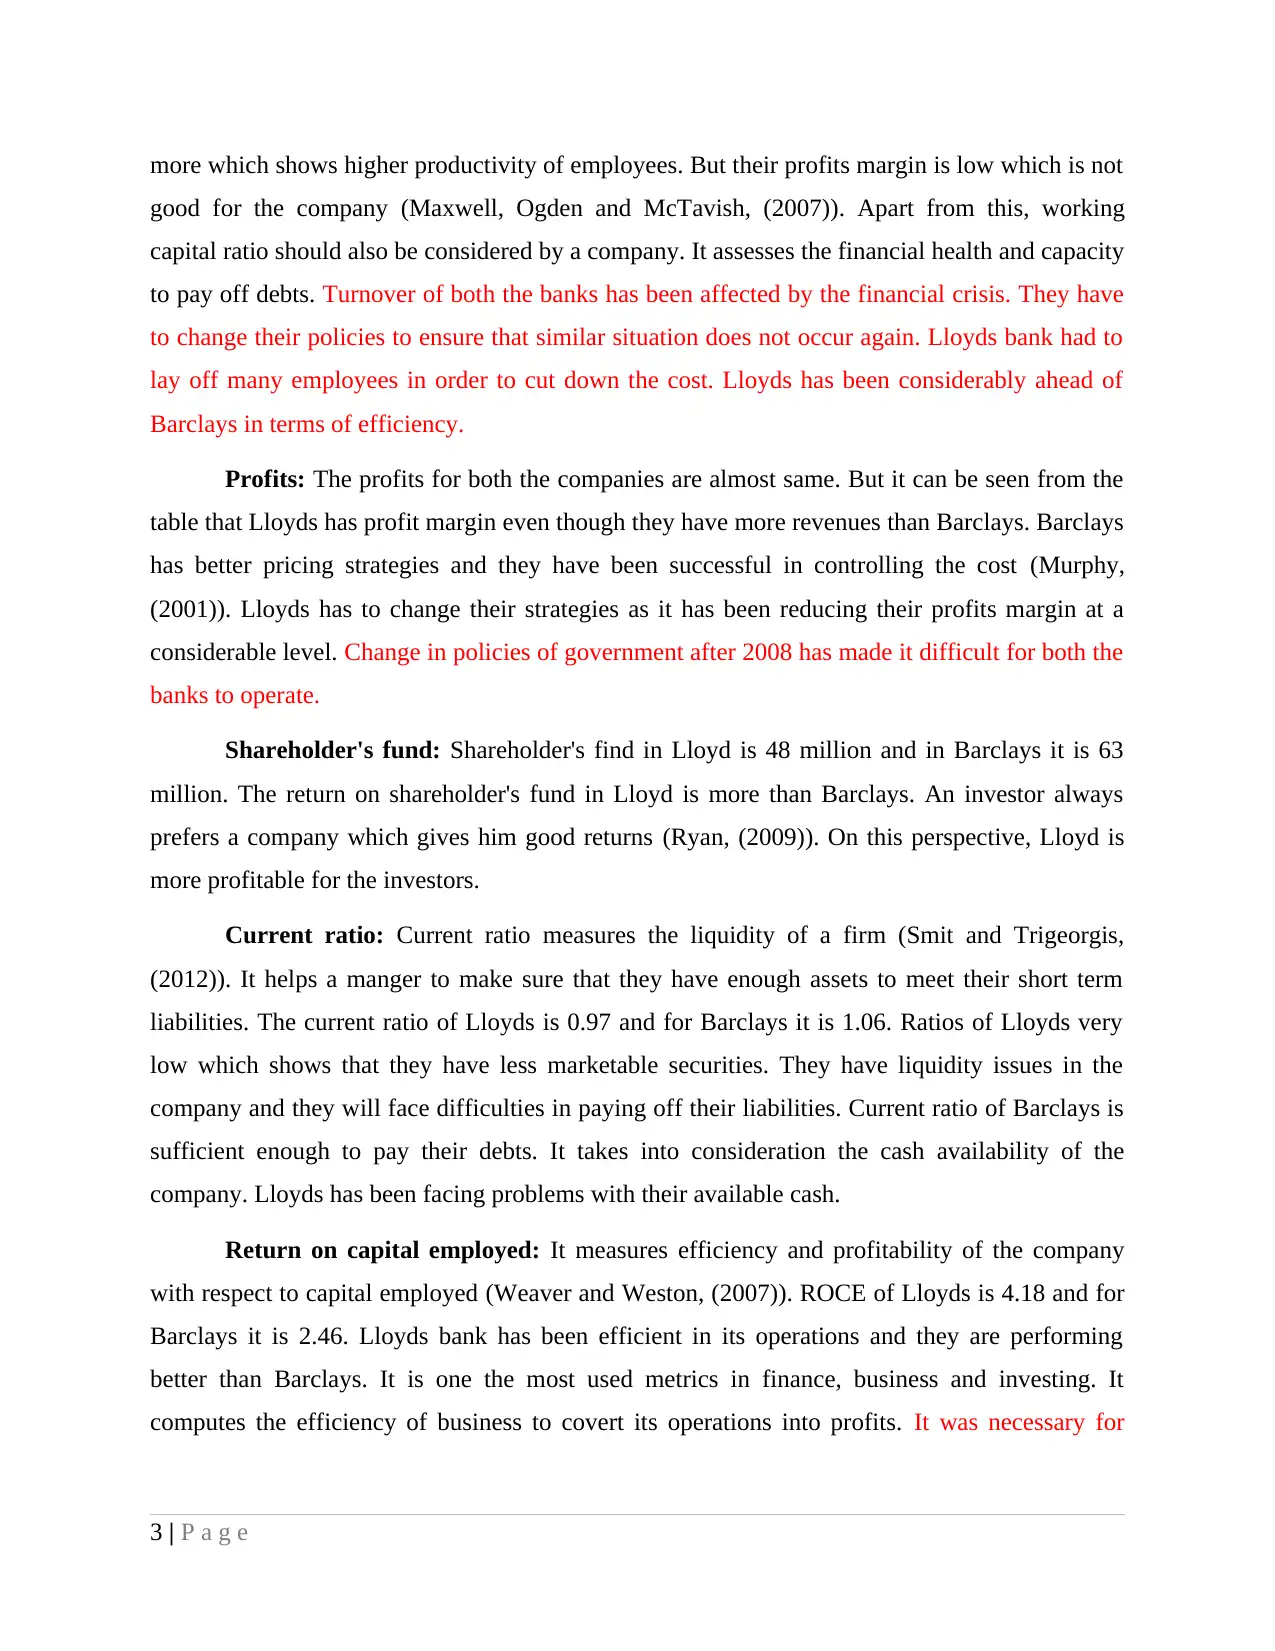
more which shows higher productivity of employees. But their profits margin is low which is not
good for the company (Maxwell, Ogden and McTavish, (2007)). Apart from this, working
capital ratio should also be considered by a company. It assesses the financial health and capacity
to pay off debts. Turnover of both the banks has been affected by the financial crisis. They have
to change their policies to ensure that similar situation does not occur again. Lloyds bank had to
lay off many employees in order to cut down the cost. Lloyds has been considerably ahead of
Barclays in terms of efficiency.
Profits: The profits for both the companies are almost same. But it can be seen from the
table that Lloyds has profit margin even though they have more revenues than Barclays. Barclays
has better pricing strategies and they have been successful in controlling the cost (Murphy,
(2001)). Lloyds has to change their strategies as it has been reducing their profits margin at a
considerable level. Change in policies of government after 2008 has made it difficult for both the
banks to operate.
Shareholder's fund: Shareholder's find in Lloyd is 48 million and in Barclays it is 63
million. The return on shareholder's fund in Lloyd is more than Barclays. An investor always
prefers a company which gives him good returns (Ryan, (2009)). On this perspective, Lloyd is
more profitable for the investors.
Current ratio: Current ratio measures the liquidity of a firm (Smit and Trigeorgis,
(2012)). It helps a manger to make sure that they have enough assets to meet their short term
liabilities. The current ratio of Lloyds is 0.97 and for Barclays it is 1.06. Ratios of Lloyds very
low which shows that they have less marketable securities. They have liquidity issues in the
company and they will face difficulties in paying off their liabilities. Current ratio of Barclays is
sufficient enough to pay their debts. It takes into consideration the cash availability of the
company. Lloyds has been facing problems with their available cash.
Return on capital employed: It measures efficiency and profitability of the company
with respect to capital employed (Weaver and Weston, (2007)). ROCE of Lloyds is 4.18 and for
Barclays it is 2.46. Lloyds bank has been efficient in its operations and they are performing
better than Barclays. It is one the most used metrics in finance, business and investing. It
computes the efficiency of business to covert its operations into profits. It was necessary for
3 | P a g e
⊘ This is a preview!⊘
Do you want full access?
Subscribe today to unlock all pages.
Trusted by 1+ million students worldwide
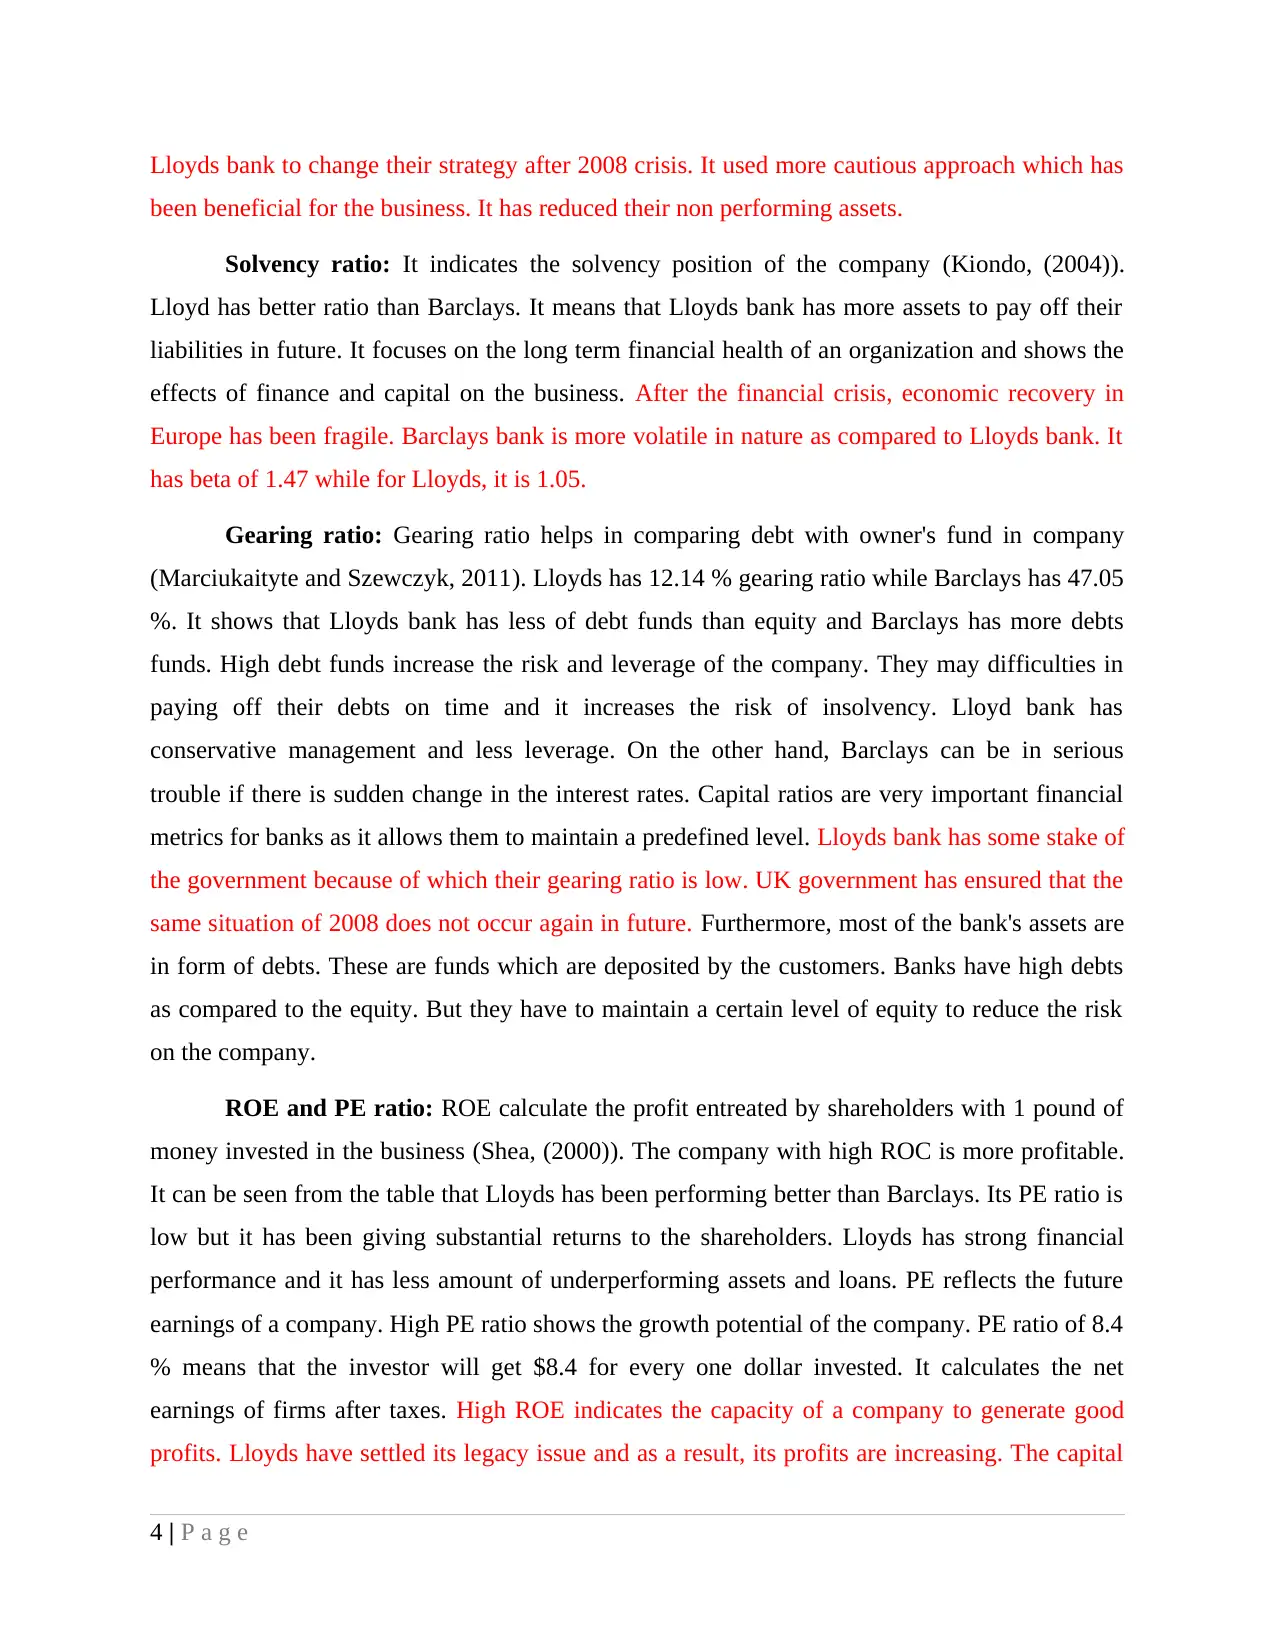
Lloyds bank to change their strategy after 2008 crisis. It used more cautious approach which has
been beneficial for the business. It has reduced their non performing assets.
Solvency ratio: It indicates the solvency position of the company (Kiondo, (2004)).
Lloyd has better ratio than Barclays. It means that Lloyds bank has more assets to pay off their
liabilities in future. It focuses on the long term financial health of an organization and shows the
effects of finance and capital on the business. After the financial crisis, economic recovery in
Europe has been fragile. Barclays bank is more volatile in nature as compared to Lloyds bank. It
has beta of 1.47 while for Lloyds, it is 1.05.
Gearing ratio: Gearing ratio helps in comparing debt with owner's fund in company
(Marciukaityte and Szewczyk, 2011). Lloyds has 12.14 % gearing ratio while Barclays has 47.05
%. It shows that Lloyds bank has less of debt funds than equity and Barclays has more debts
funds. High debt funds increase the risk and leverage of the company. They may difficulties in
paying off their debts on time and it increases the risk of insolvency. Lloyd bank has
conservative management and less leverage. On the other hand, Barclays can be in serious
trouble if there is sudden change in the interest rates. Capital ratios are very important financial
metrics for banks as it allows them to maintain a predefined level. Lloyds bank has some stake of
the government because of which their gearing ratio is low. UK government has ensured that the
same situation of 2008 does not occur again in future. Furthermore, most of the bank's assets are
in form of debts. These are funds which are deposited by the customers. Banks have high debts
as compared to the equity. But they have to maintain a certain level of equity to reduce the risk
on the company.
ROE and PE ratio: ROE calculate the profit entreated by shareholders with 1 pound of
money invested in the business (Shea, (2000)). The company with high ROC is more profitable.
It can be seen from the table that Lloyds has been performing better than Barclays. Its PE ratio is
low but it has been giving substantial returns to the shareholders. Lloyds has strong financial
performance and it has less amount of underperforming assets and loans. PE reflects the future
earnings of a company. High PE ratio shows the growth potential of the company. PE ratio of 8.4
% means that the investor will get $8.4 for every one dollar invested. It calculates the net
earnings of firms after taxes. High ROE indicates the capacity of a company to generate good
profits. Lloyds have settled its legacy issue and as a result, its profits are increasing. The capital
4 | P a g e
Paraphrase This Document
Need a fresh take? Get an instant paraphrase of this document with our AI Paraphraser
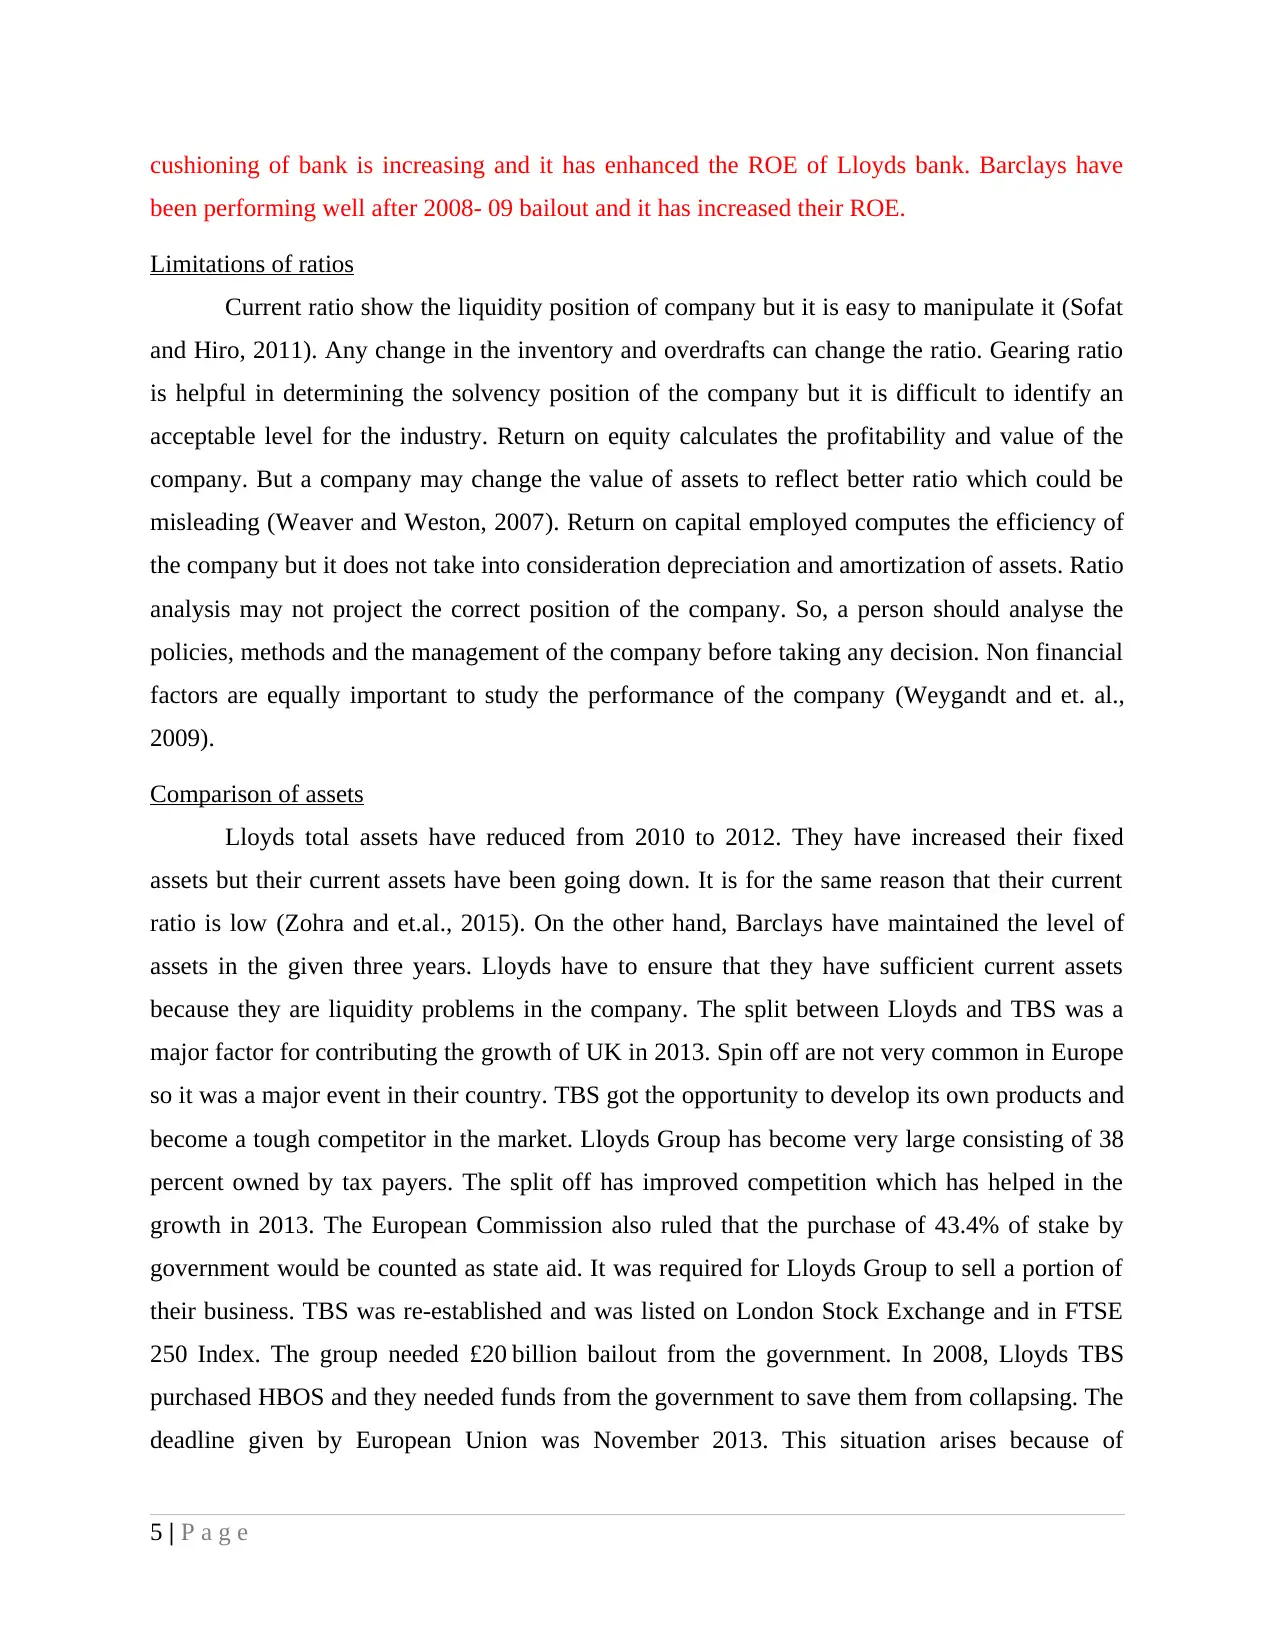
cushioning of bank is increasing and it has enhanced the ROE of Lloyds bank. Barclays have
been performing well after 2008- 09 bailout and it has increased their ROE.
Limitations of ratios
Current ratio show the liquidity position of company but it is easy to manipulate it (Sofat
and Hiro, 2011). Any change in the inventory and overdrafts can change the ratio. Gearing ratio
is helpful in determining the solvency position of the company but it is difficult to identify an
acceptable level for the industry. Return on equity calculates the profitability and value of the
company. But a company may change the value of assets to reflect better ratio which could be
misleading (Weaver and Weston, 2007). Return on capital employed computes the efficiency of
the company but it does not take into consideration depreciation and amortization of assets. Ratio
analysis may not project the correct position of the company. So, a person should analyse the
policies, methods and the management of the company before taking any decision. Non financial
factors are equally important to study the performance of the company (Weygandt and et. al.,
2009).
Comparison of assets
Lloyds total assets have reduced from 2010 to 2012. They have increased their fixed
assets but their current assets have been going down. It is for the same reason that their current
ratio is low (Zohra and et.al., 2015). On the other hand, Barclays have maintained the level of
assets in the given three years. Lloyds have to ensure that they have sufficient current assets
because they are liquidity problems in the company. The split between Lloyds and TBS was a
major factor for contributing the growth of UK in 2013. Spin off are not very common in Europe
so it was a major event in their country. TBS got the opportunity to develop its own products and
become a tough competitor in the market. Lloyds Group has become very large consisting of 38
percent owned by tax payers. The split off has improved competition which has helped in the
growth in 2013. The European Commission also ruled that the purchase of 43.4% of stake by
government would be counted as state aid. It was required for Lloyds Group to sell a portion of
their business. TBS was re-established and was listed on London Stock Exchange and in FTSE
250 Index. The group needed £20 billion bailout from the government. In 2008, Lloyds TBS
purchased HBOS and they needed funds from the government to save them from collapsing. The
deadline given by European Union was November 2013. This situation arises because of
5 | P a g e
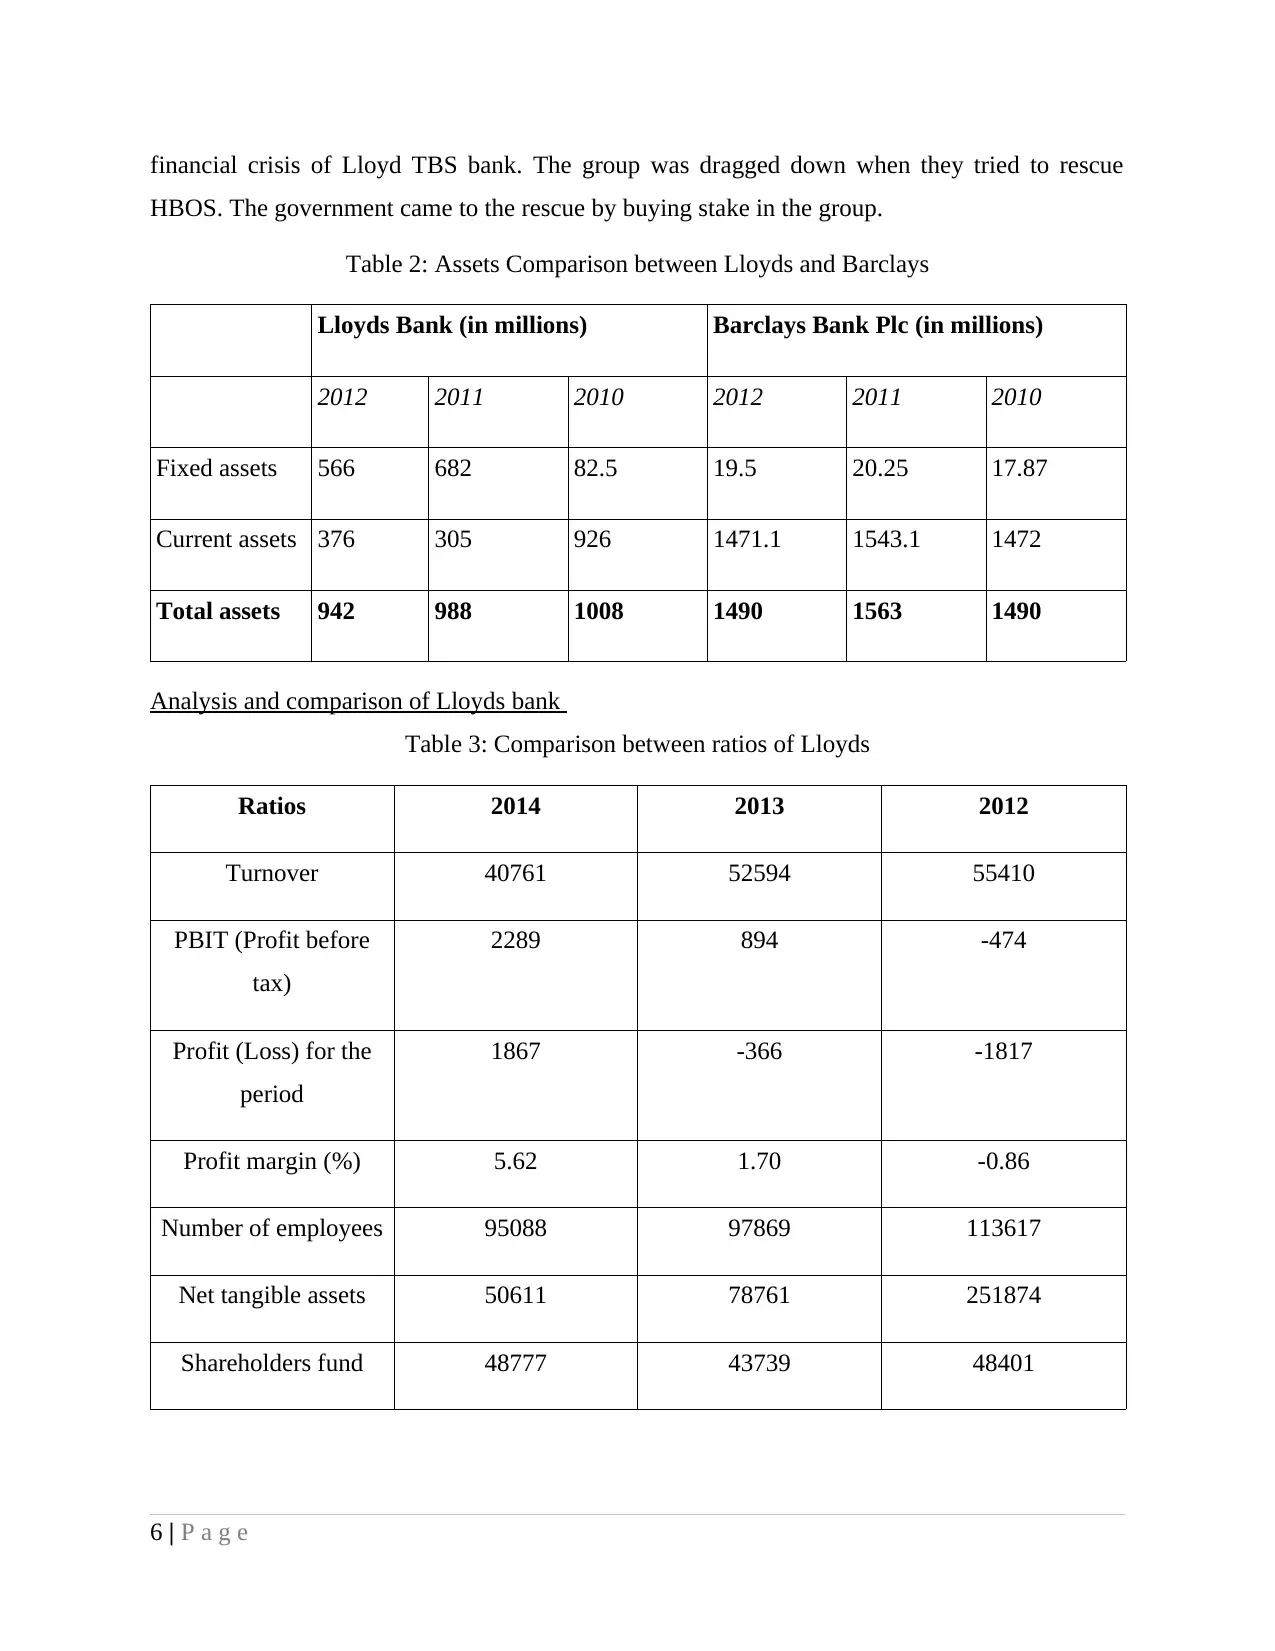
financial crisis of Lloyd TBS bank. The group was dragged down when they tried to rescue
HBOS. The government came to the rescue by buying stake in the group.
Table 2: Assets Comparison between Lloyds and Barclays
Lloyds Bank (in millions) Barclays Bank Plc (in millions)
2012 2011 2010 2012 2011 2010
Fixed assets 566 682 82.5 19.5 20.25 17.87
Current assets 376 305 926 1471.1 1543.1 1472
Total assets 942 988 1008 1490 1563 1490
Analysis and comparison of Lloyds bank
Table 3: Comparison between ratios of Lloyds
Ratios 2014 2013 2012
Turnover 40761 52594 55410
PBIT (Profit before
tax)
2289 894 -474
Profit (Loss) for the
period
1867 -366 -1817
Profit margin (%) 5.62 1.70 -0.86
Number of employees 95088 97869 113617
Net tangible assets 50611 78761 251874
Shareholders fund 48777 43739 48401
6 | P a g e
⊘ This is a preview!⊘
Do you want full access?
Subscribe today to unlock all pages.
Trusted by 1+ million students worldwide
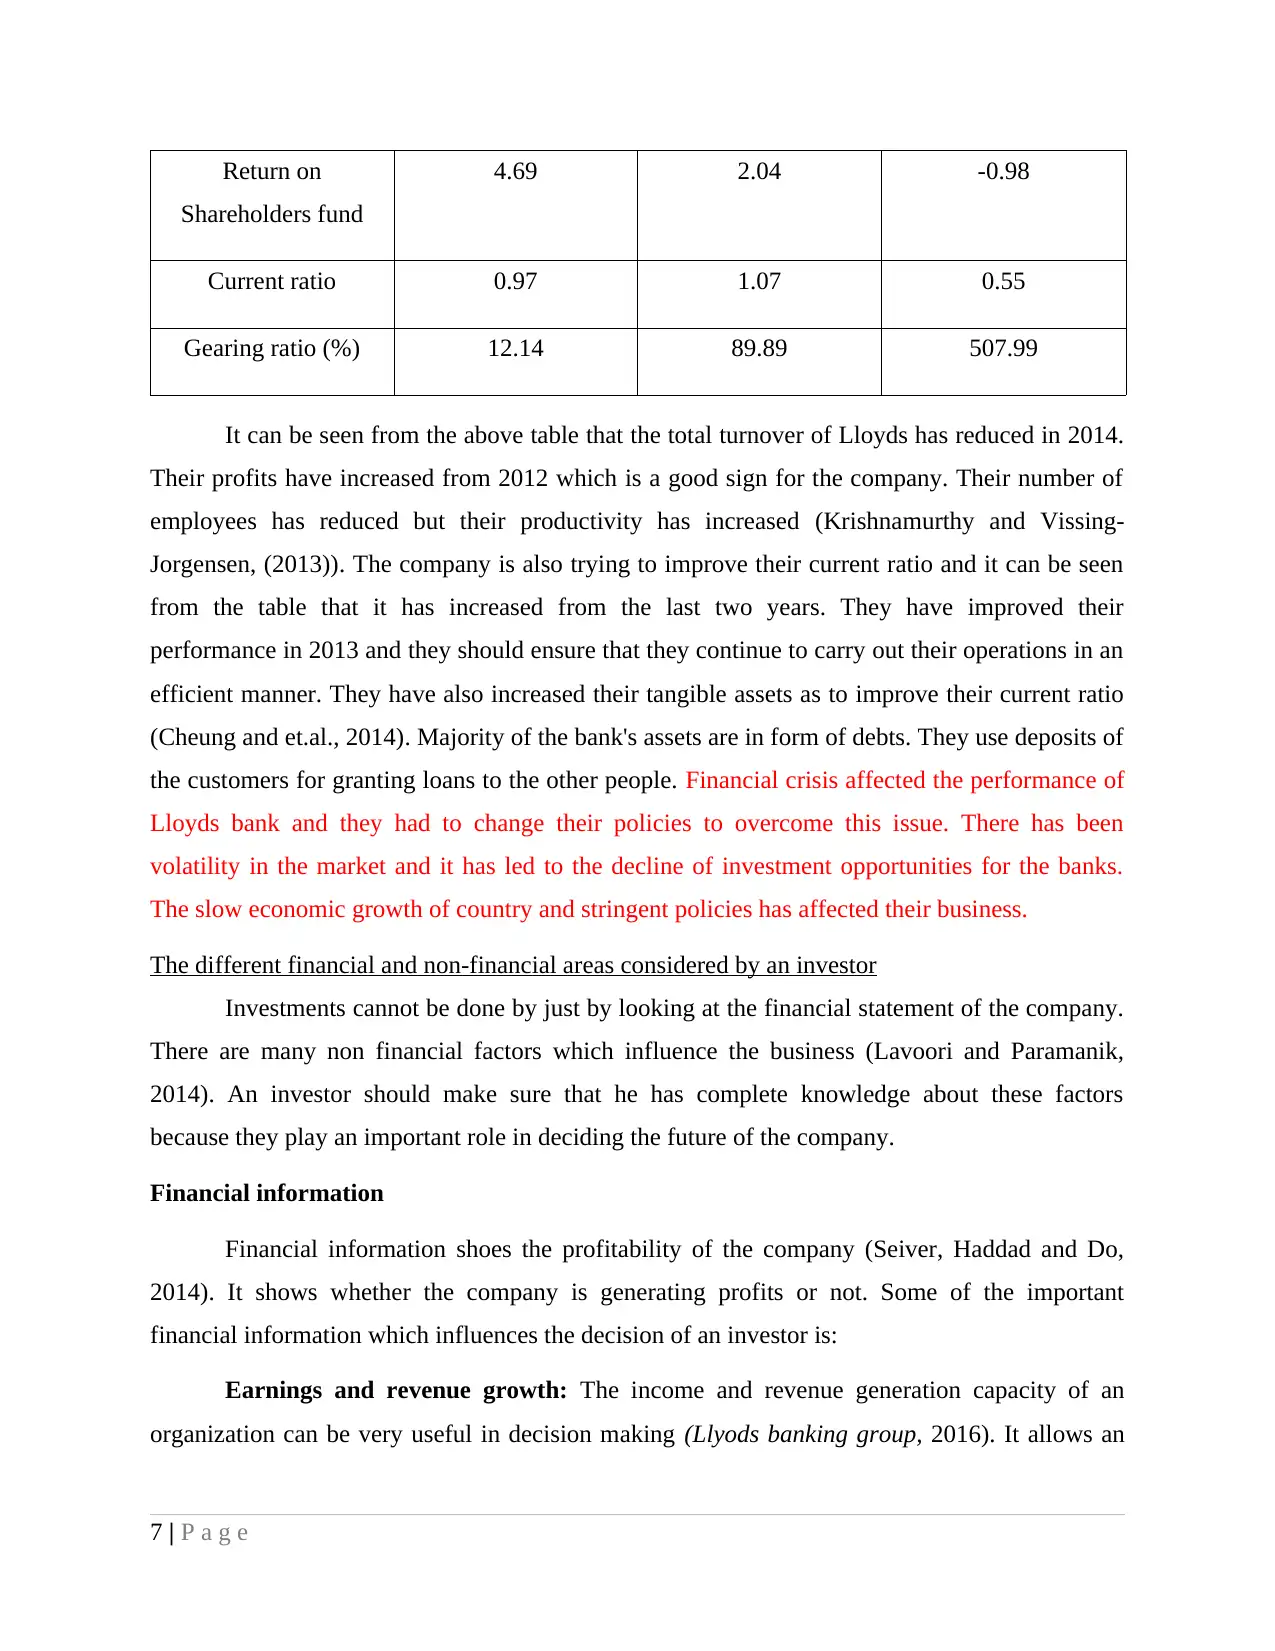
Return on
Shareholders fund
4.69 2.04 -0.98
Current ratio 0.97 1.07 0.55
Gearing ratio (%) 12.14 89.89 507.99
It can be seen from the above table that the total turnover of Lloyds has reduced in 2014.
Their profits have increased from 2012 which is a good sign for the company. Their number of
employees has reduced but their productivity has increased (Krishnamurthy and Vissing-
Jorgensen, (2013)). The company is also trying to improve their current ratio and it can be seen
from the table that it has increased from the last two years. They have improved their
performance in 2013 and they should ensure that they continue to carry out their operations in an
efficient manner. They have also increased their tangible assets as to improve their current ratio
(Cheung and et.al., 2014). Majority of the bank's assets are in form of debts. They use deposits of
the customers for granting loans to the other people. Financial crisis affected the performance of
Lloyds bank and they had to change their policies to overcome this issue. There has been
volatility in the market and it has led to the decline of investment opportunities for the banks.
The slow economic growth of country and stringent policies has affected their business.
The different financial and non-financial areas considered by an investor
Investments cannot be done by just by looking at the financial statement of the company.
There are many non financial factors which influence the business (Lavoori and Paramanik,
2014). An investor should make sure that he has complete knowledge about these factors
because they play an important role in deciding the future of the company.
Financial information
Financial information shoes the profitability of the company (Seiver, Haddad and Do,
2014). It shows whether the company is generating profits or not. Some of the important
financial information which influences the decision of an investor is:
Earnings and revenue growth: The income and revenue generation capacity of an
organization can be very useful in decision making (Llyods banking group, 2016). It allows an
7 | P a g e
Paraphrase This Document
Need a fresh take? Get an instant paraphrase of this document with our AI Paraphraser
investor to understand the trends of the profits. A company which is stable in its earning is not
good for the investment. So, it has to be seen by the investor.
Cash flow trends: It allows an investor to see the activities of the company. It also
projects the liquidity position of the company (Sofat and Hiro, 2011). An investor would not get
his dividends on time if the company is having cash crunch situation.
Debts and leverage: Too much leverage increases the risk of company (Marciukaityte
and Szewczyk, 2011). But it is difficult to find out the industry average which can be used as a
comparison. There should be a balance between debts and equity. High debts means that more of
the income goes into the interest payment and it reduces the dividends of the investor.
Price earnings (PE) ratio: It is the relationship between EPS, stock price and growth of
the company. High PE ratio shows good growth rate (Maxwell, Ogden and McTavish, 2007). It
can be compared with other companies to find out the best profitable investment.
Price to book value: It is used to compare the book value with the market price of the
company. It is the total amount that would remain if the company liquidates. Low Price to book
value indicates that the company's stock is undervalued (Smit and Trigeorgis, (2012)). But the
investor should understand the policies of the company otherwise he won't be able to gain the
benefits.
Return on equity: Investment is done for the sole purpose of getting returns from the
business (Weaver and Weston, 2007). Return on equity shows the overall earnings of the
business. It can be useful information for the investors. But a rise in debts also increases the
return on equity. So it should be considered while evaluating information from this technique.
Dividend yield: High dividend indicates that the company is doing well. It is a good
indication to invest the money in the business for the long run (Zohra and et.al., 2015). But the
investor should understand the dividend policy of the company before investing. Some
companies invest their money again in the business. So it should be evaluated carefully.
Non Financial information
Non financial information is equally important for an investor (Investor Interest in Non
financial Information, 2016). It gives an idea about the internal influences of the company. It is
8 | P a g e
also helpful in deciding the future of the company. Some of the important factors which have to
be considered by an investor are:
Business model: It involves the strategy and plans of the company to increase their
revenues. Lloyd bank has been facing this issue because their profit margin is low. Some
companies focus on quality while others on price of the products (Krishnamurthy and Vissing-
Jorgensen, 2013). So it is essential for an investor to study the business model of company before
investing. Lloyds has been a stable company which would be beneficial to invest in it. It has
provided financial security to policy holders and it has been efficient in its capital use. They have
to change their policies according to the requirement of government. They have to increase their
market share and position which they had before 2008. The business model of Lloyds has been
changed to ensure growth in the future.
Competitive advantage: An investor should evaluate the competitive advantage of the
company before investing their money (Shea, 2000). It can be in quality, market, technology,
distribution, patents, products or operational efficiency. A company which has high quality
product or super low product prices always find themselves ahead of the competition. It benefits
them in the long run as well. It would be beneficial for a person to invest in a company which
has better position in the market (Krzysko and Marciniak, 2001).
Management: The quality of management handling the operations should also be seen
by an investor (Seiver, Haddad and Do, (2014)). Lack of communication and decision making
can affect the working of the company so it has to be considered. Lloyds have outperformed as
compared to its peers in its capital efficiency. The management includes outstanding specialists
and talented people. Company has been paying dividend after 2009 and they are expected to
grow their business in the UK market.
History of corporate governance: An investor would always say no to the company
which does not maintain adequate governance (Weaver and Weston, 2007). This increases the
risk factor which can be harmful in the future. Lloyds has been following the rules and
regulations of the government. They have even changed their strategies to support them. It is for
the same reason that they have been performing well in the market.
Environmental performance: A company which has bad history of environmental
performance always face difficulties in attracting investors (Weygandt and et. al., 2009). It
9 | P a g e
⊘ This is a preview!⊘
Do you want full access?
Subscribe today to unlock all pages.
Trusted by 1+ million students worldwide
1 out of 18
Related Documents


Your All-in-One AI-Powered Toolkit for Academic Success.
+13062052269
info@desklib.com
Available 24*7 on WhatsApp / Email
![[object Object]](/_next/static/media/star-bottom.7253800d.svg)
Unlock your academic potential
Copyright © 2020–2026 A2Z Services. All Rights Reserved. Developed and managed by ZUCOL.