Factors Influencing Learning Management System Success: BSC203 Report

Verified

Added on  2022/11/01

|1
|881
|338
Report
AI Summary
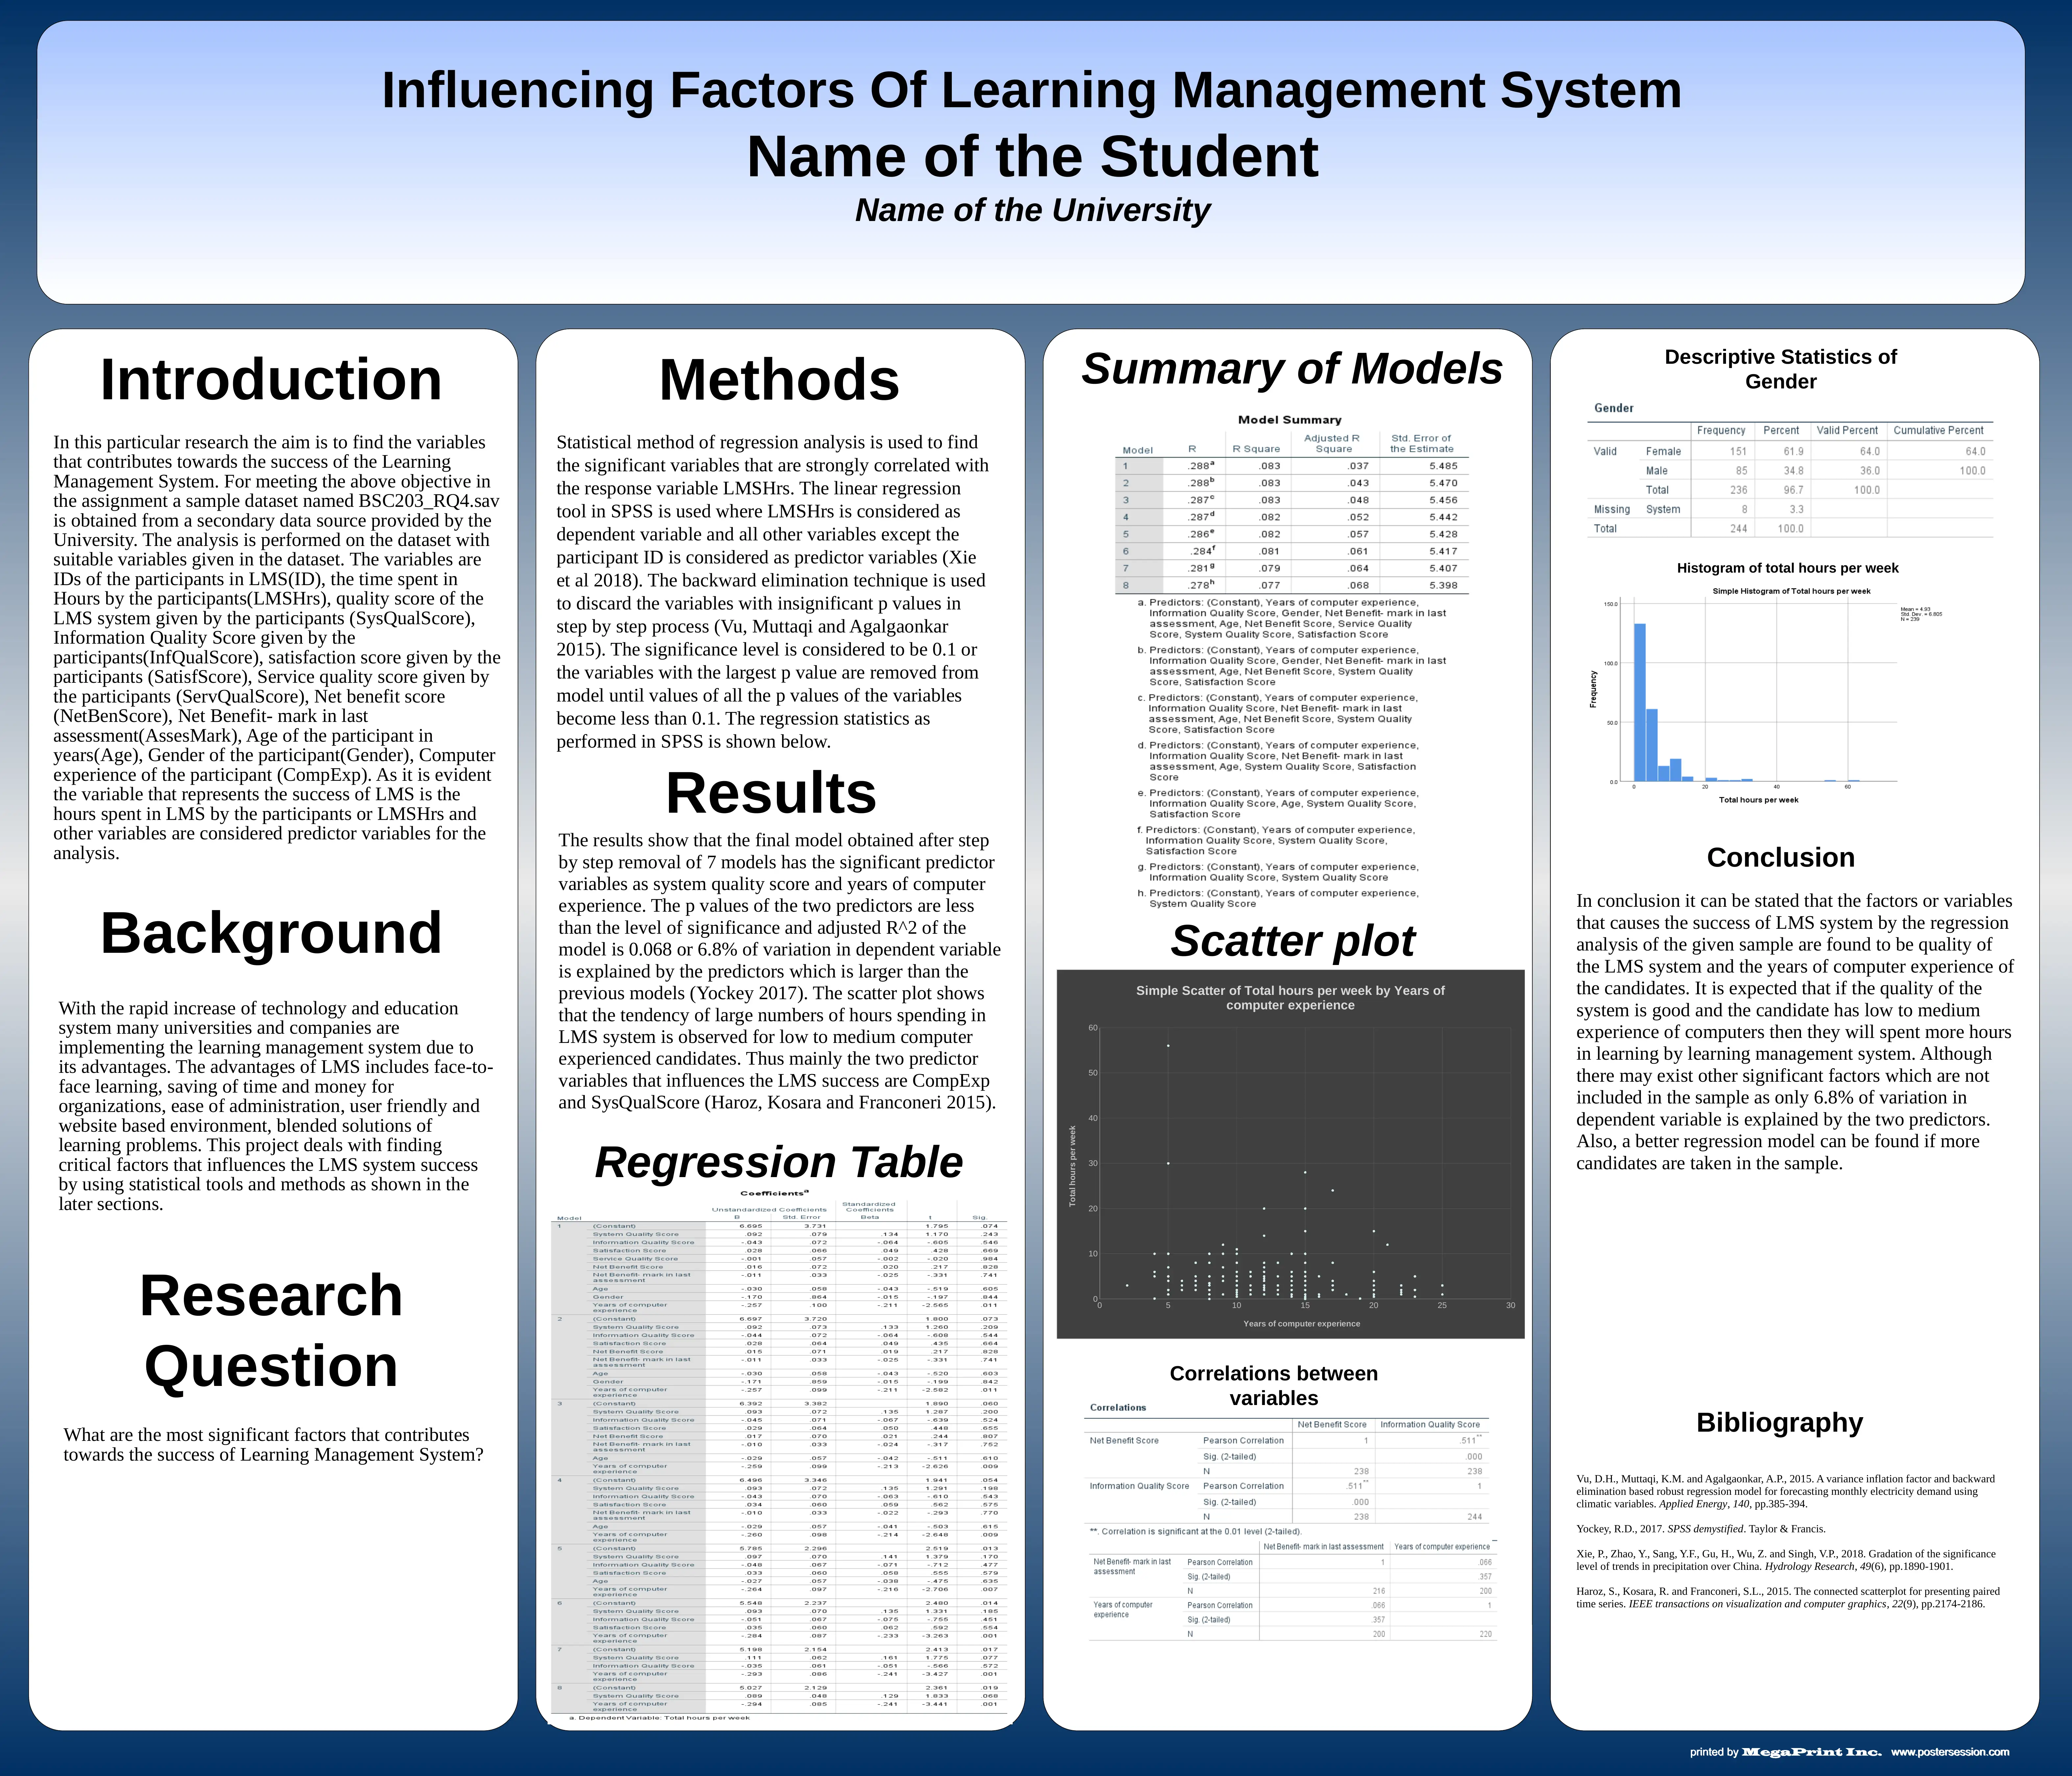
This report investigates the factors influencing the success of a Learning Management System (LMS) using a dataset provided by the university. The study employs regression analysis in SPSS to identify significant variables correlated with the time students spend on the LMS (LMSHrs). Variables examined include system quality score, information quality score, satisfaction score, service quality score, net benefit score, assessment marks, age, gender, and computer experience. The analysis uses backward elimination to determine the most influential factors. The results reveal that system quality score and computer experience are significant predictors of LMS success, with a low to medium level of computer experience correlating with more time spent on the LMS. The report concludes that improving system quality and understanding user computer experience can enhance LMS usage. The analysis explains only a small percentage of the variation in the dependent variable, suggesting further research with a larger sample size and inclusion of additional factors could provide a more comprehensive understanding of LMS success.
Document Page
In this particular research the aim is to find the variables
that contributes towards the success of the Learning
Management System. For meeting the above objective in
the assignment a sample dataset named BSC203_RQ4.sav
is obtained from a secondary data source provided by the
University. The analysis is performed on the dataset with
suitable variables given in the dataset. The variables are
IDs of the participants in LMS(ID), the time spent in
Hours by the participants(LMSHrs), quality score of the
LMS system given by the participants (SysQualScore),
Information Quality Score given by the
participants(InfQualScore), satisfaction score given by the
participants (SatisfScore), Service quality score given by
the participants (ServQualScore), Net benefit score
(NetBenScore), Net Benefit- mark in last
assessment(AssesMark), Age of the participant in
years(Age), Gender of the participant(Gender), Computer
experience of the participant (CompExp). As it is evident
the variable that represents the success of LMS is the
hours spent in LMS by the participants or LMSHrs and
other variables are considered predictor variables for the
analysis.
Methods
Conclusion
Influencing Factors Of Learning Management System
Name of the Student
Name of the University
Regression Table
Scatter plot
Bibliography
Statistical method of regression analysis is used to find
the significant variables that are strongly correlated with
the response variable LMSHrs. The linear regression
tool in SPSS is used where LMSHrs is considered as
dependent variable and all other variables except the
participant ID is considered as predictor variables (Xie
et al 2018). The backward elimination technique is used
to discard the variables with insignificant p values in
step by step process (Vu, Muttaqi and Agalgaonkar
2015). The significance level is considered to be 0.1 or
the variables with the largest p value are removed from
model until values of all the p values of the variables
become less than 0.1. The regression statistics as
performed in SPSS is shown below.
Vu, D.H., Muttaqi, K.M. and Agalgaonkar, A.P., 2015. A variance inflation factor and backward
elimination based robust regression model for forecasting monthly electricity demand using
climatic variables. Applied Energy, 140, pp.385-394.
Yockey, R.D., 2017. SPSS demystified. Taylor & Francis.
Xie, P., Zhao, Y., Sang, Y.F., Gu, H., Wu, Z. and Singh, V.P., 2018. Gradation of the significance
level of trends in precipitation over China. Hydrology Research, 49(6), pp.1890-1901.
Haroz, S., Kosara, R. and Franconeri, S.L., 2015. The connected scatterplot for presenting paired
time series. IEEE transactions on visualization and computer graphics, 22(9), pp.2174-2186.
The results show that the final model obtained after step
by step removal of 7 models has the significant predictor
variables as system quality score and years of computer
experience. The p values of the two predictors are less
than the level of significance and adjusted R^2 of the
model is 0.068 or 6.8% of variation in dependent variable
is explained by the predictors which is larger than the
previous models (Yockey 2017). The scatter plot shows
that the tendency of large numbers of hours spending in
LMS system is observed for low to medium computer
experienced candidates. Thus mainly the two predictor
variables that influences the LMS success are CompExp
and SysQualScore (Haroz, Kosara and Franconeri 2015).
In conclusion it can be stated that the factors or variables
that causes the success of LMS system by the regression
analysis of the given sample are found to be quality of
the LMS system and the years of computer experience of
the candidates. It is expected that if the quality of the
system is good and the candidate has low to medium
experience of computers then they will spent more hours
in learning by learning management system. Although
there may exist other significant factors which are not
included in the sample as only 6.8% of variation in
dependent variable is explained by the two predictors.
Also, a better regression model can be found if more
candidates are taken in the sample.
Introduction
Results
Background
With the rapid increase of technology and education
system many universities and companies are
implementing the learning management system due to
its advantages. The advantages of LMS includes face-to-
face learning, saving of time and money for
organizations, ease of administration, user friendly and
website based environment, blended solutions of
learning problems. This project deals with finding
critical factors that influences the LMS system success
by using statistical tools and methods as shown in the
later sections.
Research
Question
What are the most significant factors that contributes
towards the success of Learning Management System?
Summary of Models
0 5 10 15 20 25 30
0
10
20
30
40
50
60
Simple Scatter of Total hours per week by Years of
computer experience
Years of computer experience
Total hours per week
Correlations between
variables
Descriptive Statistics of
Gender
Histogram of total hours per week
tabler-icon-diamond-filled.svg

Paraphrase This Document

Need a fresh take? Get an instant paraphrase of this document with our AI Paraphraser
[object Object]