Lobelia Ltd: Cost Estimation, Budgeting, and Variance Analysis
VerifiedAdded on 2023/06/11
|12
|2814
|301
Case Study
AI Summary
This business finance case study analyzes cost estimation and variance analysis, focusing on Lobelia Ltd. Part A covers contribution per unit, break-even point calculations, margin of safety, and profit calculation using marginal and absorption costing, including reconciliation. A memo highlights the importance of contribution margin for business decisions. Part B emphasizes standard costing and variance analysis, calculating material and labor variances. It also discusses the preparation of a budget for controlling operations. The analysis provides insights into cost management and financial decision-making, offering practical applications for understanding and improving a company's financial performance. Desklib provides access to this and other solved assignments.

Business Finance
ASSESSMENT 1
ASSESSMENT 1
Paraphrase This Document
Need a fresh take? Get an instant paraphrase of this document with our AI Paraphraser
Contents
INTRODUCTION...........................................................................................................................3
PART A...........................................................................................................................................3
Calculation of contribution per unit.............................................................................................3
Calculation of breakeven point in units and breakeven sales......................................................3
Calculation of margin of safety...................................................................................................4
Calculation of number of units sold.............................................................................................5
Preparation of memo suggesting the finance manager the importance of contribution:.............5
Calculation of profit using marginal and absorption costing and reconciliation between them. 6
PART B...........................................................................................................................................8
Importance of Standard Costing and Variance Analysis.............................................................8
Calculation of material and labour variance along with comment on them................................8
Preparation of budget for controlling the operations.................................................................10
CONCLUSION..............................................................................................................................10
REFERENCES..............................................................................................................................11
INTRODUCTION
Simply put, company finance is the process of effectively managing an organization's
finances so that its cash are not misappropriated. It is critical for the organisation to engage
clever financial experts with proper understanding of money and their treatment in order to carry
out optimal utilisation (Jiang, and et.al., 2020). This paper contains two case studies pertaining to
cost estimation and investment assessment approaches used to assess the project's feasibility. The
material and labour variations were estimated in order to better understand the disparity in those
areas.
PART A
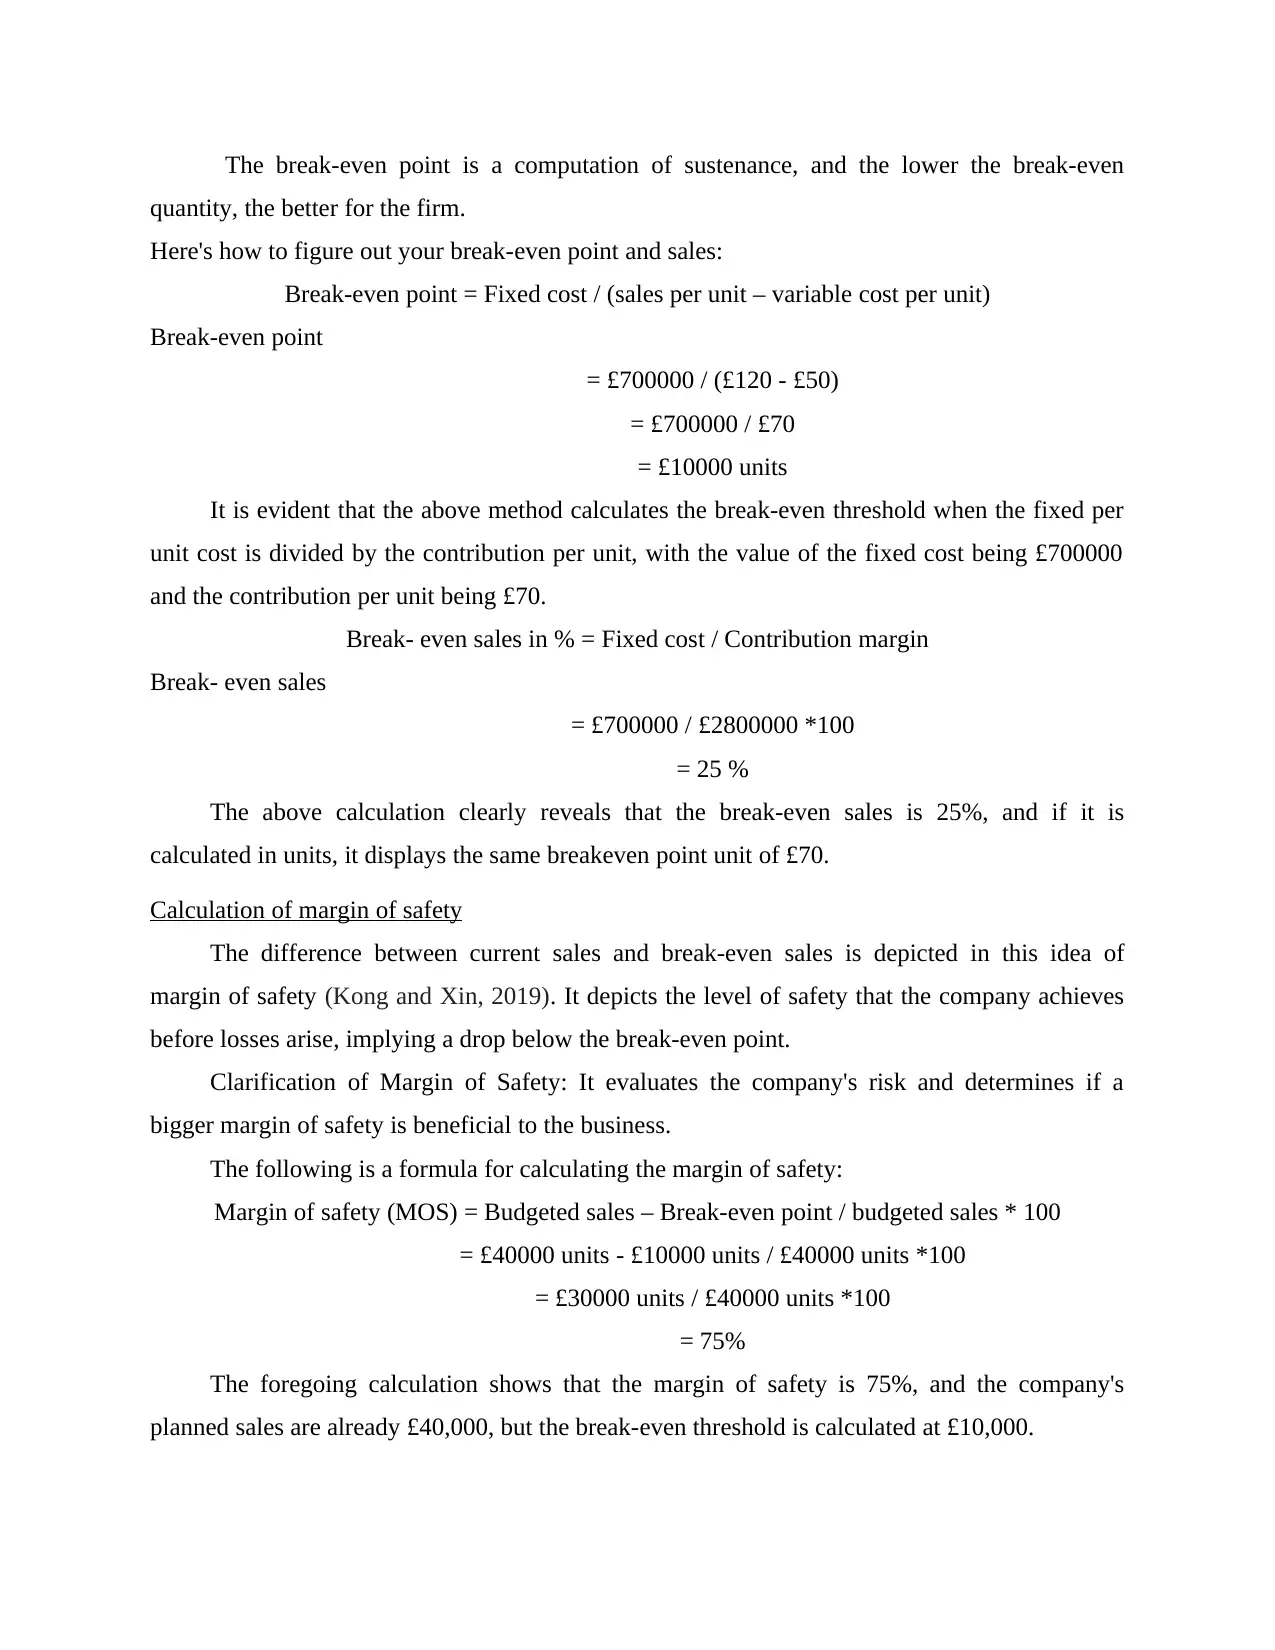
Calculation of contribution per unit
It may also be described as profit on a single unit's sale, after all variable expenditures have
been deducted, the amount remaining is referred to as contribution. This information is useful in
determining the cheapest price at which to sell the item.
Contribution per unit = sales per unit – variable cost per unit
= £120 – £50
= £70 per unit
It can now be seen that revenues per unit are £120, variable expenses are £50 per unit, and
the Lobelia Ltd firm contributes £70 per unit.
Calculation of breakeven point in units and breakeven sales
This is the most crucial idea to understand since it weighs a new company's costs, goods,
and services against the unit of the selling price to determine when it will break even.
Essentially, it is the point in the sales process when the total of fixed and variable costs equals
total sales revenue (Ross, and et.al., 2019). On the other hand, the break-even point is a point at
which the firm makes neither a profit nor a loss. Simply said, the break-even point is the amount
of income required to cover all fixed and variable costs. If a company's sales are lower than
expected, the break-even point will be lower. However, if the company's income is substantial,
the break-even point is reached, and profit is generated, but only after all expenditures are taken
into account.
Simplification of Break- even point:
Simply put, company finance is the process of effectively managing an organization's
finances so that its cash are not misappropriated. It is critical for the organisation to engage
clever financial experts with proper understanding of money and their treatment in order to carry
out optimal utilisation (Jiang, and et.al., 2020). This paper contains two case studies pertaining to
cost estimation and investment assessment approaches used to assess the project's feasibility. The
material and labour variations were estimated in order to better understand the disparity in those
areas.
PART A
Calculation of contribution per unit
It may also be described as profit on a single unit's sale, after all variable expenditures have
been deducted, the amount remaining is referred to as contribution. This information is useful in
determining the cheapest price at which to sell the item.
Contribution per unit = sales per unit – variable cost per unit
= £120 – £50
= £70 per unit
It can now be seen that revenues per unit are £120, variable expenses are £50 per unit, and
the Lobelia Ltd firm contributes £70 per unit.
Calculation of breakeven point in units and breakeven sales
This is the most crucial idea to understand since it weighs a new company's costs, goods,
and services against the unit of the selling price to determine when it will break even.
Essentially, it is the point in the sales process when the total of fixed and variable costs equals
total sales revenue (Ross, and et.al., 2019). On the other hand, the break-even point is a point at
which the firm makes neither a profit nor a loss. Simply said, the break-even point is the amount
of income required to cover all fixed and variable costs. If a company's sales are lower than
expected, the break-even point will be lower. However, if the company's income is substantial,
the break-even point is reached, and profit is generated, but only after all expenditures are taken
into account.
Simplification of Break- even point:
⊘ This is a preview!⊘
Do you want full access?
Subscribe today to unlock all pages.
Trusted by 1+ million students worldwide
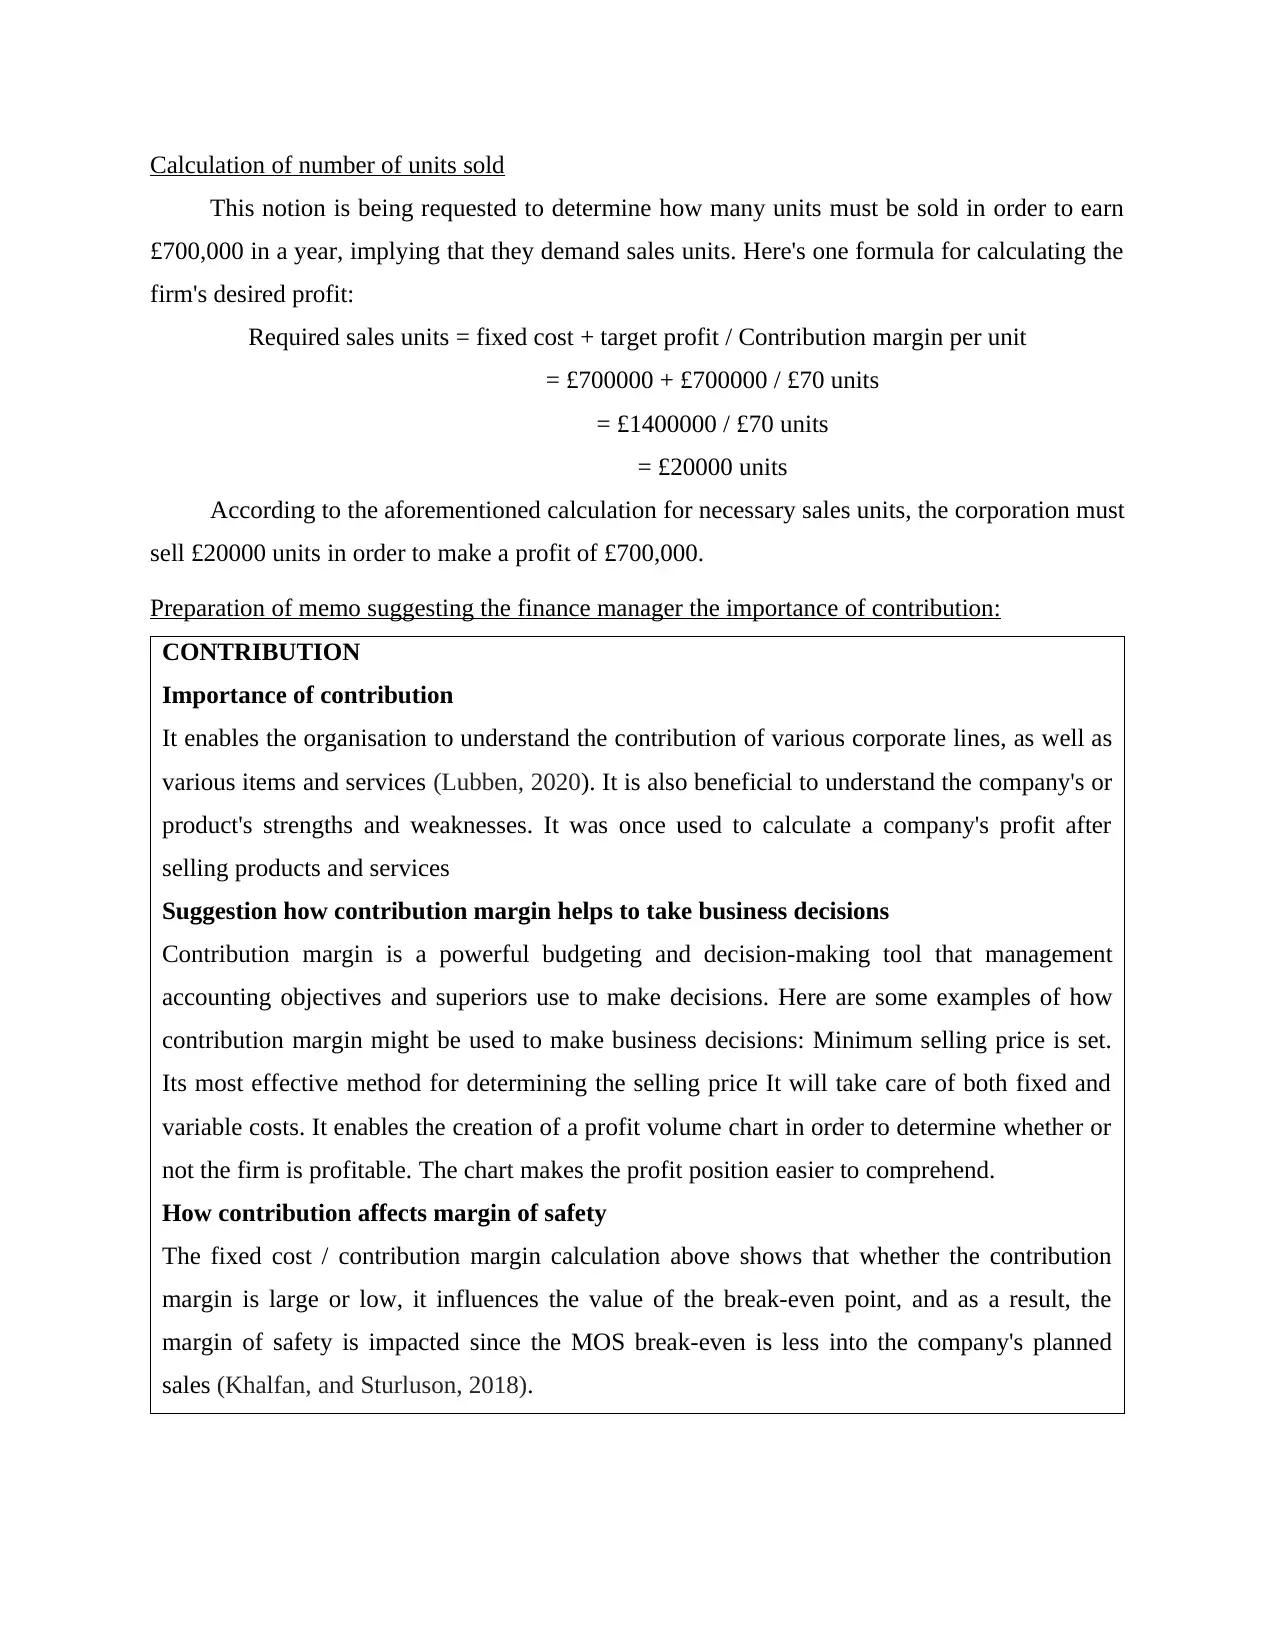
The break-even point is a computation of sustenance, and the lower the break-even
quantity, the better for the firm.
Here's how to figure out your break-even point and sales:
Break-even point = Fixed cost / (sales per unit – variable cost per unit)
Break-even point
= £700000 / (£120 - £50)
= £700000 / £70
= £10000 units
It is evident that the above method calculates the break-even threshold when the fixed per
unit cost is divided by the contribution per unit, with the value of the fixed cost being £700000
and the contribution per unit being £70.
Break- even sales in % = Fixed cost / Contribution margin
Break- even sales
= £700000 / £2800000 *100
= 25 %
The above calculation clearly reveals that the break-even sales is 25%, and if it is
calculated in units, it displays the same breakeven point unit of £70.
Calculation of margin of safety
The difference between current sales and break-even sales is depicted in this idea of
margin of safety (Kong and Xin, 2019). It depicts the level of safety that the company achieves
before losses arise, implying a drop below the break-even point.
Clarification of Margin of Safety: It evaluates the company's risk and determines if a
bigger margin of safety is beneficial to the business.
The following is a formula for calculating the margin of safety:
Margin of safety (MOS) = Budgeted sales – Break-even point / budgeted sales * 100
= £40000 units - £10000 units / £40000 units *100
= £30000 units / £40000 units *100
= 75%
The foregoing calculation shows that the margin of safety is 75%, and the company's
planned sales are already £40,000, but the break-even threshold is calculated at £10,000.
Paraphrase This Document
Need a fresh take? Get an instant paraphrase of this document with our AI Paraphraser
Calculation of number of units sold
This notion is being requested to determine how many units must be sold in order to earn
£700,000 in a year, implying that they demand sales units. Here's one formula for calculating the
firm's desired profit:
Required sales units = fixed cost + target profit / Contribution margin per unit
= £700000 + £700000 / £70 units
= £1400000 / £70 units
= £20000 units
According to the aforementioned calculation for necessary sales units, the corporation must
sell £20000 units in order to make a profit of £700,000.
Preparation of memo suggesting the finance manager the importance of contribution:
CONTRIBUTION
Importance of contribution
It enables the organisation to understand the contribution of various corporate lines, as well as
various items and services (Lubben, 2020). It is also beneficial to understand the company's or
product's strengths and weaknesses. It was once used to calculate a company's profit after
selling products and services
Suggestion how contribution margin helps to take business decisions
Contribution margin is a powerful budgeting and decision-making tool that management
accounting objectives and superiors use to make decisions. Here are some examples of how
contribution margin might be used to make business decisions: Minimum selling price is set.
Its most effective method for determining the selling price It will take care of both fixed and
variable costs. It enables the creation of a profit volume chart in order to determine whether or
not the firm is profitable. The chart makes the profit position easier to comprehend.
How contribution affects margin of safety
The fixed cost / contribution margin calculation above shows that whether the contribution
margin is large or low, it influences the value of the break-even point, and as a result, the
margin of safety is impacted since the MOS break-even is less into the company's planned
sales (Khalfan, and Sturluson, 2018).
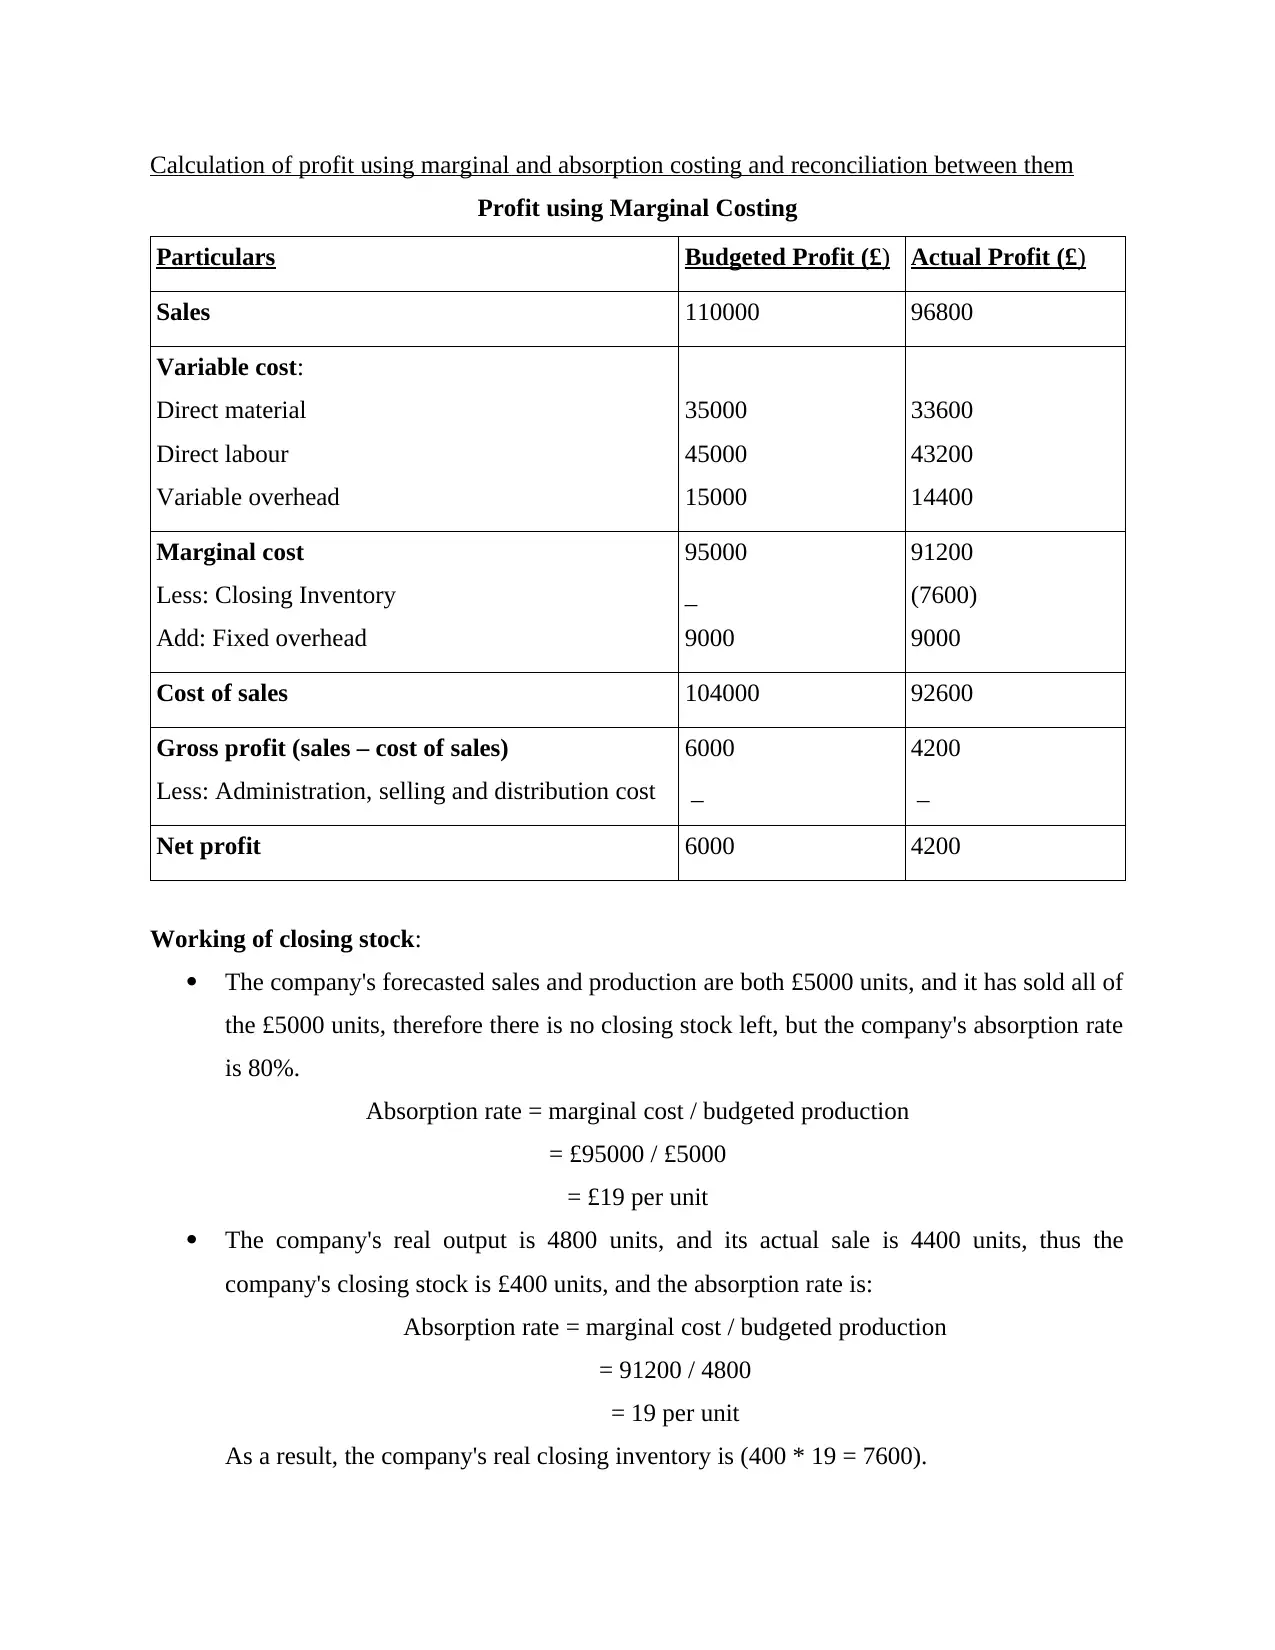
Calculation of profit using marginal and absorption costing and reconciliation between them
Profit using Marginal Costing
Particulars Budgeted Profit (£) Actual Profit (£)
Sales 110000 96800
Variable cost:
Direct material
Direct labour
Variable overhead
35000
45000
15000
33600
43200
14400
Marginal cost
Less: Closing Inventory
Add: Fixed overhead
95000
_
9000
91200
(7600)
9000
Cost of sales 104000 92600
Gross profit (sales – cost of sales)
Less: Administration, selling and distribution cost
6000
_
4200
_
Net profit 6000 4200
Working of closing stock:
The company's forecasted sales and production are both £5000 units, and it has sold all of
the £5000 units, therefore there is no closing stock left, but the company's absorption rate
is 80%.
Absorption rate = marginal cost / budgeted production
= £95000 / £5000
= £19 per unit
The company's real output is 4800 units, and its actual sale is 4400 units, thus the
company's closing stock is £400 units, and the absorption rate is:
Absorption rate = marginal cost / budgeted production
= 91200 / 4800
= 19 per unit
As a result, the company's real closing inventory is (400 * 19 = 7600).
⊘ This is a preview!⊘
Do you want full access?
Subscribe today to unlock all pages.
Trusted by 1+ million students worldwide
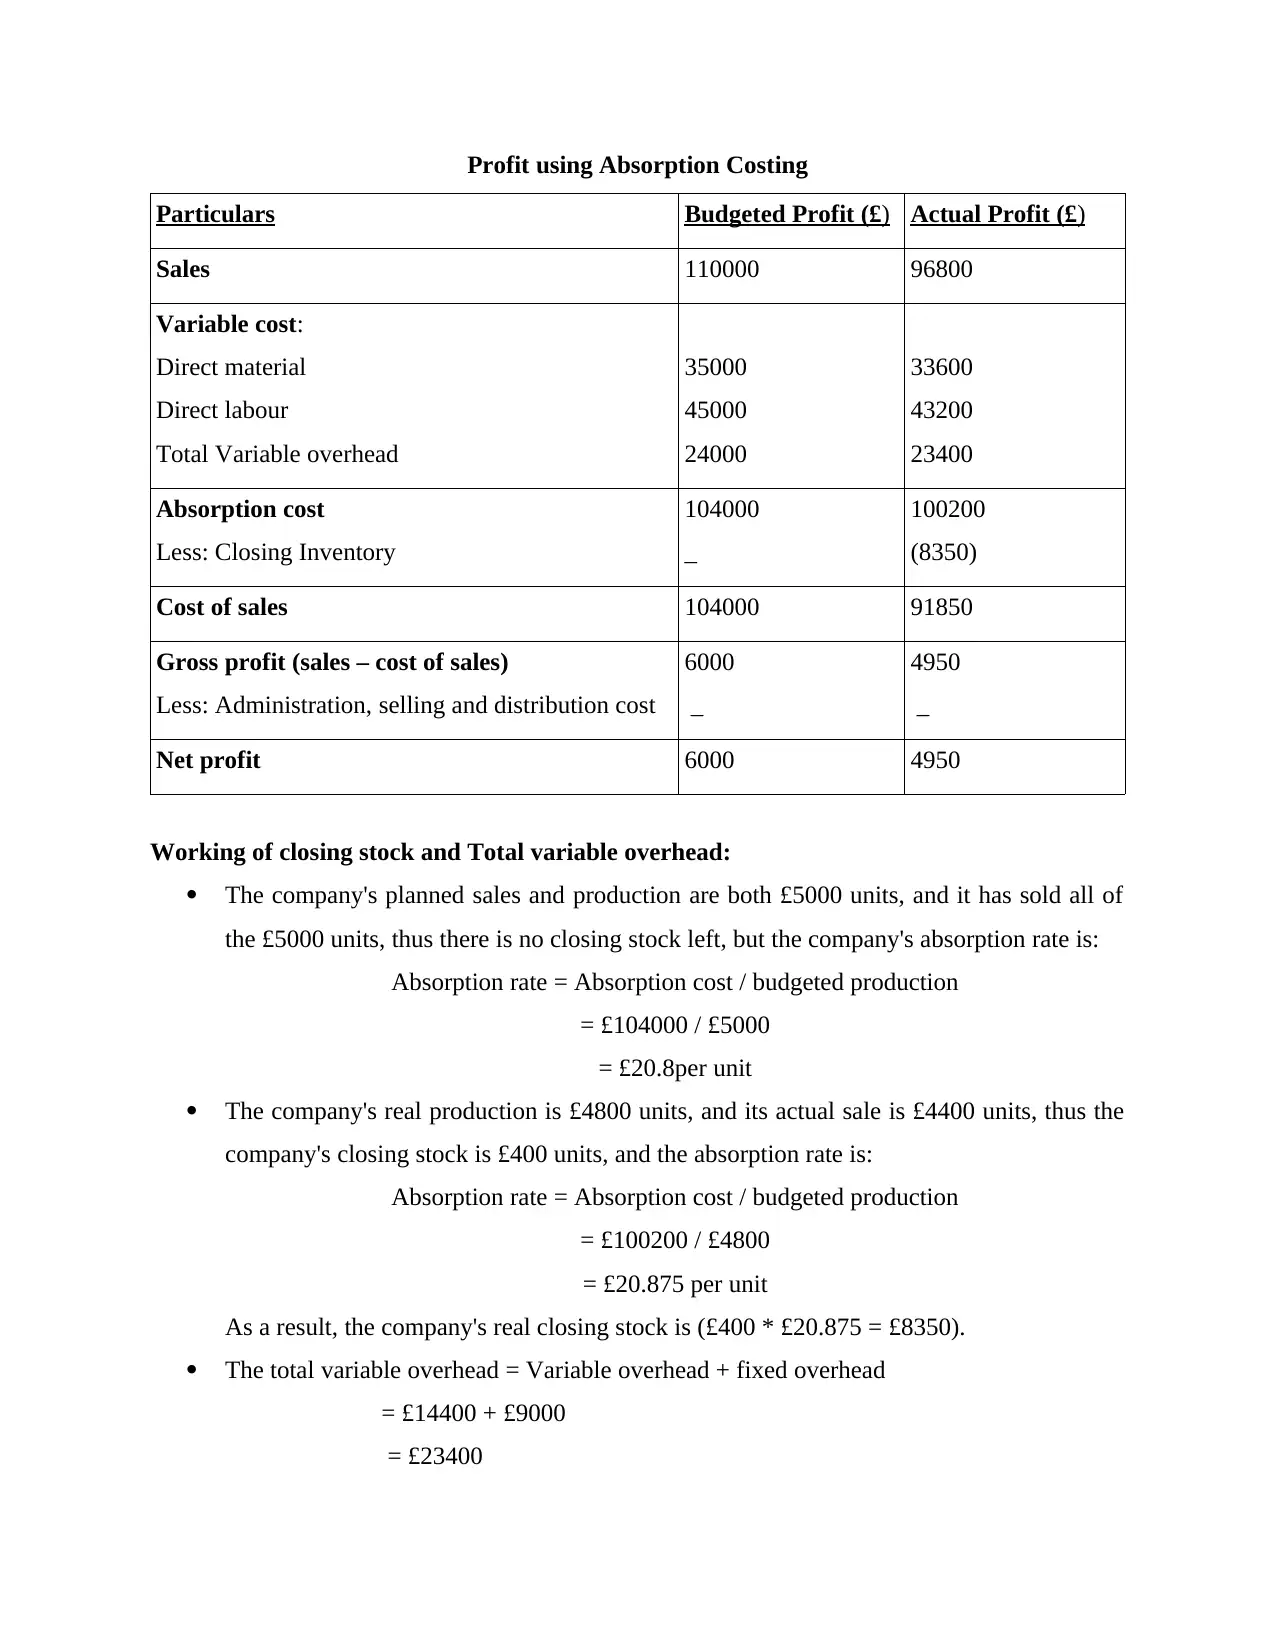
Profit using Absorption Costing
Particulars Budgeted Profit (£) Actual Profit (£)
Sales 110000 96800
Variable cost:
Direct material
Direct labour
Total Variable overhead
35000
45000
24000
33600
43200
23400
Absorption cost
Less: Closing Inventory
104000
_
100200
(8350)
Cost of sales 104000 91850
Gross profit (sales – cost of sales)
Less: Administration, selling and distribution cost
6000
_
4950
_
Net profit 6000 4950
Working of closing stock and Total variable overhead:
The company's planned sales and production are both £5000 units, and it has sold all of
the £5000 units, thus there is no closing stock left, but the company's absorption rate is:
Absorption rate = Absorption cost / budgeted production
= £104000 / £5000
= £20.8per unit
The company's real production is £4800 units, and its actual sale is £4400 units, thus the
company's closing stock is £400 units, and the absorption rate is:
Absorption rate = Absorption cost / budgeted production
= £100200 / £4800
= £20.875 per unit
As a result, the company's real closing stock is (£400 * £20.875 = £8350).
The total variable overhead = Variable overhead + fixed overhead
= £14400 + £9000
= £23400
Paraphrase This Document
Need a fresh take? Get an instant paraphrase of this document with our AI Paraphraser
PART B
Importance of Standard Costing and Variance Analysis
To assess the functioning of a responsibility centre, standards or standard costs are created.
Standard costs are also used to assess inventories when real values are not readily available and
to calculate selling prices, particularly when drafting bids, in addition to performance evaluation
and cost control (Lee, and Park, 2018). The standard costing method is generally recognised
because it meets a variety of organisational demands. For the following reasons, conventional
pricing is preferable.
Prediction of future costs for decision-making: Standard costs are established after
taking into account all current situations and future possibilities. As a result, for the
purposes of cost assessment and profitability from a planned project/order/activity,
standard cost is future cost.
Provide a target to be met: Standard costs are the expenses that the responsibility
centres should not exceed. A responsibility center's performance is constantly evaluated
and measured against established benchmarks (Sojli, Tham, and Wang, 2018). Any
deviation from the standard is observed and reported so that the proper action may be
taken.
Used in budgetary control evaluation: Standard costs are used to create budgets, and
managerial performance is assessed using these budgets. This has two advantages: first,
managers of responsibility centres will not sacrifice quality in order to meet the budgeted
amount, and second, variations can be tracked back to the accountable department or
individual.
Interim profit measurement and inventory valuation: The true profit is only known
when the books are closed. However, for managerial reporting and decision-making, an
organisation may need to create profitability statements for intermediate periods.
Standard costs are subtracted from revenue to arrive at a profit number (Millstein, and
et.al., 2019).
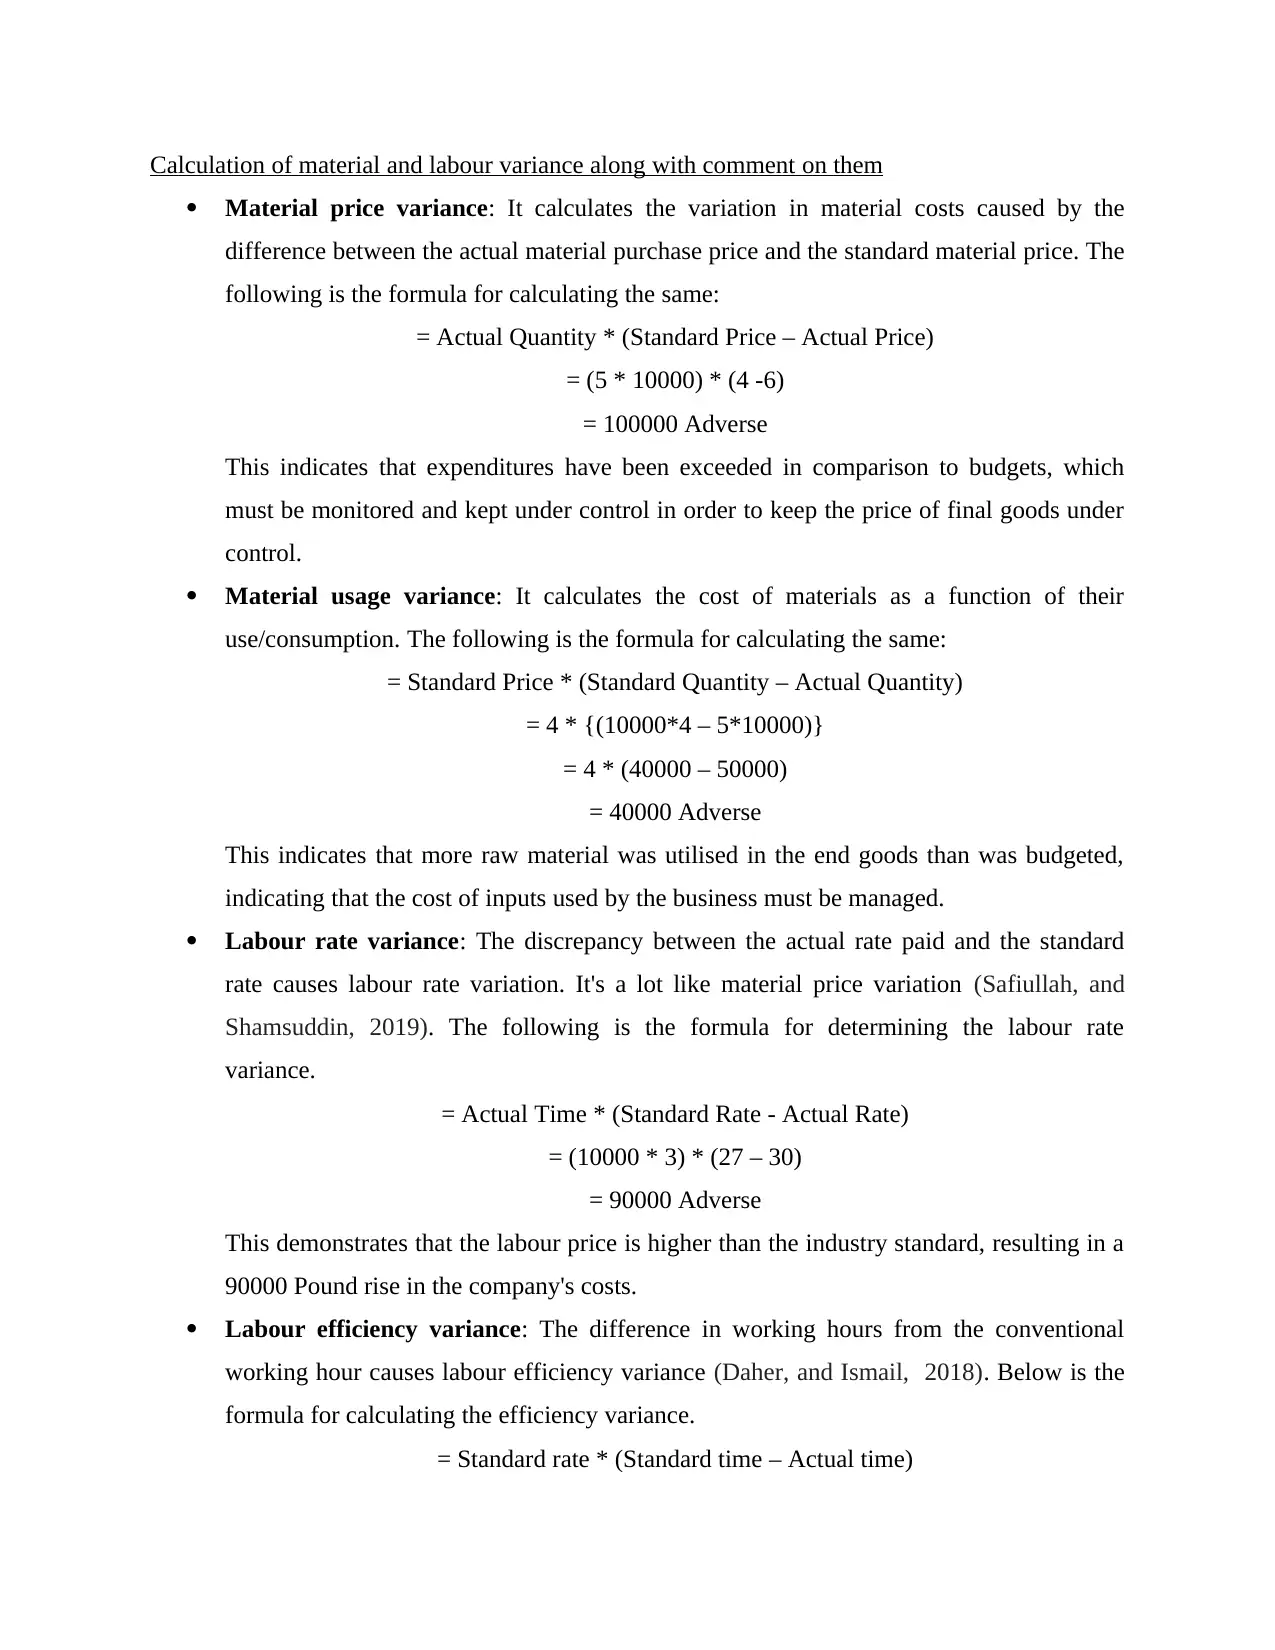
Calculation of material and labour variance along with comment on them
Material price variance: It calculates the variation in material costs caused by the
difference between the actual material purchase price and the standard material price. The
following is the formula for calculating the same:
= Actual Quantity * (Standard Price – Actual Price)
= (5 * 10000) * (4 -6)
= 100000 Adverse
This indicates that expenditures have been exceeded in comparison to budgets, which
must be monitored and kept under control in order to keep the price of final goods under
control.
Material usage variance: It calculates the cost of materials as a function of their
use/consumption. The following is the formula for calculating the same:
= Standard Price * (Standard Quantity – Actual Quantity)
= 4 * {(10000*4 – 5*10000)}
= 4 * (40000 – 50000)
= 40000 Adverse
This indicates that more raw material was utilised in the end goods than was budgeted,
indicating that the cost of inputs used by the business must be managed.
Labour rate variance: The discrepancy between the actual rate paid and the standard
rate causes labour rate variation. It's a lot like material price variation (Safiullah, and
Shamsuddin, 2019). The following is the formula for determining the labour rate
variance.
= Actual Time * (Standard Rate - Actual Rate)
= (10000 * 3) * (27 – 30)
= 90000 Adverse
This demonstrates that the labour price is higher than the industry standard, resulting in a
90000 Pound rise in the company's costs.
Labour efficiency variance: The difference in working hours from the conventional
working hour causes labour efficiency variance (Daher, and Ismail, 2018). Below is the
formula for calculating the efficiency variance.
= Standard rate * (Standard time – Actual time)
⊘ This is a preview!⊘
Do you want full access?
Subscribe today to unlock all pages.
Trusted by 1+ million students worldwide
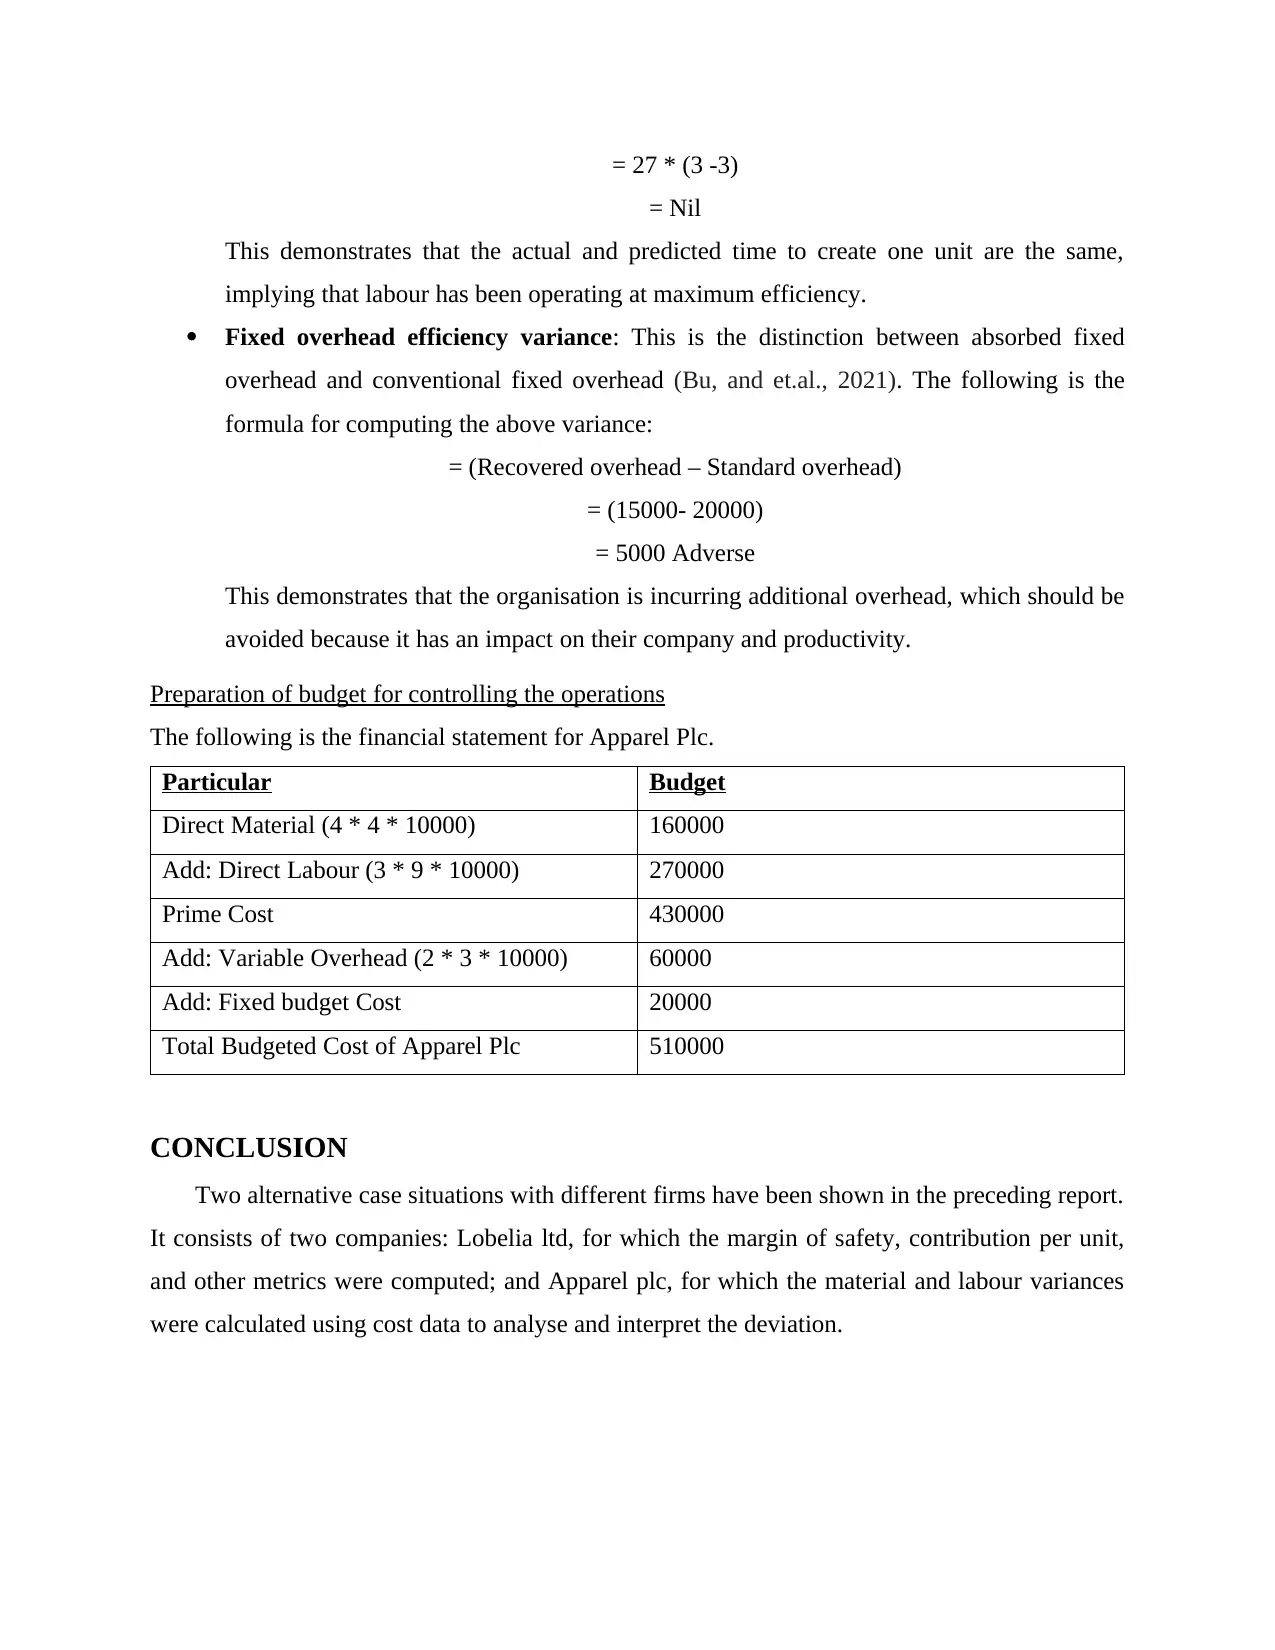
= 27 * (3 -3)
= Nil
This demonstrates that the actual and predicted time to create one unit are the same,
implying that labour has been operating at maximum efficiency.
Fixed overhead efficiency variance: This is the distinction between absorbed fixed
overhead and conventional fixed overhead (Bu, and et.al., 2021). The following is the
formula for computing the above variance:
= (Recovered overhead – Standard overhead)
= (15000- 20000)
= 5000 Adverse
This demonstrates that the organisation is incurring additional overhead, which should be
avoided because it has an impact on their company and productivity.
Preparation of budget for controlling the operations
The following is the financial statement for Apparel Plc.
Particular Budget
Direct Material (4 * 4 * 10000) 160000
Add: Direct Labour (3 * 9 * 10000) 270000
Prime Cost 430000
Add: Variable Overhead (2 * 3 * 10000) 60000
Add: Fixed budget Cost 20000
Total Budgeted Cost of Apparel Plc 510000
CONCLUSION
Two alternative case situations with different firms have been shown in the preceding report.
It consists of two companies: Lobelia ltd, for which the margin of safety, contribution per unit,
and other metrics were computed; and Apparel plc, for which the material and labour variances
were calculated using cost data to analyse and interpret the deviation.
Paraphrase This Document
Need a fresh take? Get an instant paraphrase of this document with our AI Paraphraser

REFERENCES
Books and Journals
Jiang, F., and et.al., 2020. Capital markets, financial institutions, and corporate finance in
China. Journal of Corporate Finance, 63, p.101309.
Ross, S.A., and et.al., 2019. Corporate finance (pp. 880-86). McGraw-Hill Education.
Kong, D. and Xin, Q., 2019. Corporate finance in China. China Finance Review International.
Lubben, S.J., 2020. Corporate Finance. Wolters Kluwer Law & Business.
Khalfan, T. and Sturluson, J.Þ., 2018. Corporate finance approaches of Icelandic private firms
after the financial crisis. Managerial Finance.
Lee, H. and Park, K., 2018. Advances in the corporate finance literature: a survey of recent
studies on Korea. Managerial Finance.
Sojli, E., Tham, W.W. and Wang, W., 2018. Time-varying Group Unobserved Heterogeneity in
Finance. Available at SSRN 3258048.
Millstein, I., and et.al., 2019. Session I: corporate purpose and governance. Journal of Applied
Corporate Finance, 31(3), pp.10-25.
Safiullah, M. and Shamsuddin, A., 2019. Risk-adjusted efficiency and corporate governance:
Evidence from Islamic and conventional banks. Journal of Corporate Finance, 55,
pp.105-140.
Bu, L., and et.al., 2021. Talented inside directors and corporate social responsibility: A tale of
two roles. Journal of Corporate Finance, 70, p.102044.
Daher, M.M. and Ismail, A.K., 2018. Debt covenants and corporate acquisitions. Journal of
Corporate Finance, 53, pp.174-201.
⊘ This is a preview!⊘
Do you want full access?
Subscribe today to unlock all pages.
Trusted by 1+ million students worldwide
1 out of 12
Related Documents


Your All-in-One AI-Powered Toolkit for Academic Success.
+13062052269
info@desklib.com
Available 24*7 on WhatsApp / Email
![[object Object]](/_next/static/media/star-bottom.7253800d.svg)
Unlock your academic potential
Copyright © 2020–2026 A2Z Services. All Rights Reserved. Developed and managed by ZUCOL.