BUS708 Statistics and Data Analysis: Tax Return Lodgement Report
VerifiedAdded on 2020/05/28
|11
|1933
|211
Report
AI Summary
This report analyzes tax return data, primarily focusing on the lodgement methods employed by Australians and international students. The study utilizes datasets from the Australian Taxation Office (ATO) and a survey of international students to assess the preferences for lodging tax returns through registered tax agents versus self-lodgement. Statistical analyses, including frequency tables, confidence intervals, and chi-square tests, are conducted to examine the relationship between lodgement methods, age groups, total income amounts, and total deduction amounts. The findings reveal a strong preference for tax agents across both datasets, with a positive correlation between total income and the use of tax agents. Furthermore, a positive relationship is identified between total income and total deduction amounts. The report concludes by highlighting the importance of these findings and suggests further investigation into the relationship between lodgement methods and gender.

Running Head: BUS708 STATISTICS AND DATA ANALYSIS
BUS708
Statistics and Data Analysis
Name of the Student
Name of the University
Author Note
BUS708
Statistics and Data Analysis
Name of the Student
Name of the University
Author Note
Paraphrase This Document
Need a fresh take? Get an instant paraphrase of this document with our AI Paraphraser
1BUS708 STATISTICS AND DATA ANALYSIS
Table of Contents
Section 1: Introduction................................................................................................................................2
1.1 Introduction.......................................................................................................................................2
1.2 Explanation of the Tax Return Dataset..............................................................................................2
1.3 Explanation of the International Students Dataset............................................................................2
Section 2: Lodgment Method – Dataset 1...................................................................................................2
Section 3: Lodgement Method – Dataset 2.................................................................................................3
Section 4: Lodgement Method and Age Group...........................................................................................5
Section 5: Lodgement Method and Total Income Amount..........................................................................6
Section 6: Total Income Amount and Total Deduction Amount..................................................................7
Section 7: Conclusion..................................................................................................................................8
References...................................................................................................................................................9
2BUS708 STATISTICS AND DATA ANALYSIS
Section 1: Introduction
1.1 Introduction
Lodging a tax return at the end of each financial year is important for a lot of people in Australia.
The people of Australia can do this by preparing and lodging their tax returns by themselves or get it
done by paying any registered tax agent. According to Kennedy et al. (2017), most of the people of
Australia prefer to get their lodgements done with the help of tax agents. This is a very vital work and
preparing their own tax returns might cause some errors which will be a problem for the individual in
the later years. So unless they are an expert in this matter, people prefer to get it done by agents. This
study mainly aims to find out the proportion of people who are lodging their tax returns by themselves
and with the help of agents. The relationships between total income, lodgement method and deduction
amount are also to be assessed. The preference of the international students on the lodgement
methods of tax return are also to be assessed.
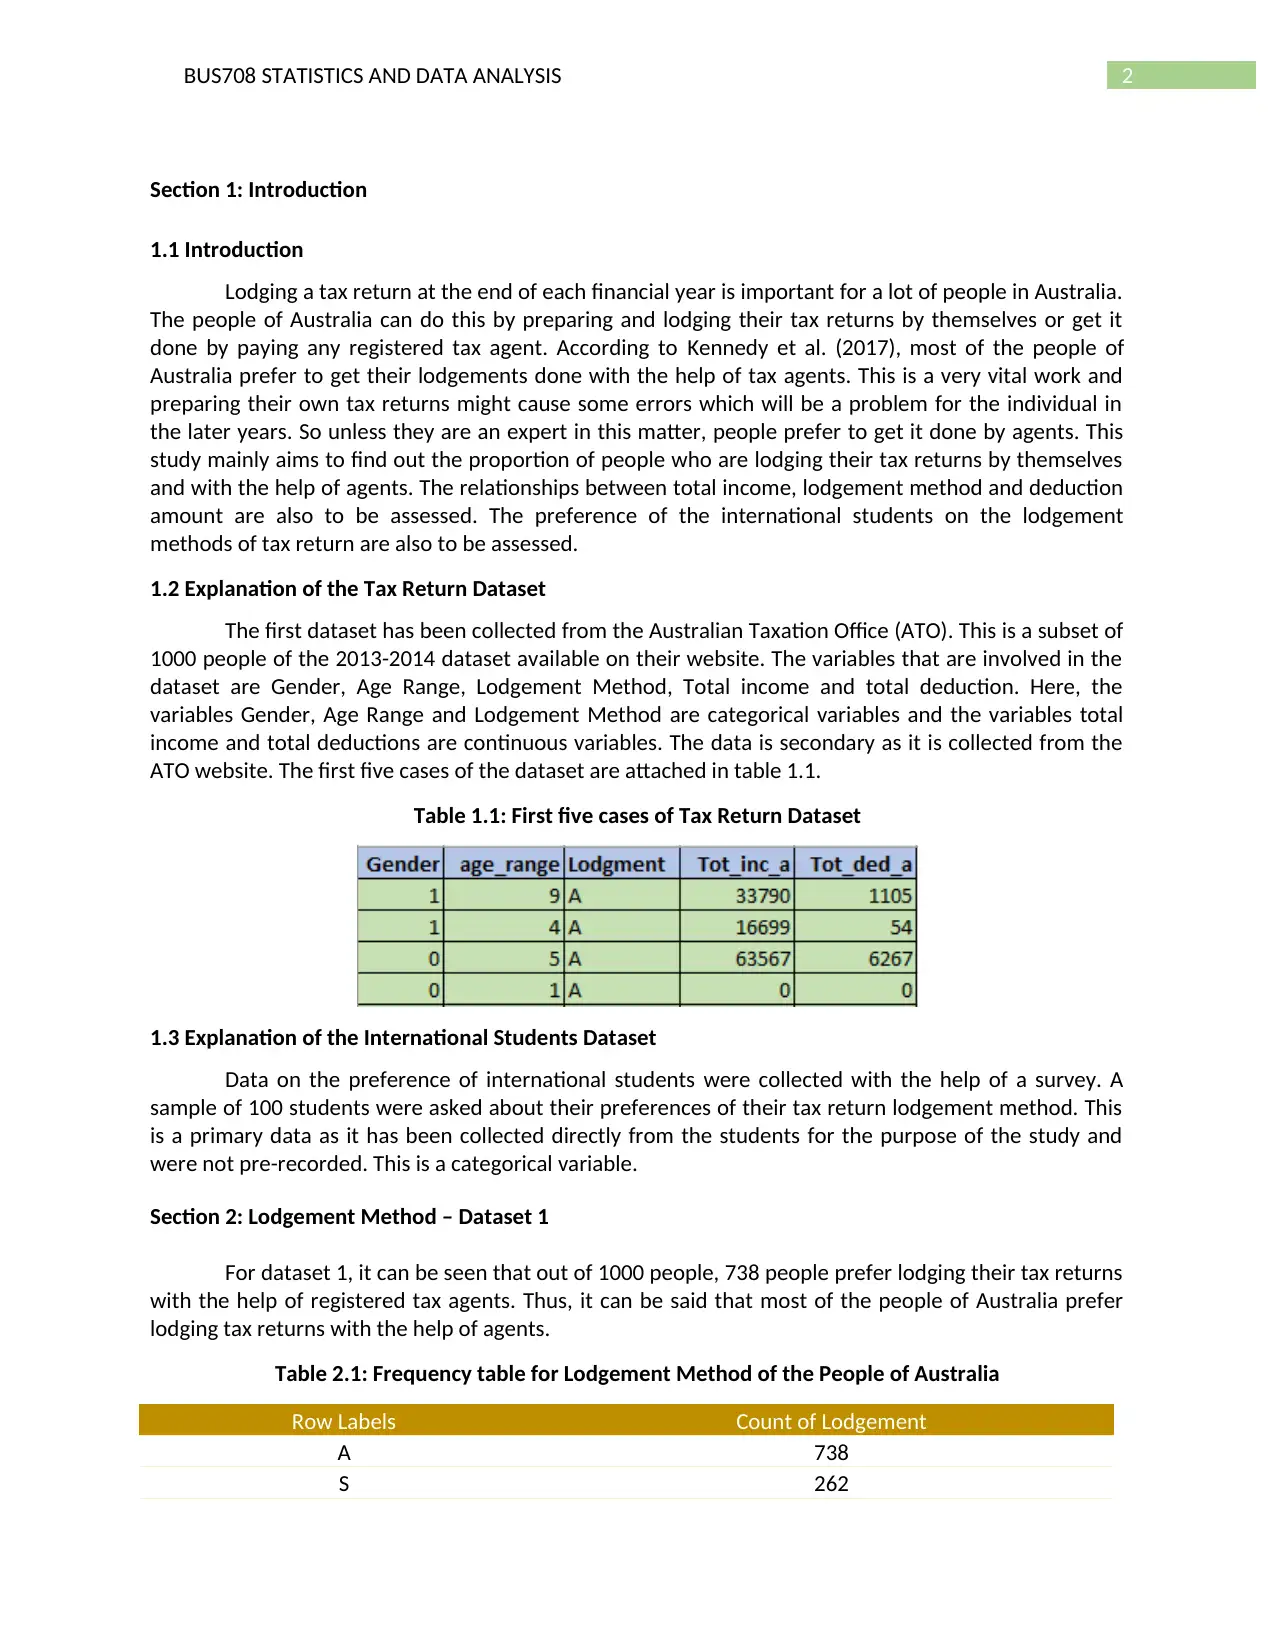
1.2 Explanation of the Tax Return Dataset
The first dataset has been collected from the Australian Taxation Office (ATO). This is a subset of
1000 people of the 2013-2014 dataset available on their website. The variables that are involved in the
dataset are Gender, Age Range, Lodgement Method, Total income and total deduction. Here, the
variables Gender, Age Range and Lodgement Method are categorical variables and the variables total
income and total deductions are continuous variables. The data is secondary as it is collected from the
ATO website. The first five cases of the dataset are attached in table 1.1.
Table 1.1: First five cases of Tax Return Dataset
1.3 Explanation of the International Students Dataset
Data on the preference of international students were collected with the help of a survey. A
sample of 100 students were asked about their preferences of their tax return lodgement method. This
is a primary data as it has been collected directly from the students for the purpose of the study and
were not pre-recorded. This is a categorical variable.
Section 2: Lodgement Method – Dataset 1
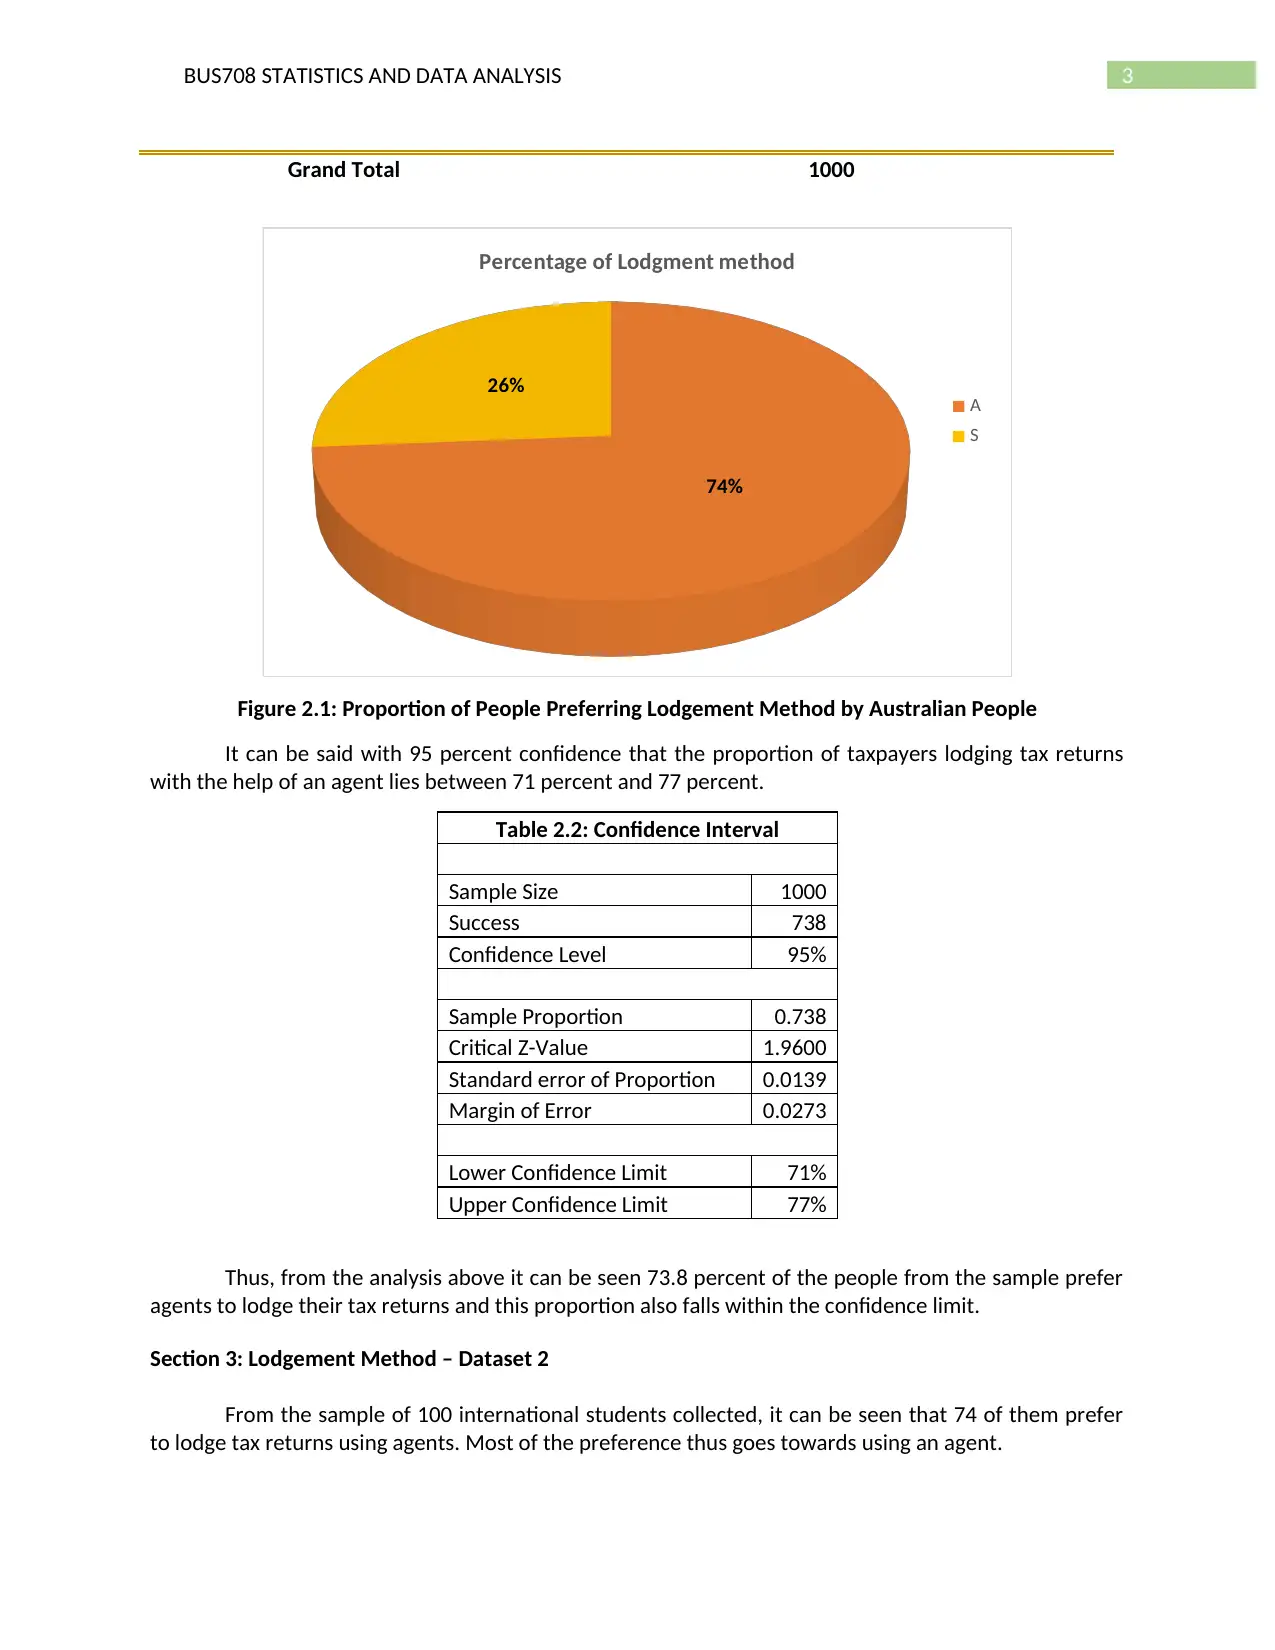
For dataset 1, it can be seen that out of 1000 people, 738 people prefer lodging their tax returns
with the help of registered tax agents. Thus, it can be said that most of the people of Australia prefer
lodging tax returns with the help of agents.
Table 2.1: Frequency table for Lodgement Method of the People of Australia
Row Labels Count of Lodgement
A 738
S 262
Section 1: Introduction
1.1 Introduction
Lodging a tax return at the end of each financial year is important for a lot of people in Australia.
The people of Australia can do this by preparing and lodging their tax returns by themselves or get it
done by paying any registered tax agent. According to Kennedy et al. (2017), most of the people of
Australia prefer to get their lodgements done with the help of tax agents. This is a very vital work and
preparing their own tax returns might cause some errors which will be a problem for the individual in
the later years. So unless they are an expert in this matter, people prefer to get it done by agents. This
study mainly aims to find out the proportion of people who are lodging their tax returns by themselves
and with the help of agents. The relationships between total income, lodgement method and deduction
amount are also to be assessed. The preference of the international students on the lodgement
methods of tax return are also to be assessed.
1.2 Explanation of the Tax Return Dataset
The first dataset has been collected from the Australian Taxation Office (ATO). This is a subset of
1000 people of the 2013-2014 dataset available on their website. The variables that are involved in the
dataset are Gender, Age Range, Lodgement Method, Total income and total deduction. Here, the
variables Gender, Age Range and Lodgement Method are categorical variables and the variables total
income and total deductions are continuous variables. The data is secondary as it is collected from the
ATO website. The first five cases of the dataset are attached in table 1.1.
Table 1.1: First five cases of Tax Return Dataset
1.3 Explanation of the International Students Dataset
Data on the preference of international students were collected with the help of a survey. A
sample of 100 students were asked about their preferences of their tax return lodgement method. This
is a primary data as it has been collected directly from the students for the purpose of the study and
were not pre-recorded. This is a categorical variable.
Section 2: Lodgement Method – Dataset 1
For dataset 1, it can be seen that out of 1000 people, 738 people prefer lodging their tax returns
with the help of registered tax agents. Thus, it can be said that most of the people of Australia prefer
lodging tax returns with the help of agents.
Table 2.1: Frequency table for Lodgement Method of the People of Australia
Row Labels Count of Lodgement
A 738
S 262
⊘ This is a preview!⊘
Do you want full access?
Subscribe today to unlock all pages.
Trusted by 1+ million students worldwide
3BUS708 STATISTICS AND DATA ANALYSIS
Grand Total 1000
74%
26%
Percentage of Lodgment method
A
S
Figure 2.1: Proportion of People Preferring Lodgement Method by Australian People
It can be said with 95 percent confidence that the proportion of taxpayers lodging tax returns
with the help of an agent lies between 71 percent and 77 percent.
Table 2.2: Confidence Interval
Sample Size 1000
Success 738
Confidence Level 95%
Sample Proportion 0.738
Critical Z-Value 1.9600
Standard error of Proportion 0.0139
Margin of Error 0.0273
Lower Confidence Limit 71%
Upper Confidence Limit 77%
Thus, from the analysis above it can be seen 73.8 percent of the people from the sample prefer
agents to lodge their tax returns and this proportion also falls within the confidence limit.
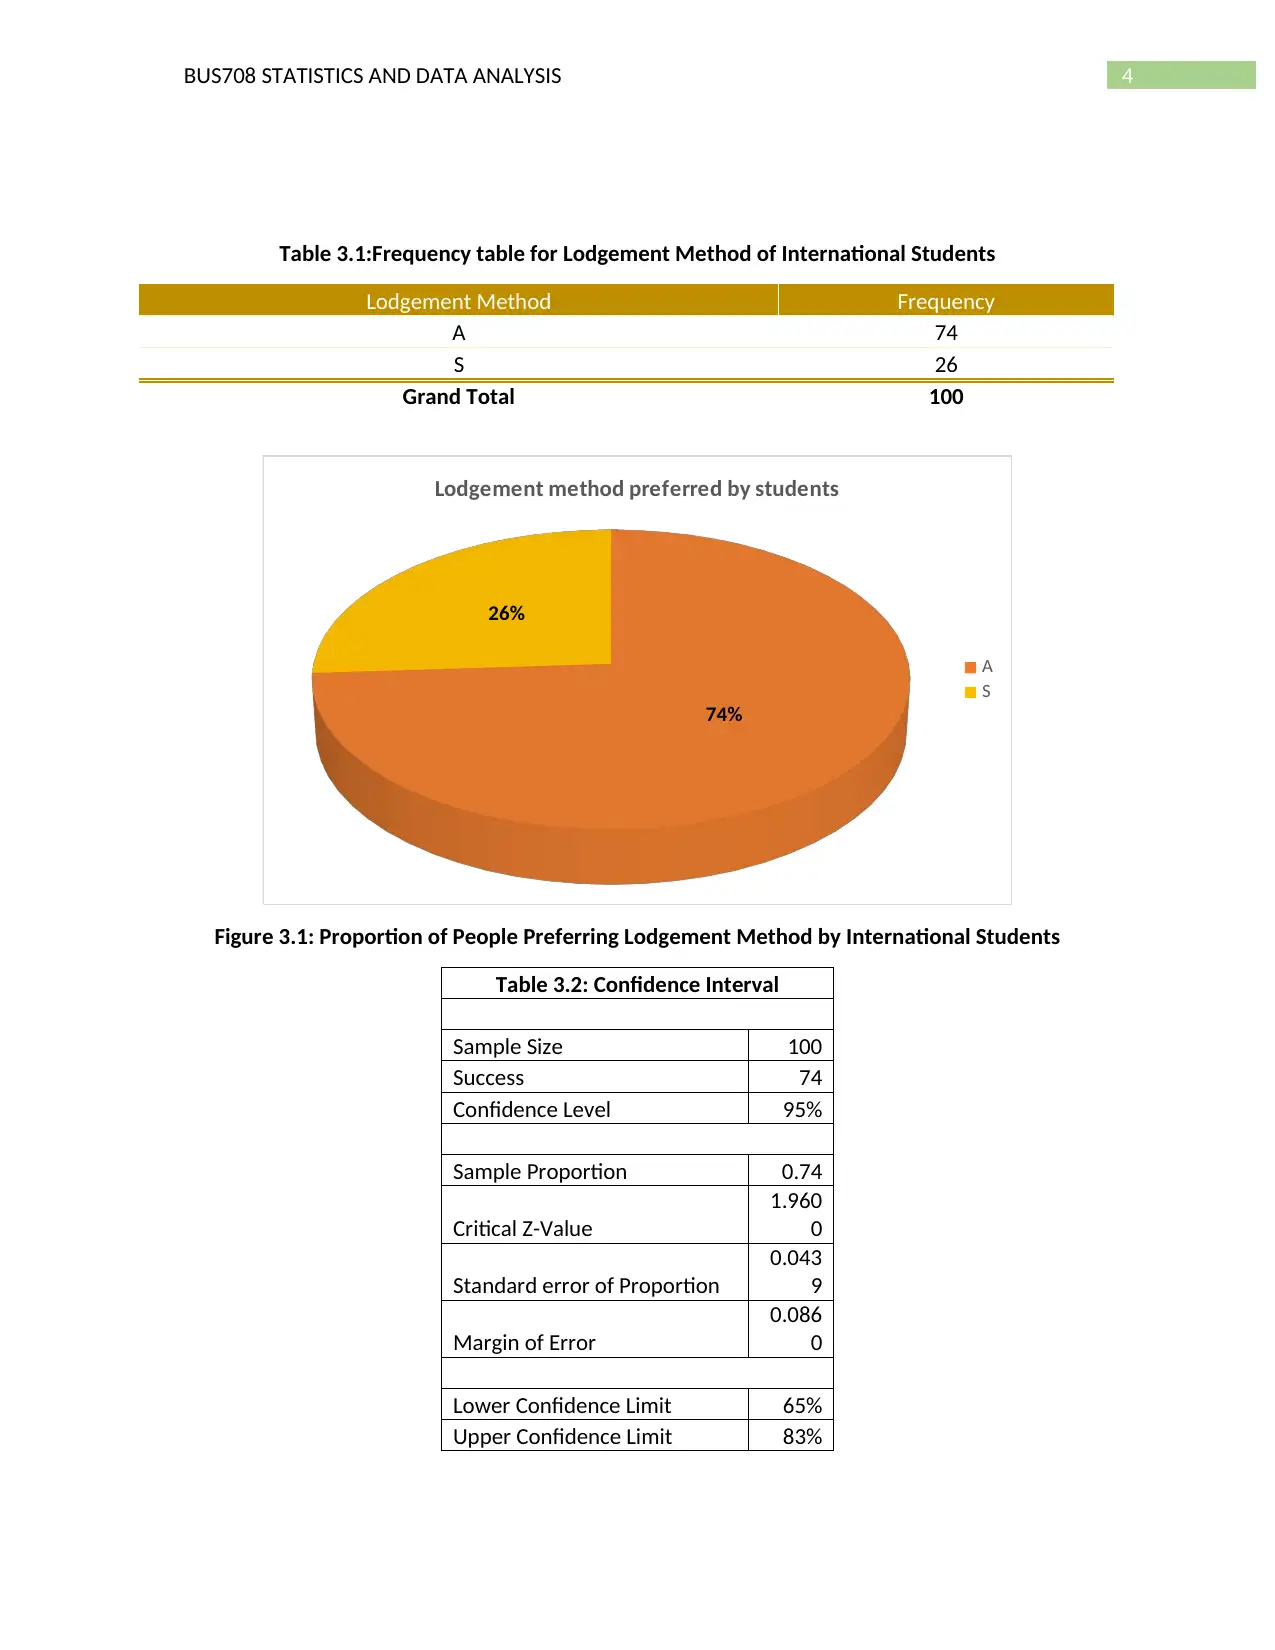
Section 3: Lodgement Method – Dataset 2
From the sample of 100 international students collected, it can be seen that 74 of them prefer
to lodge tax returns using agents. Most of the preference thus goes towards using an agent.
Grand Total 1000
74%
26%
Percentage of Lodgment method
A
S
Figure 2.1: Proportion of People Preferring Lodgement Method by Australian People
It can be said with 95 percent confidence that the proportion of taxpayers lodging tax returns
with the help of an agent lies between 71 percent and 77 percent.
Table 2.2: Confidence Interval
Sample Size 1000
Success 738
Confidence Level 95%
Sample Proportion 0.738
Critical Z-Value 1.9600
Standard error of Proportion 0.0139
Margin of Error 0.0273
Lower Confidence Limit 71%
Upper Confidence Limit 77%
Thus, from the analysis above it can be seen 73.8 percent of the people from the sample prefer
agents to lodge their tax returns and this proportion also falls within the confidence limit.
Section 3: Lodgement Method – Dataset 2
From the sample of 100 international students collected, it can be seen that 74 of them prefer
to lodge tax returns using agents. Most of the preference thus goes towards using an agent.
Paraphrase This Document
Need a fresh take? Get an instant paraphrase of this document with our AI Paraphraser
4BUS708 STATISTICS AND DATA ANALYSIS
Table 3.1:Frequency table for Lodgement Method of International Students
Lodgement Method Frequency
A 74
S 26
Grand Total 100
74%
26%
Lodgement method preferred by students
A
S
Figure 3.1: Proportion of People Preferring Lodgement Method by International Students
Table 3.2: Confidence Interval
Sample Size 100
Success 74
Confidence Level 95%
Sample Proportion 0.74
Critical Z-Value
1.960
0
Standard error of Proportion
0.043
9
Margin of Error
0.086
0
Lower Confidence Limit 65%
Upper Confidence Limit 83%
5BUS708 STATISTICS AND DATA ANALYSIS
It can be said with 95 percent confidence that that the proportion of students preferring agents
over themselves on lodging tax returns lies between 65 percent and 83 percent.
Thus, from the analysis above, it can be seen clearly that most of the students also prefer to give
the responsibility to some experts and not work on their own just like the people of Australia.65 to 83
percent of the students prefer agents. Hence, there is no difference in dataset 1 and dataset 2 in terms
of lodgement method.
Section 4: Lodgement Method and Age Group
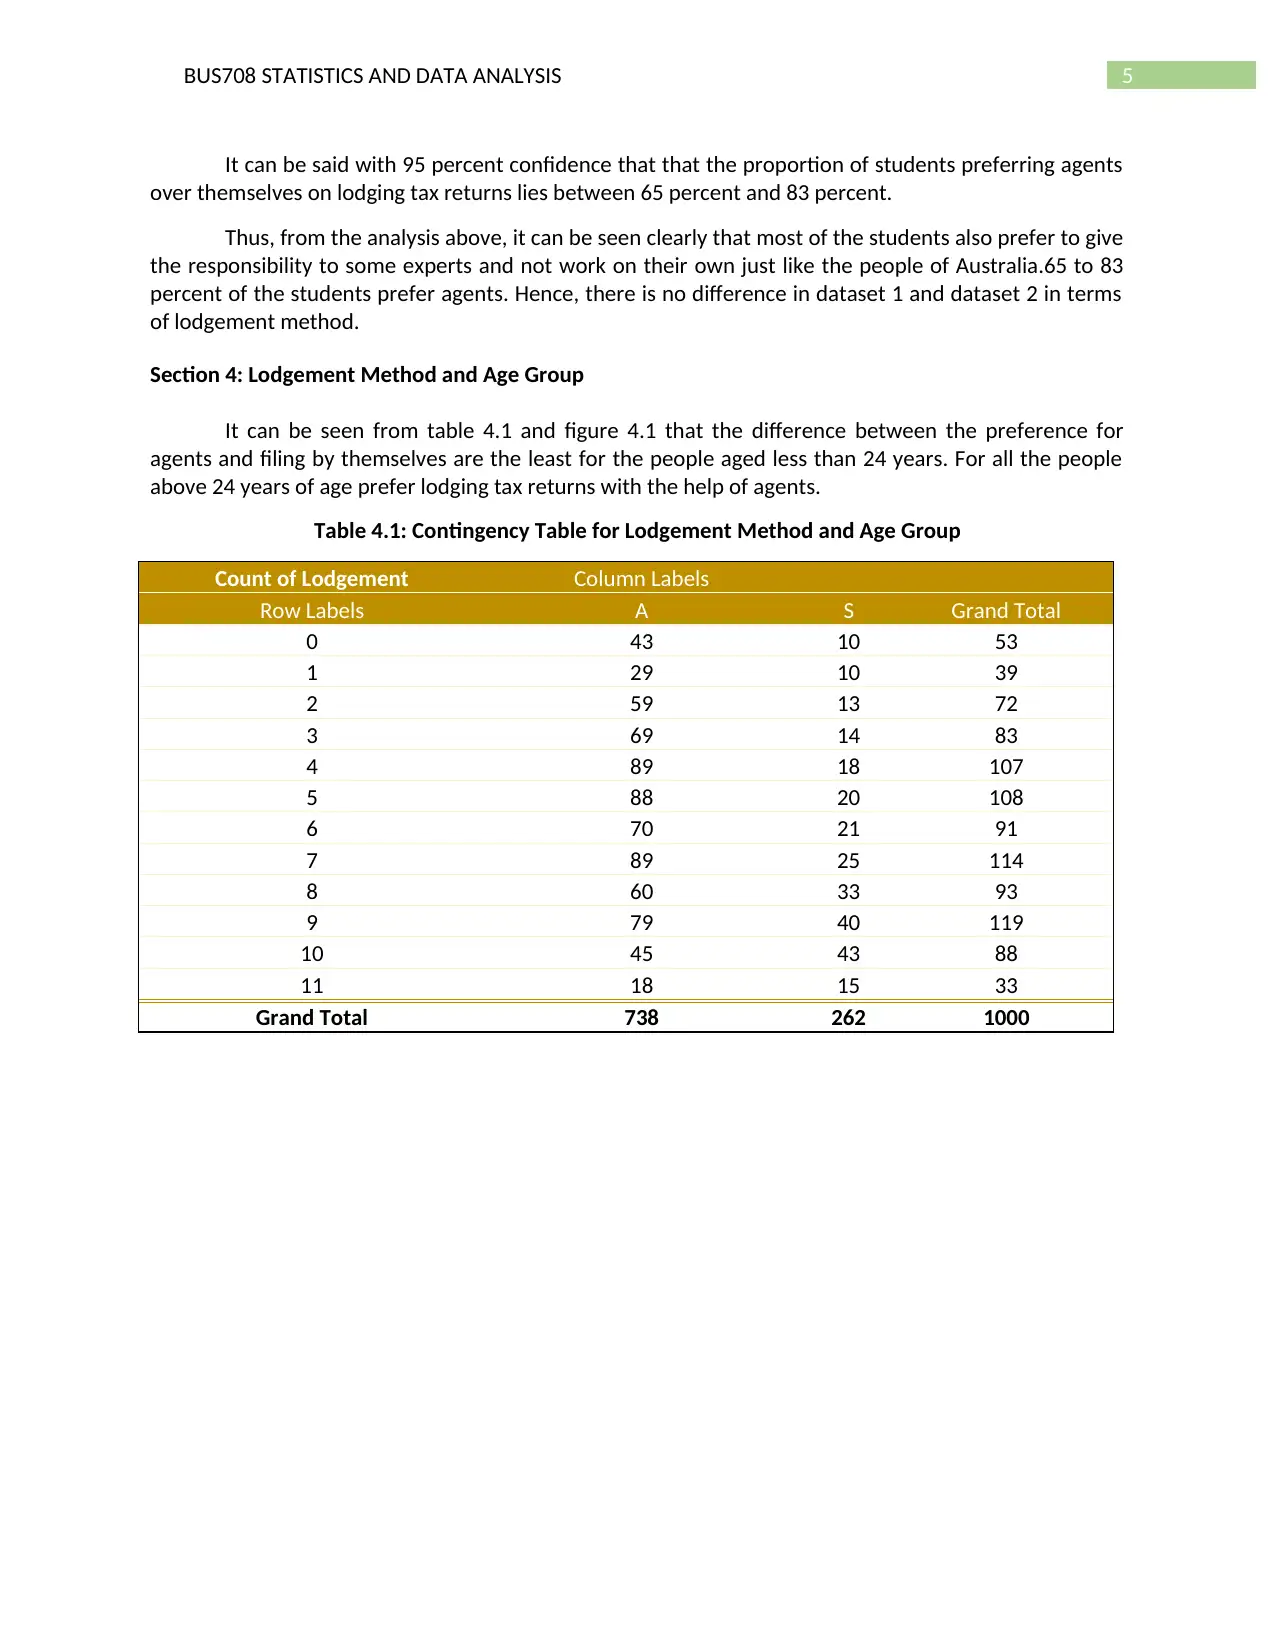
It can be seen from table 4.1 and figure 4.1 that the difference between the preference for
agents and filing by themselves are the least for the people aged less than 24 years. For all the people
above 24 years of age prefer lodging tax returns with the help of agents.
Table 4.1: Contingency Table for Lodgement Method and Age Group
Count of Lodgement Column Labels
Row Labels A S Grand Total
0 43 10 53
1 29 10 39
2 59 13 72
3 69 14 83
4 89 18 107
5 88 20 108
6 70 21 91
7 89 25 114
8 60 33 93
9 79 40 119
10 45 43 88
11 18 15 33
Grand Total 738 262 1000
It can be said with 95 percent confidence that that the proportion of students preferring agents
over themselves on lodging tax returns lies between 65 percent and 83 percent.
Thus, from the analysis above, it can be seen clearly that most of the students also prefer to give
the responsibility to some experts and not work on their own just like the people of Australia.65 to 83
percent of the students prefer agents. Hence, there is no difference in dataset 1 and dataset 2 in terms
of lodgement method.
Section 4: Lodgement Method and Age Group
It can be seen from table 4.1 and figure 4.1 that the difference between the preference for
agents and filing by themselves are the least for the people aged less than 24 years. For all the people
above 24 years of age prefer lodging tax returns with the help of agents.
Table 4.1: Contingency Table for Lodgement Method and Age Group
Count of Lodgement Column Labels
Row Labels A S Grand Total
0 43 10 53
1 29 10 39
2 59 13 72
3 69 14 83
4 89 18 107
5 88 20 108
6 70 21 91
7 89 25 114
8 60 33 93
9 79 40 119
10 45 43 88
11 18 15 33
Grand Total 738 262 1000
⊘ This is a preview!⊘
Do you want full access?
Subscribe today to unlock all pages.
Trusted by 1+ million students worldwide
6BUS708 STATISTICS AND DATA ANALYSIS
0 1 2 3 4 5 6 7 8 9 10 11
0
10
20
30
40
50
60
70
80
90
Relation of Lodgement Method with Age Group
A
S
Age Range
Frequency
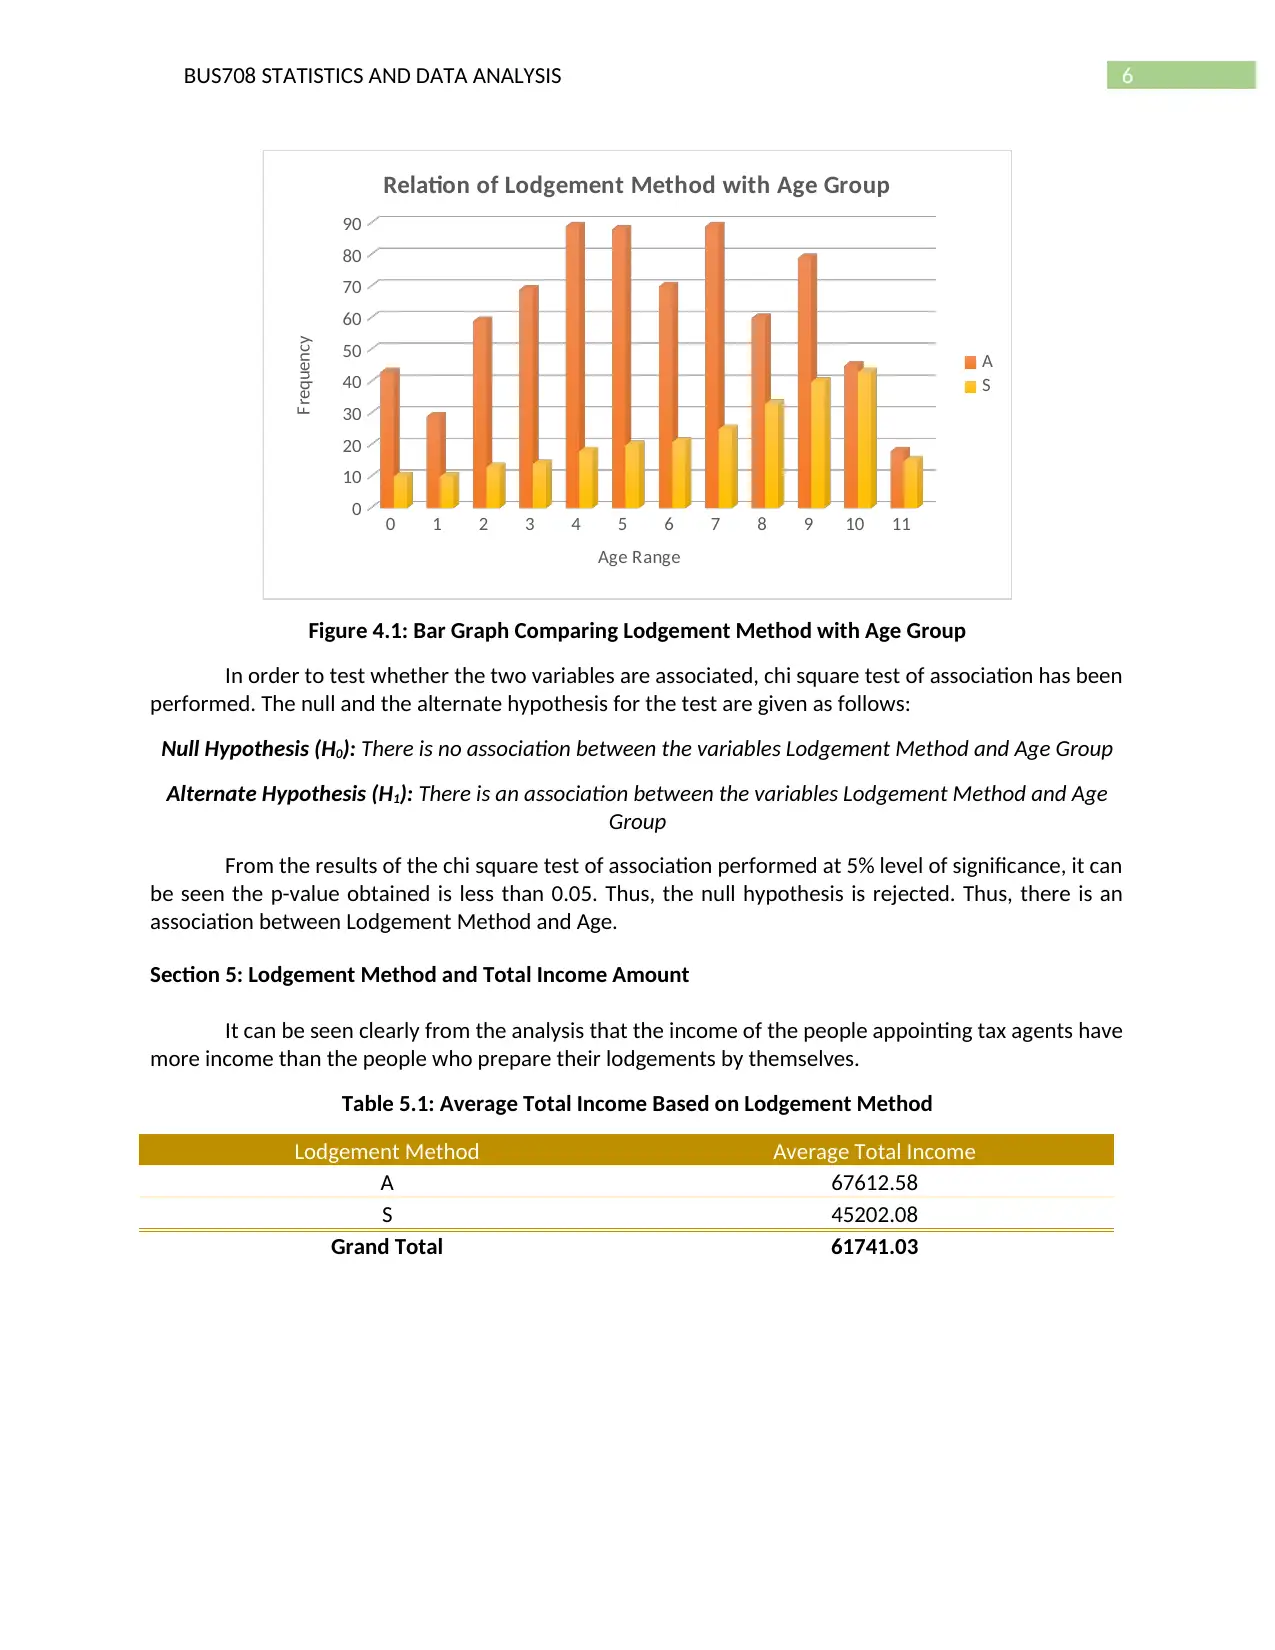
Figure 4.1: Bar Graph Comparing Lodgement Method with Age Group
In order to test whether the two variables are associated, chi square test of association has been
performed. The null and the alternate hypothesis for the test are given as follows:
Null Hypothesis (H0): There is no association between the variables Lodgement Method and Age Group
Alternate Hypothesis (H1): There is an association between the variables Lodgement Method and Age
Group
From the results of the chi square test of association performed at 5% level of significance, it can
be seen the p-value obtained is less than 0.05. Thus, the null hypothesis is rejected. Thus, there is an
association between Lodgement Method and Age.
Section 5: Lodgement Method and Total Income Amount
It can be seen clearly from the analysis that the income of the people appointing tax agents have
more income than the people who prepare their lodgements by themselves.
Table 5.1: Average Total Income Based on Lodgement Method
Lodgement Method Average Total Income
A 67612.58
S 45202.08
Grand Total 61741.03
0 1 2 3 4 5 6 7 8 9 10 11
0
10
20
30
40
50
60
70
80
90
Relation of Lodgement Method with Age Group
A
S
Age Range
Frequency
Figure 4.1: Bar Graph Comparing Lodgement Method with Age Group
In order to test whether the two variables are associated, chi square test of association has been
performed. The null and the alternate hypothesis for the test are given as follows:
Null Hypothesis (H0): There is no association between the variables Lodgement Method and Age Group
Alternate Hypothesis (H1): There is an association between the variables Lodgement Method and Age
Group
From the results of the chi square test of association performed at 5% level of significance, it can
be seen the p-value obtained is less than 0.05. Thus, the null hypothesis is rejected. Thus, there is an
association between Lodgement Method and Age.
Section 5: Lodgement Method and Total Income Amount
It can be seen clearly from the analysis that the income of the people appointing tax agents have
more income than the people who prepare their lodgements by themselves.
Table 5.1: Average Total Income Based on Lodgement Method
Lodgement Method Average Total Income
A 67612.58
S 45202.08
Grand Total 61741.03
Paraphrase This Document
Need a fresh take? Get an instant paraphrase of this document with our AI Paraphraser
7BUS708 STATISTICS AND DATA ANALYSIS
A
S
0.00
10000.00
20000.00
30000.00
40000.00
50000.00
60000.00
70000.00
Average Total Income of Lodgement Method
Lodgement Method
Average Income
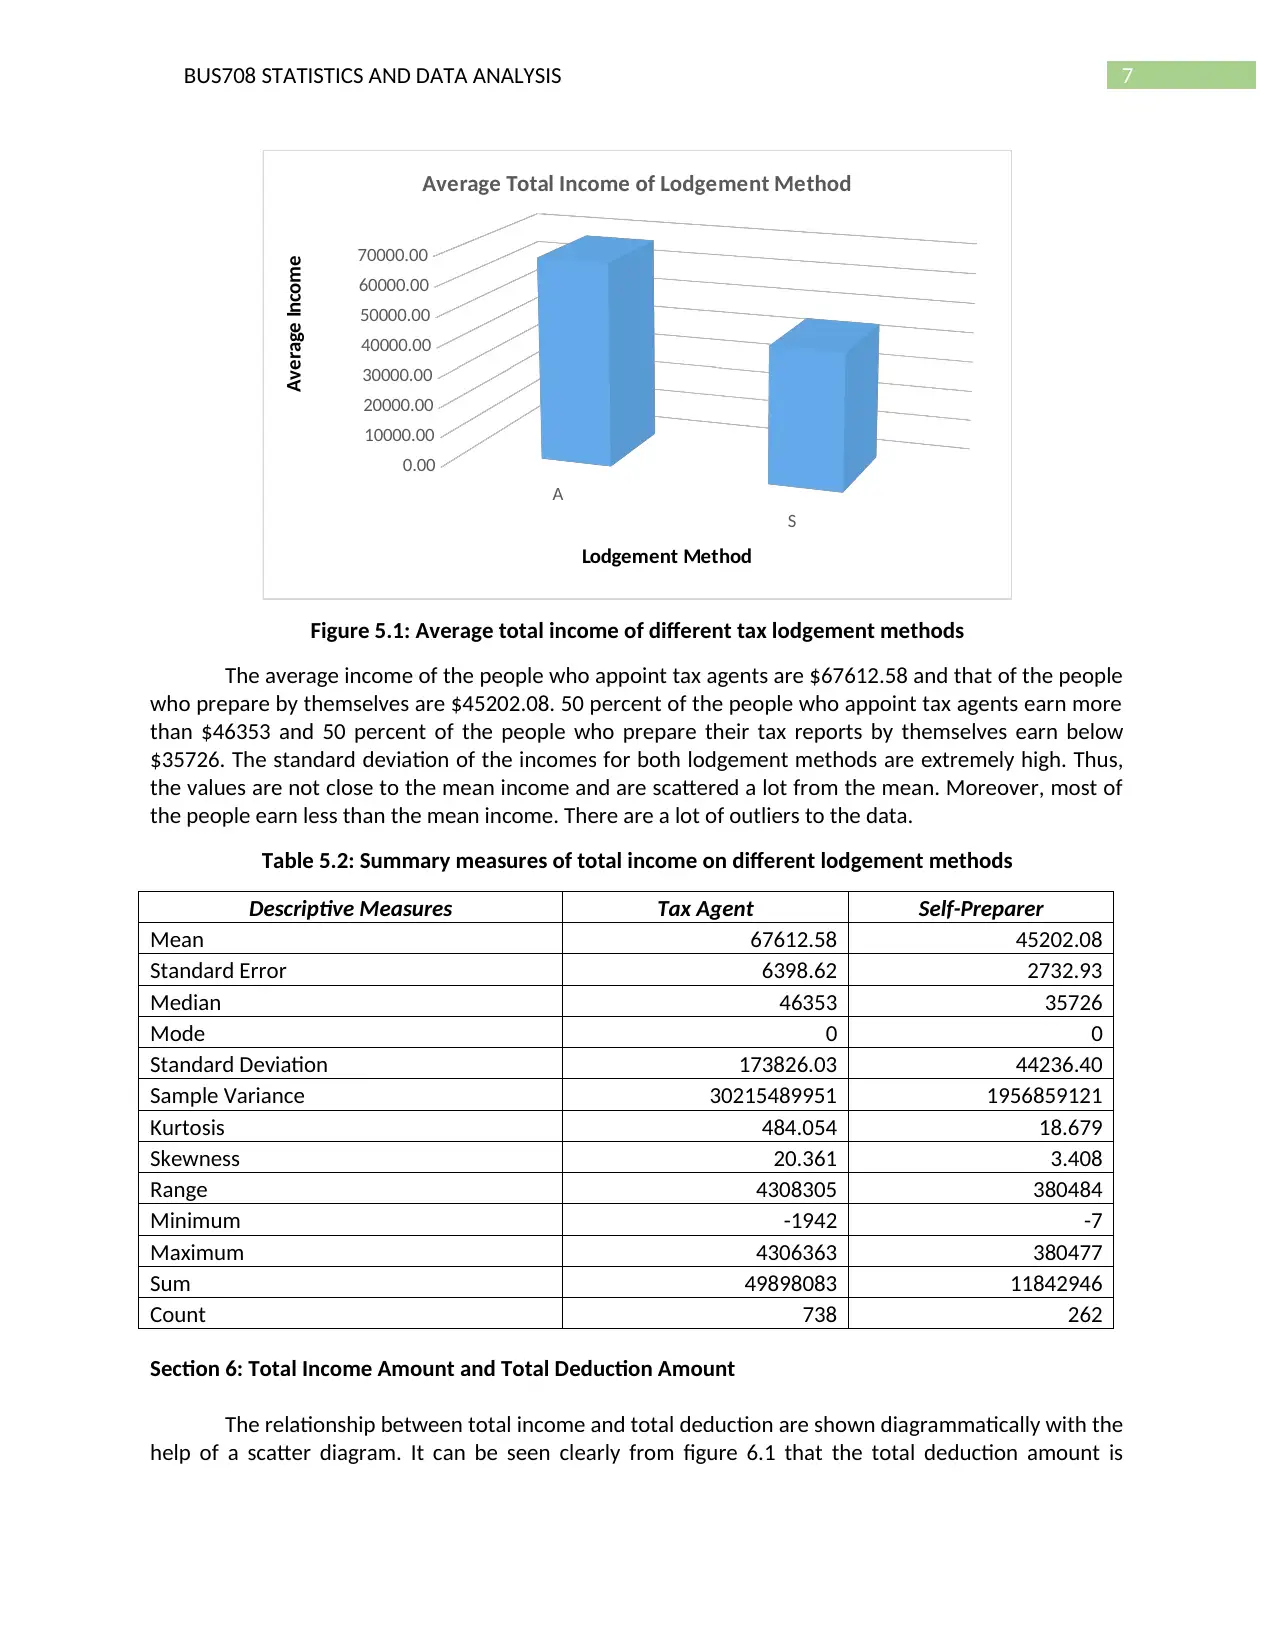
Figure 5.1: Average total income of different tax lodgement methods
The average income of the people who appoint tax agents are $67612.58 and that of the people
who prepare by themselves are $45202.08. 50 percent of the people who appoint tax agents earn more
than $46353 and 50 percent of the people who prepare their tax reports by themselves earn below
$35726. The standard deviation of the incomes for both lodgement methods are extremely high. Thus,
the values are not close to the mean income and are scattered a lot from the mean. Moreover, most of
the people earn less than the mean income. There are a lot of outliers to the data.
Table 5.2: Summary measures of total income on different lodgement methods
Descriptive Measures Tax Agent Self-Preparer
Mean 67612.58 45202.08
Standard Error 6398.62 2732.93
Median 46353 35726
Mode 0 0
Standard Deviation 173826.03 44236.40
Sample Variance 30215489951 1956859121
Kurtosis 484.054 18.679
Skewness 20.361 3.408
Range 4308305 380484
Minimum -1942 -7
Maximum 4306363 380477
Sum 49898083 11842946
Count 738 262
Section 6: Total Income Amount and Total Deduction Amount
The relationship between total income and total deduction are shown diagrammatically with the
help of a scatter diagram. It can be seen clearly from figure 6.1 that the total deduction amount is
A
S
0.00
10000.00
20000.00
30000.00
40000.00
50000.00
60000.00
70000.00
Average Total Income of Lodgement Method
Lodgement Method
Average Income
Figure 5.1: Average total income of different tax lodgement methods
The average income of the people who appoint tax agents are $67612.58 and that of the people
who prepare by themselves are $45202.08. 50 percent of the people who appoint tax agents earn more
than $46353 and 50 percent of the people who prepare their tax reports by themselves earn below
$35726. The standard deviation of the incomes for both lodgement methods are extremely high. Thus,
the values are not close to the mean income and are scattered a lot from the mean. Moreover, most of
the people earn less than the mean income. There are a lot of outliers to the data.
Table 5.2: Summary measures of total income on different lodgement methods
Descriptive Measures Tax Agent Self-Preparer
Mean 67612.58 45202.08
Standard Error 6398.62 2732.93
Median 46353 35726
Mode 0 0
Standard Deviation 173826.03 44236.40
Sample Variance 30215489951 1956859121
Kurtosis 484.054 18.679
Skewness 20.361 3.408
Range 4308305 380484
Minimum -1942 -7
Maximum 4306363 380477
Sum 49898083 11842946
Count 738 262
Section 6: Total Income Amount and Total Deduction Amount
The relationship between total income and total deduction are shown diagrammatically with the
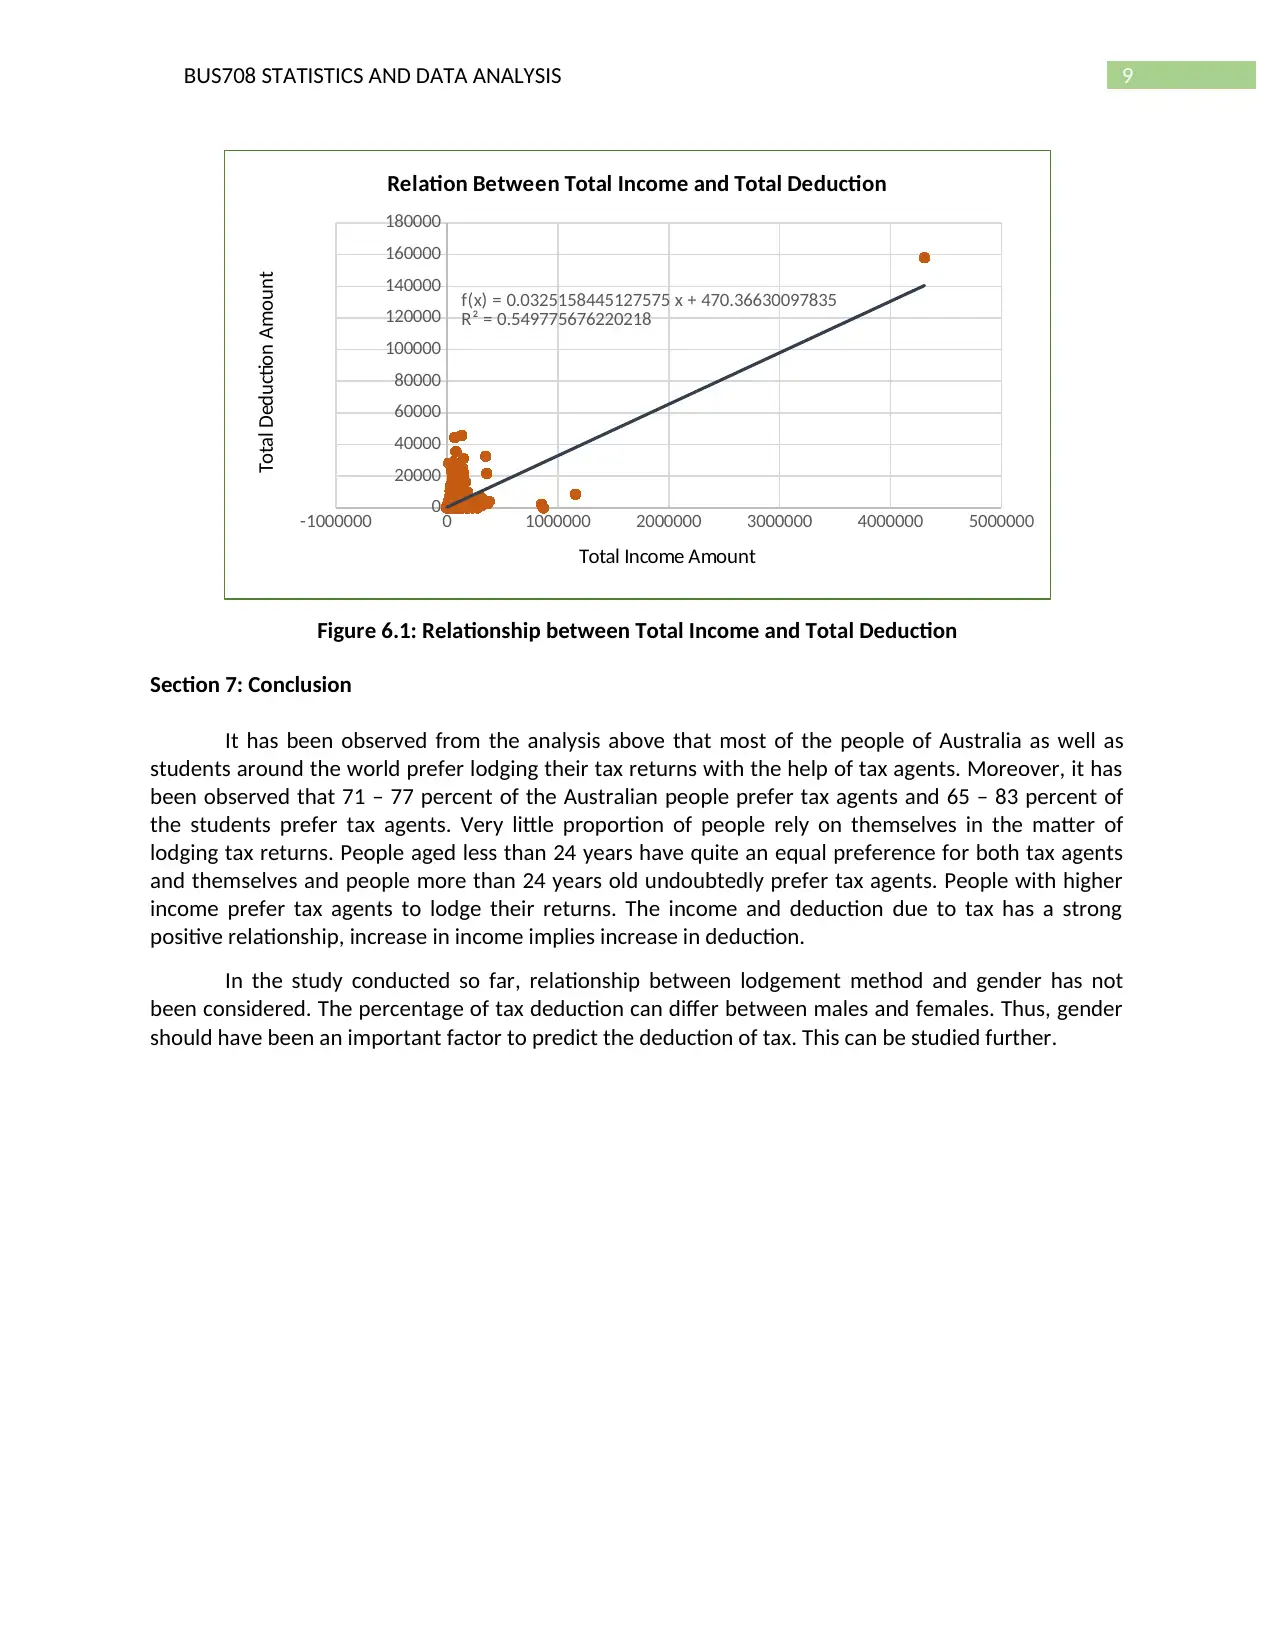
help of a scatter diagram. It can be seen clearly from figure 6.1 that the total deduction amount is
8BUS708 STATISTICS AND DATA ANALYSIS
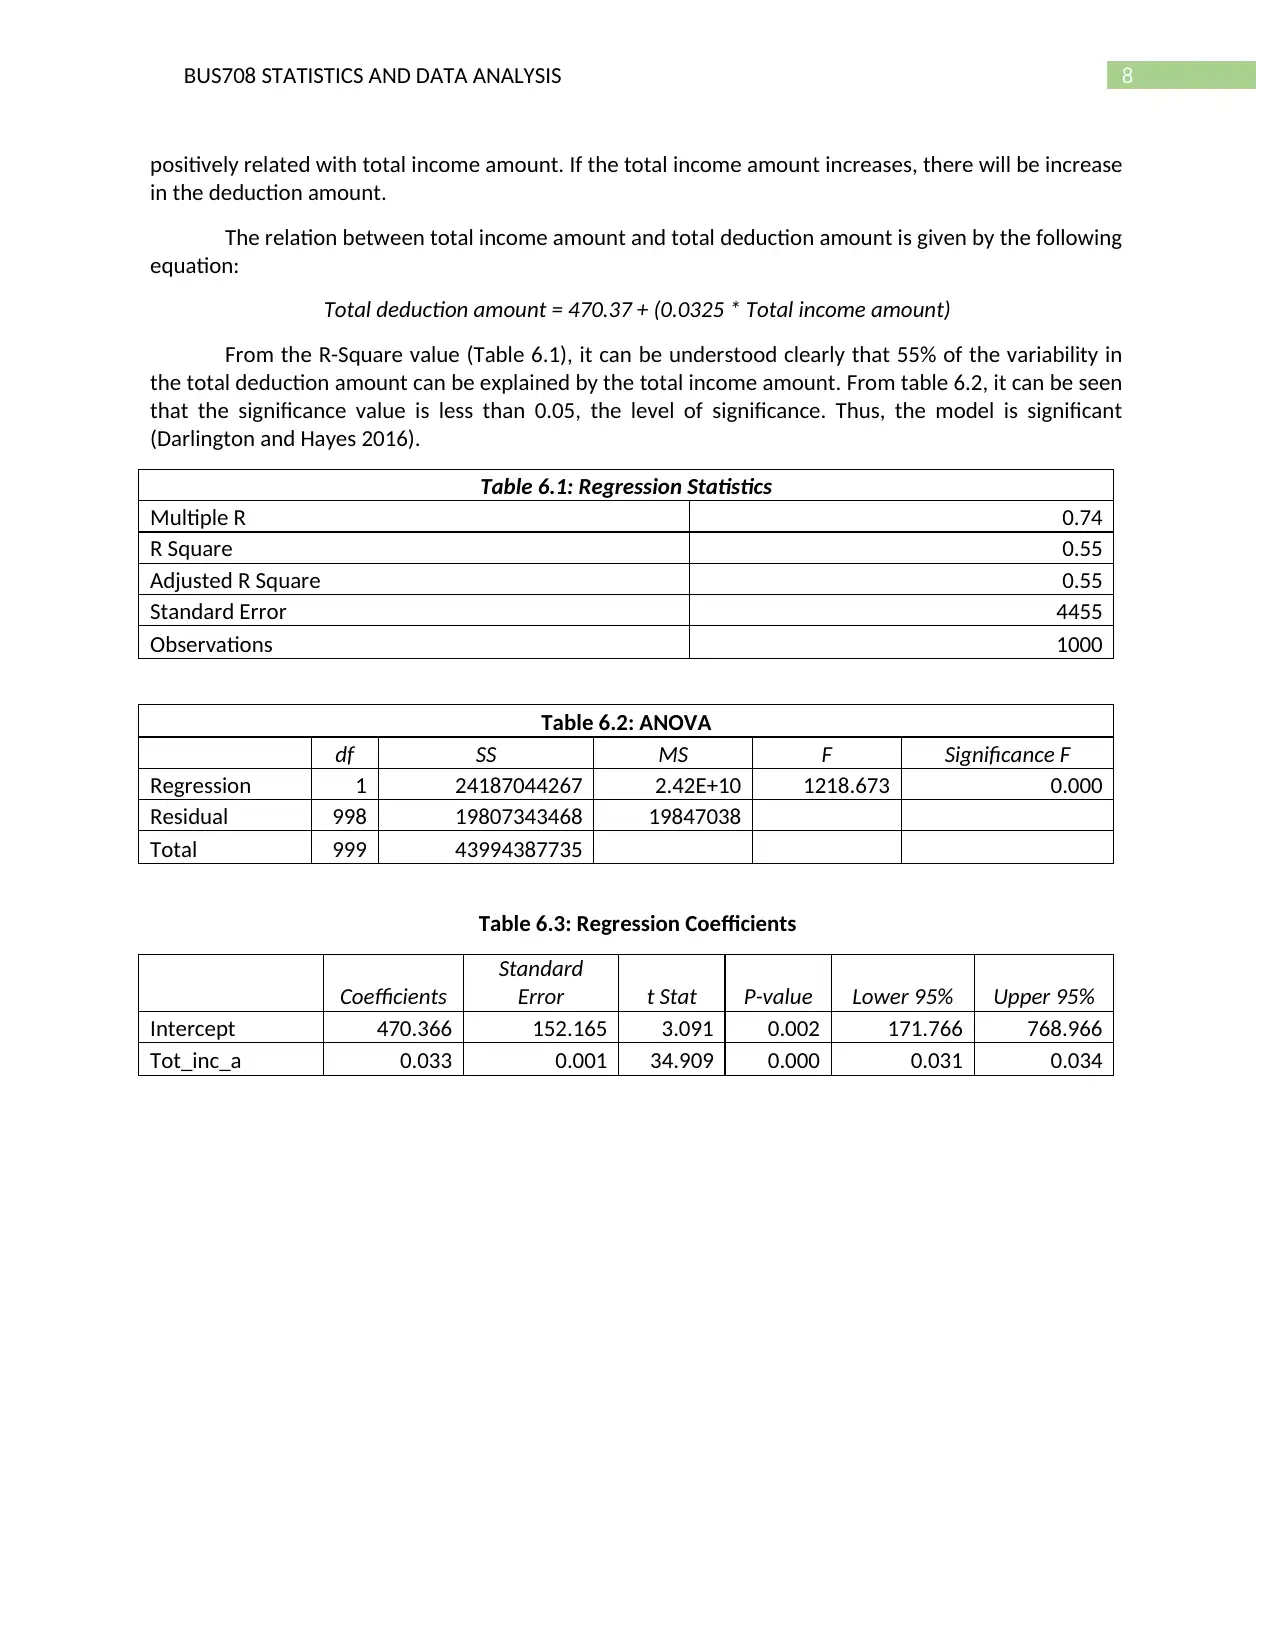
positively related with total income amount. If the total income amount increases, there will be increase
in the deduction amount.
The relation between total income amount and total deduction amount is given by the following
equation:
Total deduction amount = 470.37 + (0.0325 * Total income amount)
From the R-Square value (Table 6.1), it can be understood clearly that 55% of the variability in
the total deduction amount can be explained by the total income amount. From table 6.2, it can be seen
that the significance value is less than 0.05, the level of significance. Thus, the model is significant
(Darlington and Hayes 2016).
Table 6.1: Regression Statistics
Multiple R 0.74
R Square 0.55
Adjusted R Square 0.55
Standard Error 4455
Observations 1000
Table 6.2: ANOVA
df SS MS F Significance F
Regression 1 24187044267 2.42E+10 1218.673 0.000
Residual 998 19807343468 19847038
Total 999 43994387735
Table 6.3: Regression Coefficients
Coefficients
Standard
Error t Stat P-value Lower 95% Upper 95%
Intercept 470.366 152.165 3.091 0.002 171.766 768.966
Tot_inc_a 0.033 0.001 34.909 0.000 0.031 0.034
⊘ This is a preview!⊘
Do you want full access?
Subscribe today to unlock all pages.
Trusted by 1+ million students worldwide
9BUS708 STATISTICS AND DATA ANALYSIS
-1000000 0 1000000 2000000 3000000 4000000 5000000
0
20000
40000
60000
80000
100000
120000
140000
160000
180000
f(x) = 0.0325158445127575 x + 470.36630097835
R² = 0.549775676220218
Relation Between Total Income and Total Deduction
Total Income Amount
Total Deduction Amount
Figure 6.1: Relationship between Total Income and Total Deduction
Section 7: Conclusion
It has been observed from the analysis above that most of the people of Australia as well as
students around the world prefer lodging their tax returns with the help of tax agents. Moreover, it has
been observed that 71 – 77 percent of the Australian people prefer tax agents and 65 – 83 percent of
the students prefer tax agents. Very little proportion of people rely on themselves in the matter of
lodging tax returns. People aged less than 24 years have quite an equal preference for both tax agents
and themselves and people more than 24 years old undoubtedly prefer tax agents. People with higher
income prefer tax agents to lodge their returns. The income and deduction due to tax has a strong
positive relationship, increase in income implies increase in deduction.
In the study conducted so far, relationship between lodgement method and gender has not
been considered. The percentage of tax deduction can differ between males and females. Thus, gender
should have been an important factor to predict the deduction of tax. This can be studied further.
Paraphrase This Document
Need a fresh take? Get an instant paraphrase of this document with our AI Paraphraser

10BUS708 STATISTICS AND DATA ANALYSIS
References
Kennedy, T., Smyth, R., Valadkhani, A. and Chen, G., 2017. Does income inequality hinder economic
growth? New evidence using Australian taxation statistics. Economic Modelling.
Darlington, R.B. and Hayes, A.F., 2016. Regression analysis and linear models: Concepts, applications,
and implementation. Guilford Publications.
1 out of 11
Related Documents


Your All-in-One AI-Powered Toolkit for Academic Success.
+13062052269
info@desklib.com
Available 24*7 on WhatsApp / Email
![[object Object]](/_next/static/media/star-bottom.7253800d.svg)
Unlock your academic potential
Copyright © 2020–2026 A2Z Services. All Rights Reserved. Developed and managed by ZUCOL.