GIS-Based Assessment: Air Quality and Population in London's Camden
VerifiedAdded on 2023/06/16
|17
|3013
|297
Report
AI Summary
This report assesses air quality in London, particularly focusing on the borough of Camden, using a Geographic Information System (GIS) approach. It examines various factors contributing to air pollution, including road networks and underground stations, while also considering the mitigating effects of green spaces and water bodies. The analysis utilizes vector data models to map and analyze the spatial relationships between these elements and the population affected by poor air quality. The report identifies London Air Quality Focus Areas and evaluates the concentration of pollutants like nitrogen dioxide. It concludes that transport networks significantly contribute to air pollution, impacting the health of London residents, and highlights the limitations of the vector model in fully capturing the complexities of air quality analysis.
0
AIR QUALITY IN LONDON
Air Quality in London
Name of the Student:
Name of the University:
Author Note:
AIR QUALITY IN LONDON
Air Quality in London
Name of the Student:
Name of the University:
Author Note:
Paraphrase This Document
Need a fresh take? Get an instant paraphrase of this document with our AI Paraphraser

1
AIR QUALITY IN LONDON
Table of Contents
1. Introduction:...........................................................................................................................1
2. List of data used and description:...........................................................................................1
1. Administrative Boundary:..................................................................................................1
2. Road network:....................................................................................................................3
3. Underground stations in London:.......................................................................................4
4. Green spaces:.....................................................................................................................4
5. Water area in London:........................................................................................................5
6. Population of Camden:.......................................................................................................6
7. Geoprocessing operations in Cambria...............................................................................7
8. Number of people affected by poor air quality:.................................................................7
a. Location and extent of London Air Quality Focus Areas:.............................................9
b. Geographical relationship between road network, underground stations, green space
and water areas.................................................................................................................10
3. Process of analysis:..............................................................................................................10
4. Conclusion:..........................................................................................................................11
References:...............................................................................................................................13
2
AIR QUALITY IN LONDON
1. Introduction:
The aim of the paper is to study the number of people suffering from poor quality of
air in London described as London Air Quality Focus Areas. The study would be
conducted from the view point of Geographical Information System or GIS. The city of
London is one of the most advanced cities in the world with a population of over 22.7
million. The city has an extensive network of transport facilities like underground railways
and motor able roads, which lead to air population. The air over London contains harmful
particles of sulphur dioxide, nitrogen dioxide and lead though less compared to many other
cities in the world. These particles are shown having detrimental impact on the health of the
people of London. More than three fourths of the incidences of cardiovascular diseases were
associated with this pollution (london.gov.uk 2017). This seriousness of the matter make the
study of population in London coming under the influence of air pollution pertinent. The
paper would start with the data collected about the population from reliable secondary
sources like the London Data Store under the owner of the Government of the United
Kingdom. The next section would delve into relevant data collected on the topic followed by
a description of the process of analysis.
2. List of data used and description:
The following section would explore the data collected about the air pollution in
London.
1. Administrative Boundary:
The administrative area of the local government of London is 1572 km square, which
fall within the geographical area of London. The administration of the city of London is
divided into three tiers namely, union governments and local government. London is the seat
⊘ This is a preview!⊘
Do you want full access?
Subscribe today to unlock all pages.
Trusted by 1+ million students worldwide
3
AIR QUALITY IN LONDON
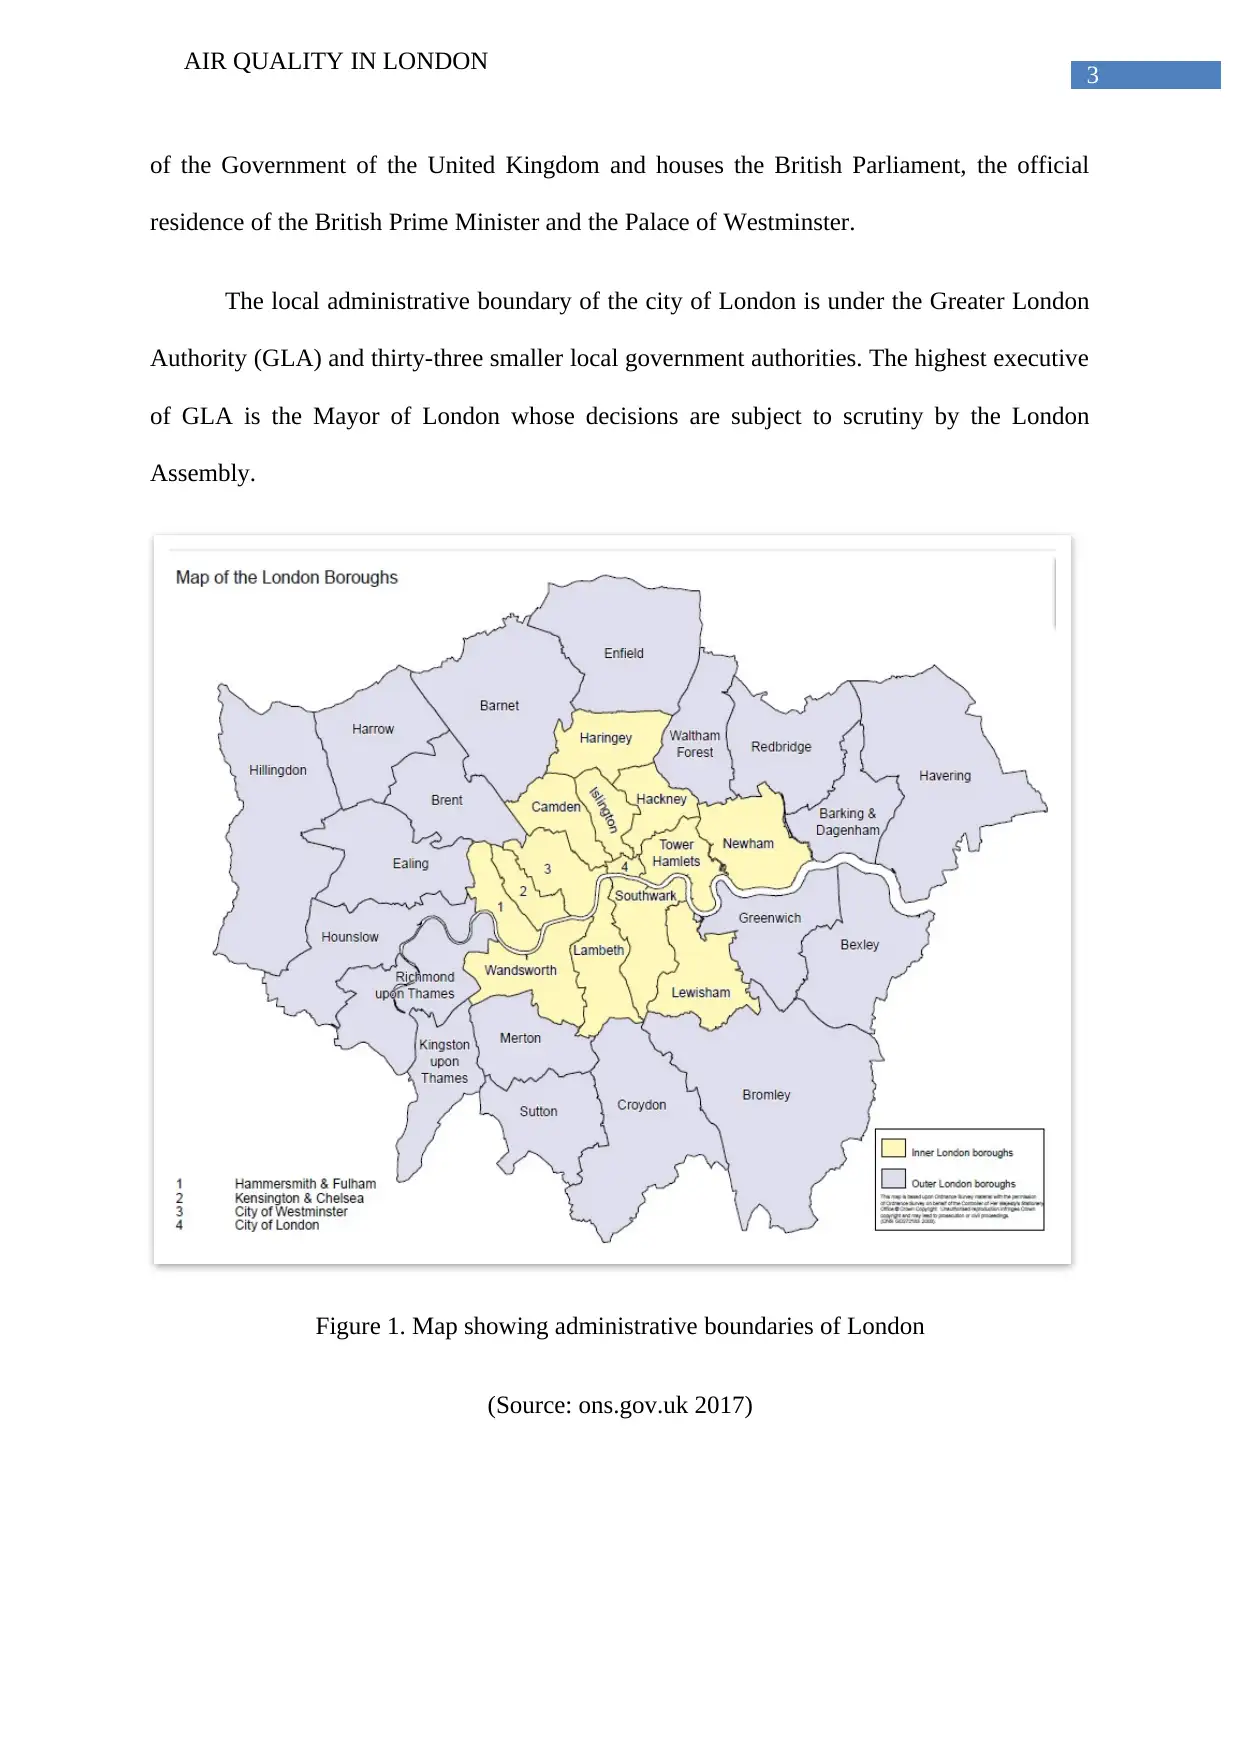
of the Government of the United Kingdom and houses the British Parliament, the official
residence of the British Prime Minister and the Palace of Westminster.
The local administrative boundary of the city of London is under the Greater London
Authority (GLA) and thirty-three smaller local government authorities. The highest executive
of GLA is the Mayor of London whose decisions are subject to scrutiny by the London
Assembly.
Figure 1. Map showing administrative boundaries of London
(Source: ons.gov.uk 2017)
AIR QUALITY IN LONDON
of the Government of the United Kingdom and houses the British Parliament, the official
residence of the British Prime Minister and the Palace of Westminster.
The local administrative boundary of the city of London is under the Greater London
Authority (GLA) and thirty-three smaller local government authorities. The highest executive
of GLA is the Mayor of London whose decisions are subject to scrutiny by the London
Assembly.
Figure 1. Map showing administrative boundaries of London
(Source: ons.gov.uk 2017)
Paraphrase This Document
Need a fresh take? Get an instant paraphrase of this document with our AI Paraphraser
4
AIR QUALITY IN LONDON
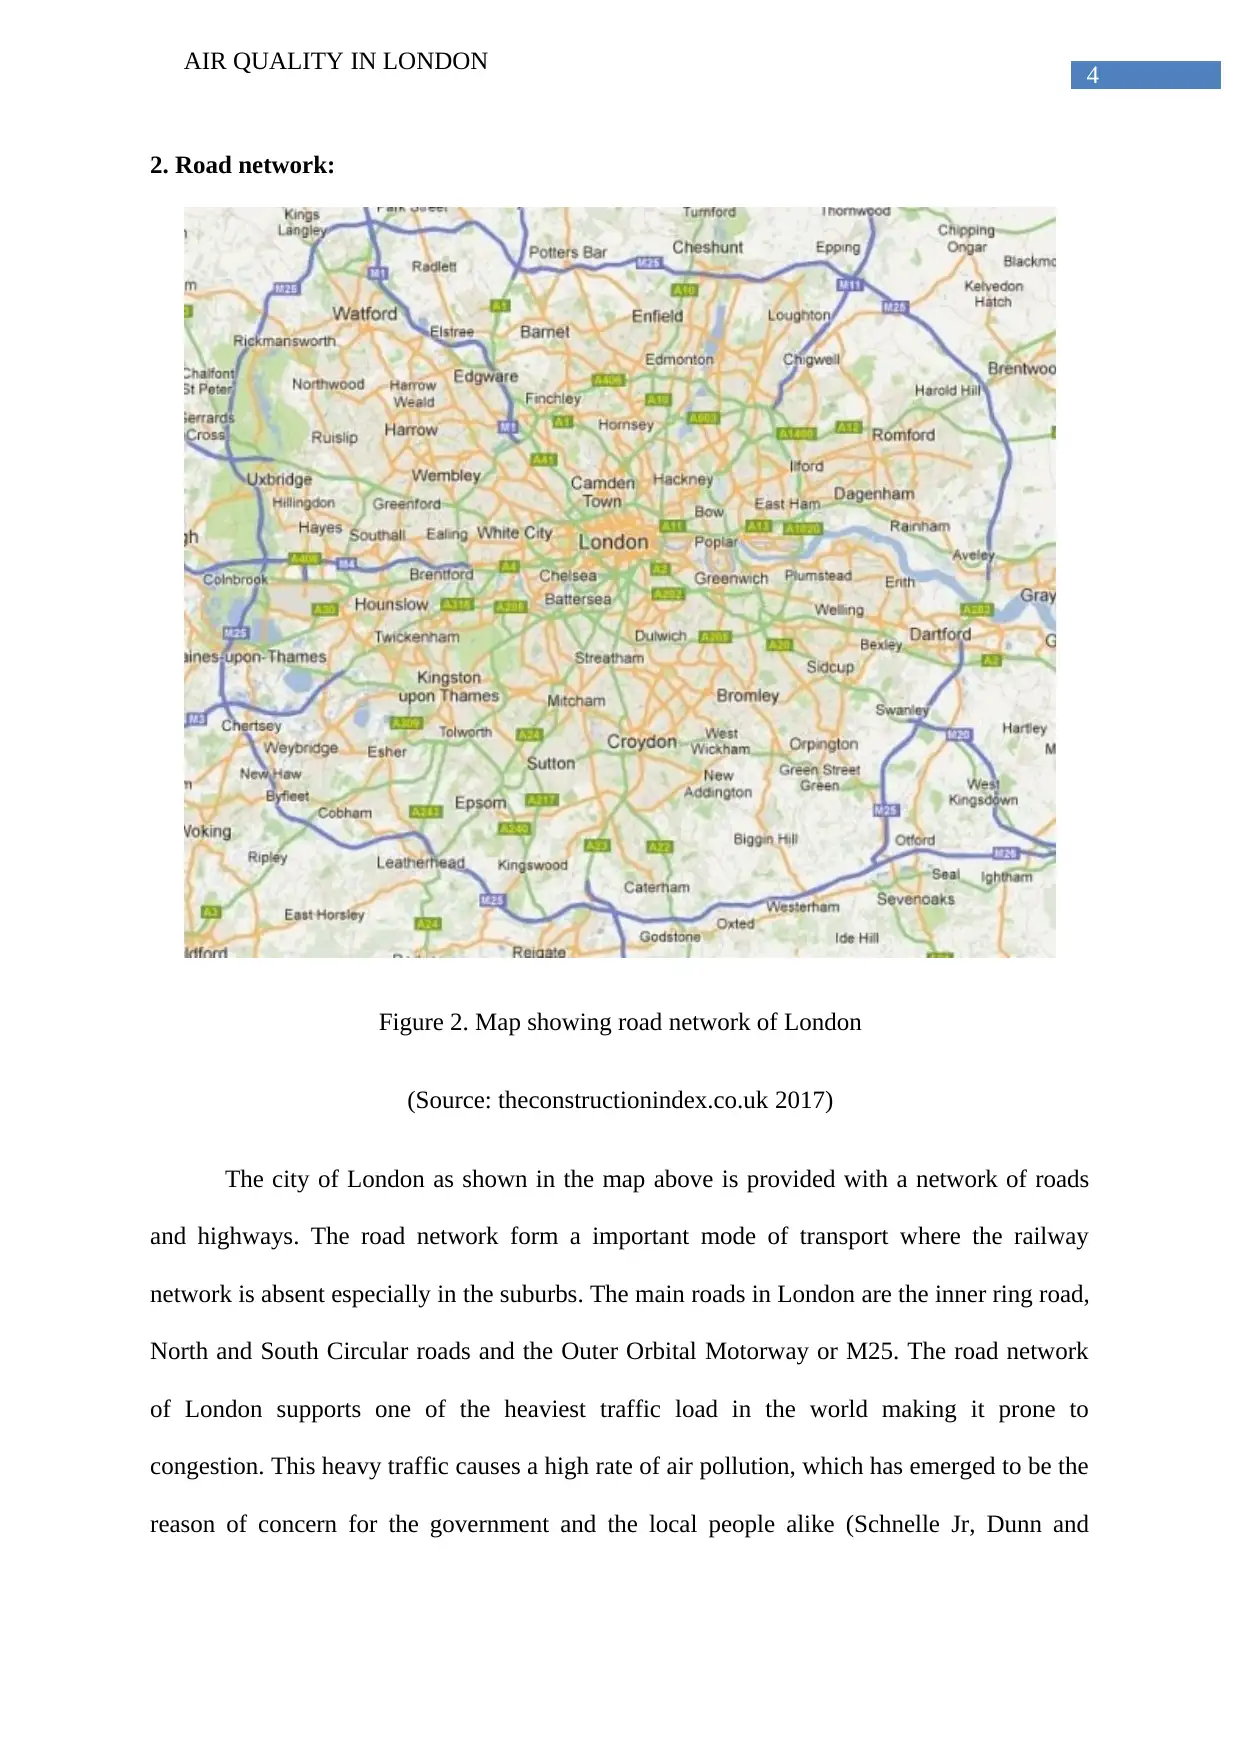
2. Road network:
Figure 2. Map showing road network of London
(Source: theconstructionindex.co.uk 2017)
The city of London as shown in the map above is provided with a network of roads
and highways. The road network form a important mode of transport where the railway
network is absent especially in the suburbs. The main roads in London are the inner ring road,
North and South Circular roads and the Outer Orbital Motorway or M25. The road network
of London supports one of the heaviest traffic load in the world making it prone to
congestion. This heavy traffic causes a high rate of air pollution, which has emerged to be the
reason of concern for the government and the local people alike (Schnelle Jr, Dunn and
AIR QUALITY IN LONDON
2. Road network:
Figure 2. Map showing road network of London
(Source: theconstructionindex.co.uk 2017)
The city of London as shown in the map above is provided with a network of roads
and highways. The road network form a important mode of transport where the railway
network is absent especially in the suburbs. The main roads in London are the inner ring road,
North and South Circular roads and the Outer Orbital Motorway or M25. The road network
of London supports one of the heaviest traffic load in the world making it prone to
congestion. This heavy traffic causes a high rate of air pollution, which has emerged to be the
reason of concern for the government and the local people alike (Schnelle Jr, Dunn and
5
AIR QUALITY IN LONDON
Ternes 2015). This high rate of air pollution and its harmful effects on the people have made
it pertinent to study in the paper.
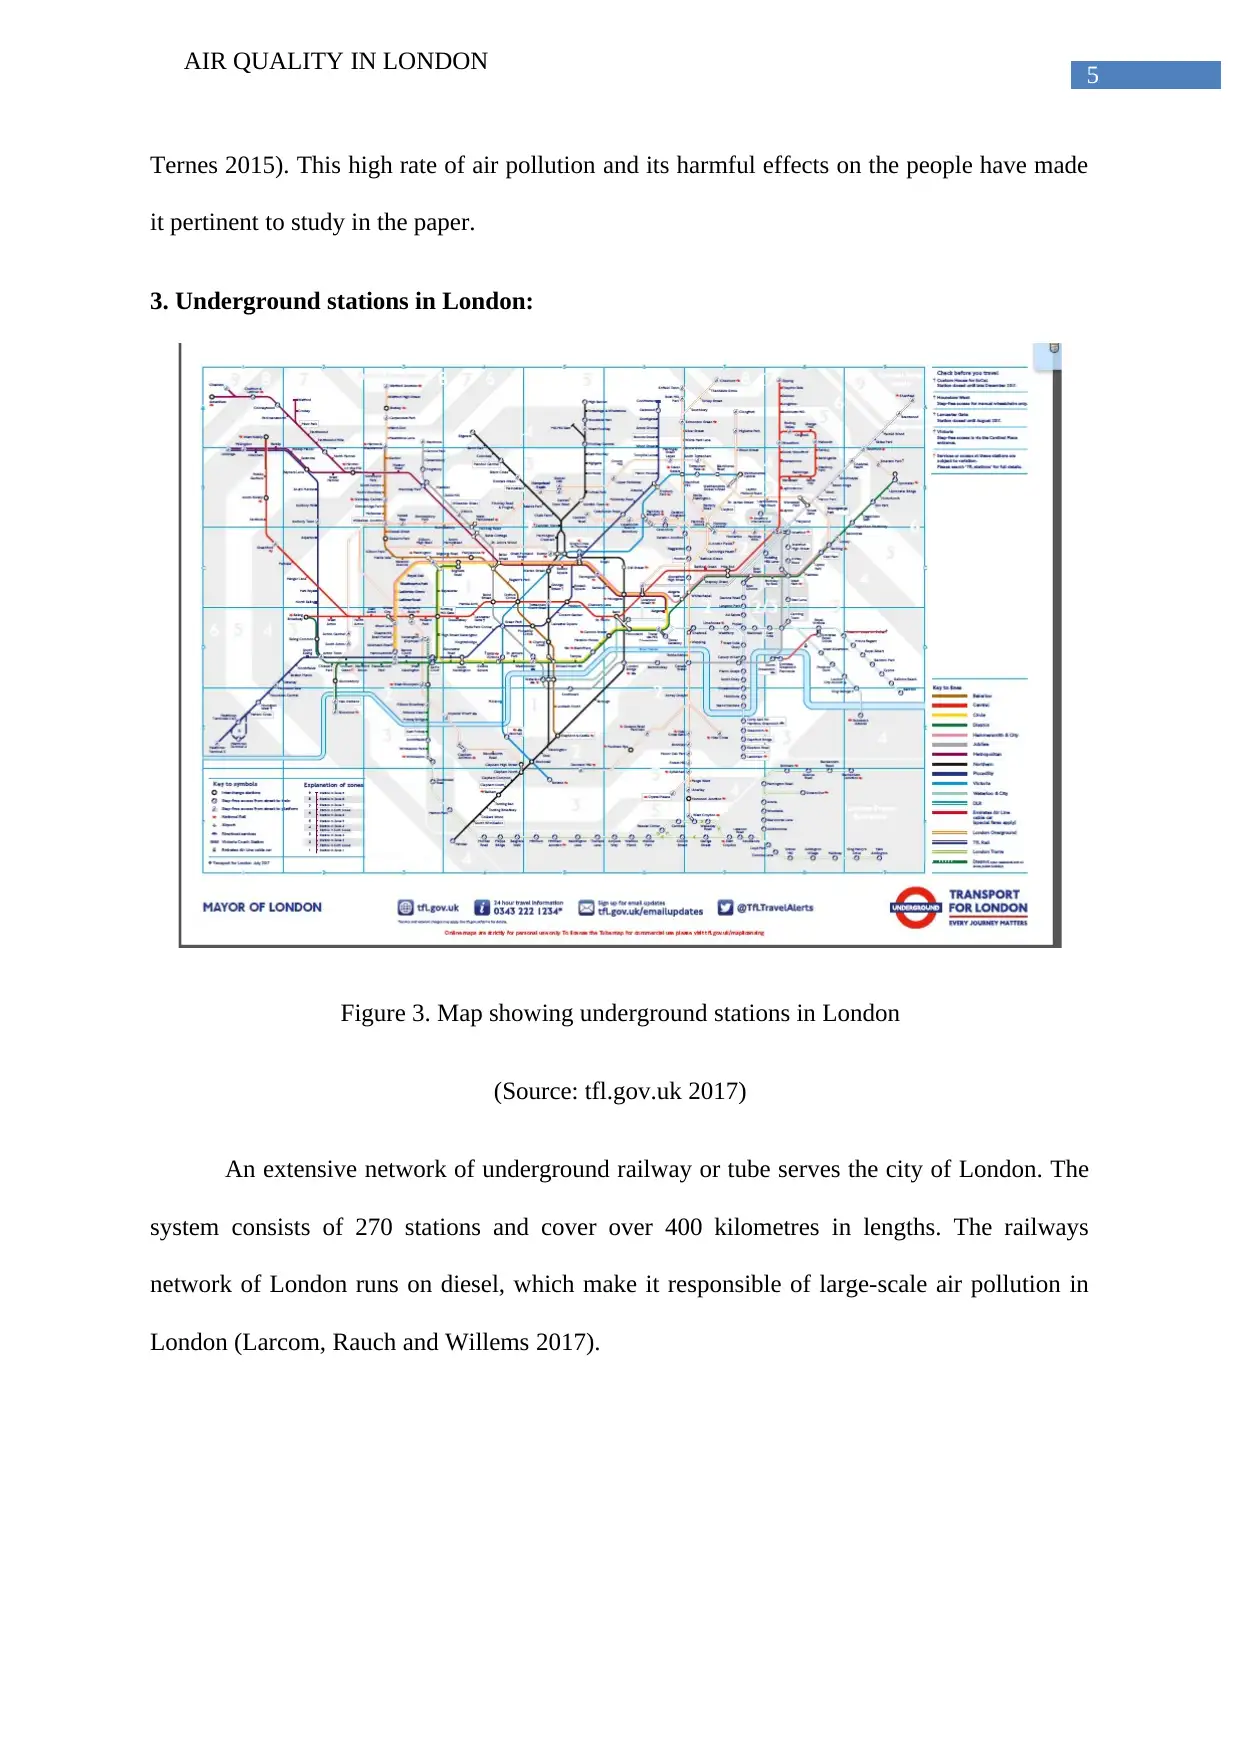
3. Underground stations in London:
Figure 3. Map showing underground stations in London
(Source: tfl.gov.uk 2017)
An extensive network of underground railway or tube serves the city of London. The
system consists of 270 stations and cover over 400 kilometres in lengths. The railways
network of London runs on diesel, which make it responsible of large-scale air pollution in
London (Larcom, Rauch and Willems 2017).
AIR QUALITY IN LONDON
Ternes 2015). This high rate of air pollution and its harmful effects on the people have made
it pertinent to study in the paper.
3. Underground stations in London:
Figure 3. Map showing underground stations in London
(Source: tfl.gov.uk 2017)
An extensive network of underground railway or tube serves the city of London. The
system consists of 270 stations and cover over 400 kilometres in lengths. The railways
network of London runs on diesel, which make it responsible of large-scale air pollution in
London (Larcom, Rauch and Willems 2017).
⊘ This is a preview!⊘
Do you want full access?
Subscribe today to unlock all pages.
Trusted by 1+ million students worldwide
6
AIR QUALITY IN LONDON
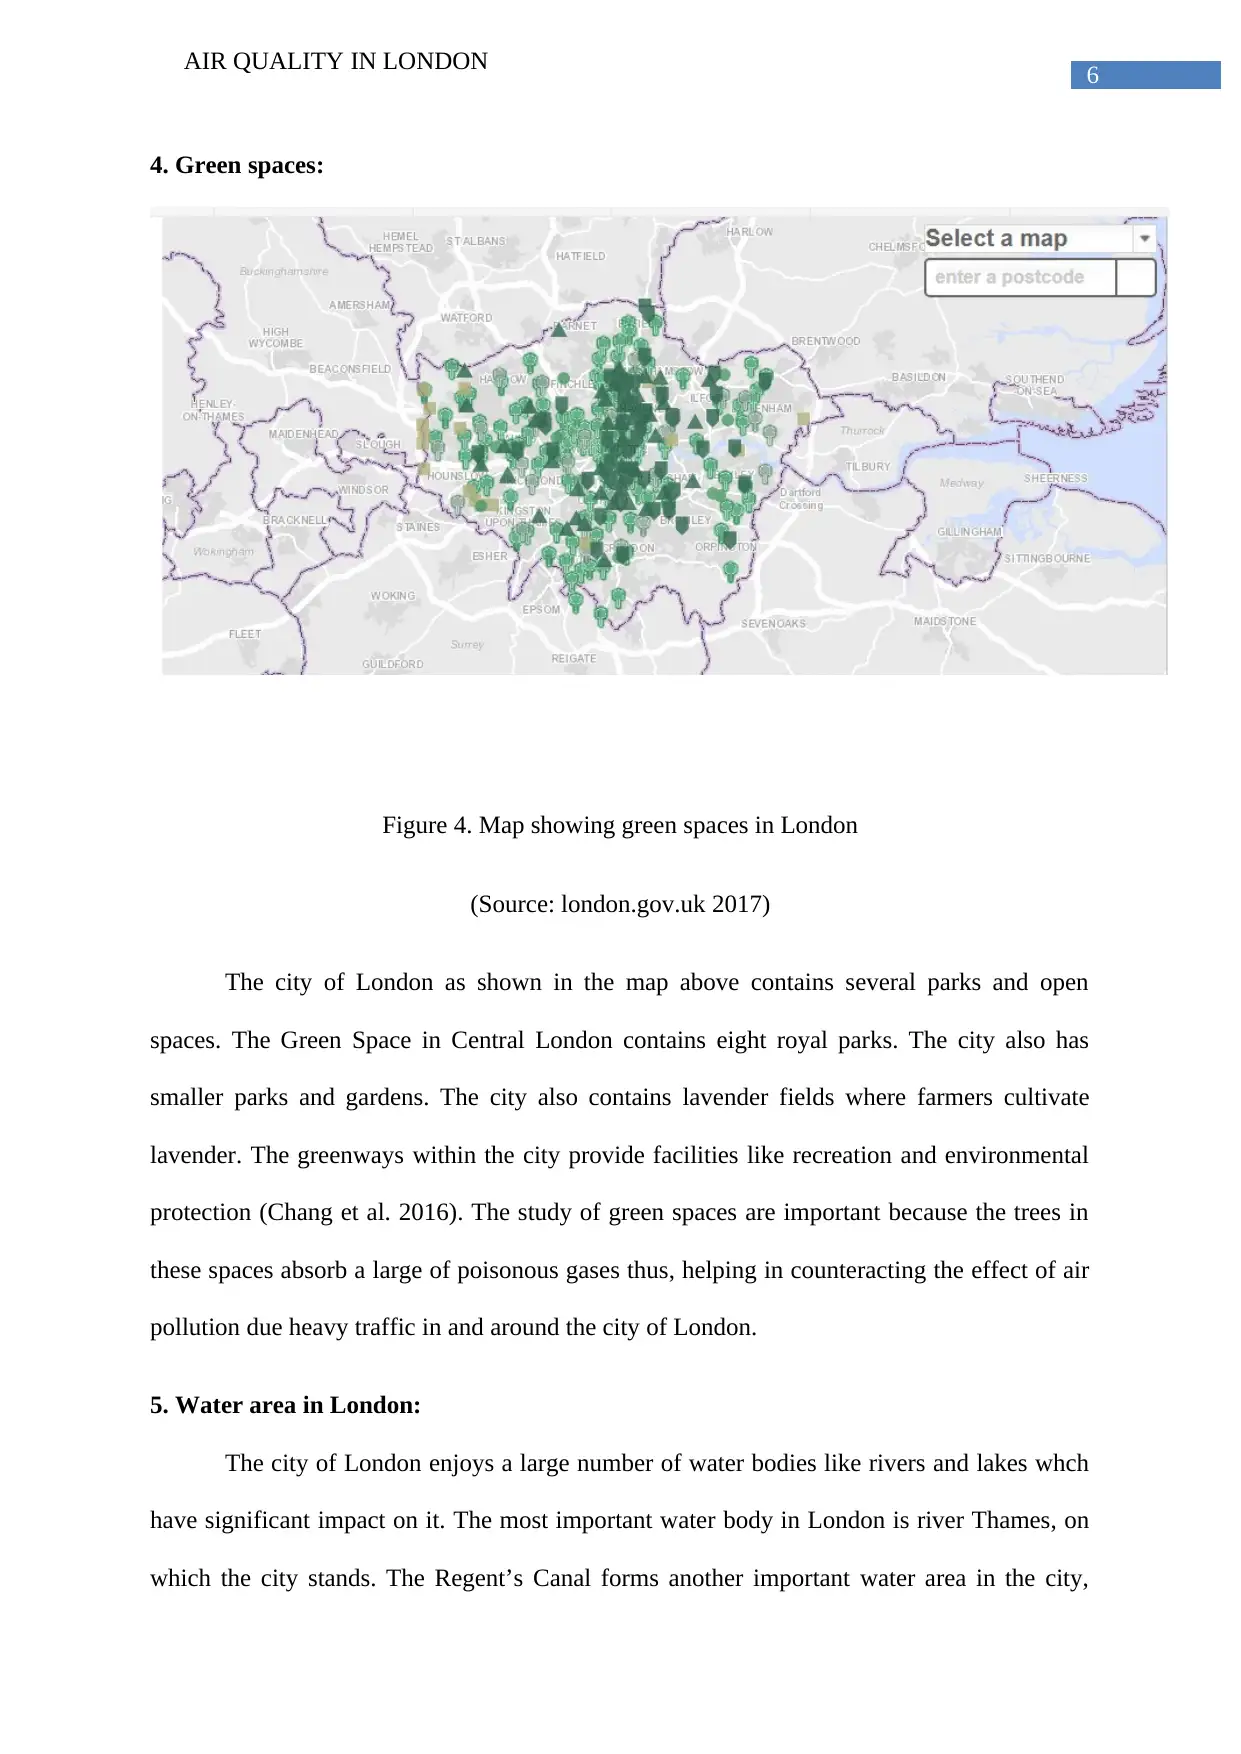
4. Green spaces:
Figure 4. Map showing green spaces in London
(Source: london.gov.uk 2017)
The city of London as shown in the map above contains several parks and open
spaces. The Green Space in Central London contains eight royal parks. The city also has
smaller parks and gardens. The city also contains lavender fields where farmers cultivate
lavender. The greenways within the city provide facilities like recreation and environmental
protection (Chang et al. 2016). The study of green spaces are important because the trees in
these spaces absorb a large of poisonous gases thus, helping in counteracting the effect of air
pollution due heavy traffic in and around the city of London.
5. Water area in London:
The city of London enjoys a large number of water bodies like rivers and lakes whch
have significant impact on it. The most important water body in London is river Thames, on
which the city stands. The Regent’s Canal forms another important water area in the city,
AIR QUALITY IN LONDON
4. Green spaces:
Figure 4. Map showing green spaces in London
(Source: london.gov.uk 2017)
The city of London as shown in the map above contains several parks and open
spaces. The Green Space in Central London contains eight royal parks. The city also has
smaller parks and gardens. The city also contains lavender fields where farmers cultivate
lavender. The greenways within the city provide facilities like recreation and environmental
protection (Chang et al. 2016). The study of green spaces are important because the trees in
these spaces absorb a large of poisonous gases thus, helping in counteracting the effect of air
pollution due heavy traffic in and around the city of London.
5. Water area in London:
The city of London enjoys a large number of water bodies like rivers and lakes whch
have significant impact on it. The most important water body in London is river Thames, on
which the city stands. The Regent’s Canal forms another important water area in the city,
Paraphrase This Document
Need a fresh take? Get an instant paraphrase of this document with our AI Paraphraser
7
AIR QUALITY IN LONDON
which provides transport and recreational facilities. The city also has a number of lakes like
the Tooting Common and the Serpentine Boating Lake (Hipps et al. 2014). The water bodies
of London are surrounded by trees and support several species of animals like frogs and
fishes. The trees these water bodies support give out oxygen and absorb harmful gases. This
makes these water bodies important to environment related studies like the effect of air
quality in London and its impact on the people, the present topic.
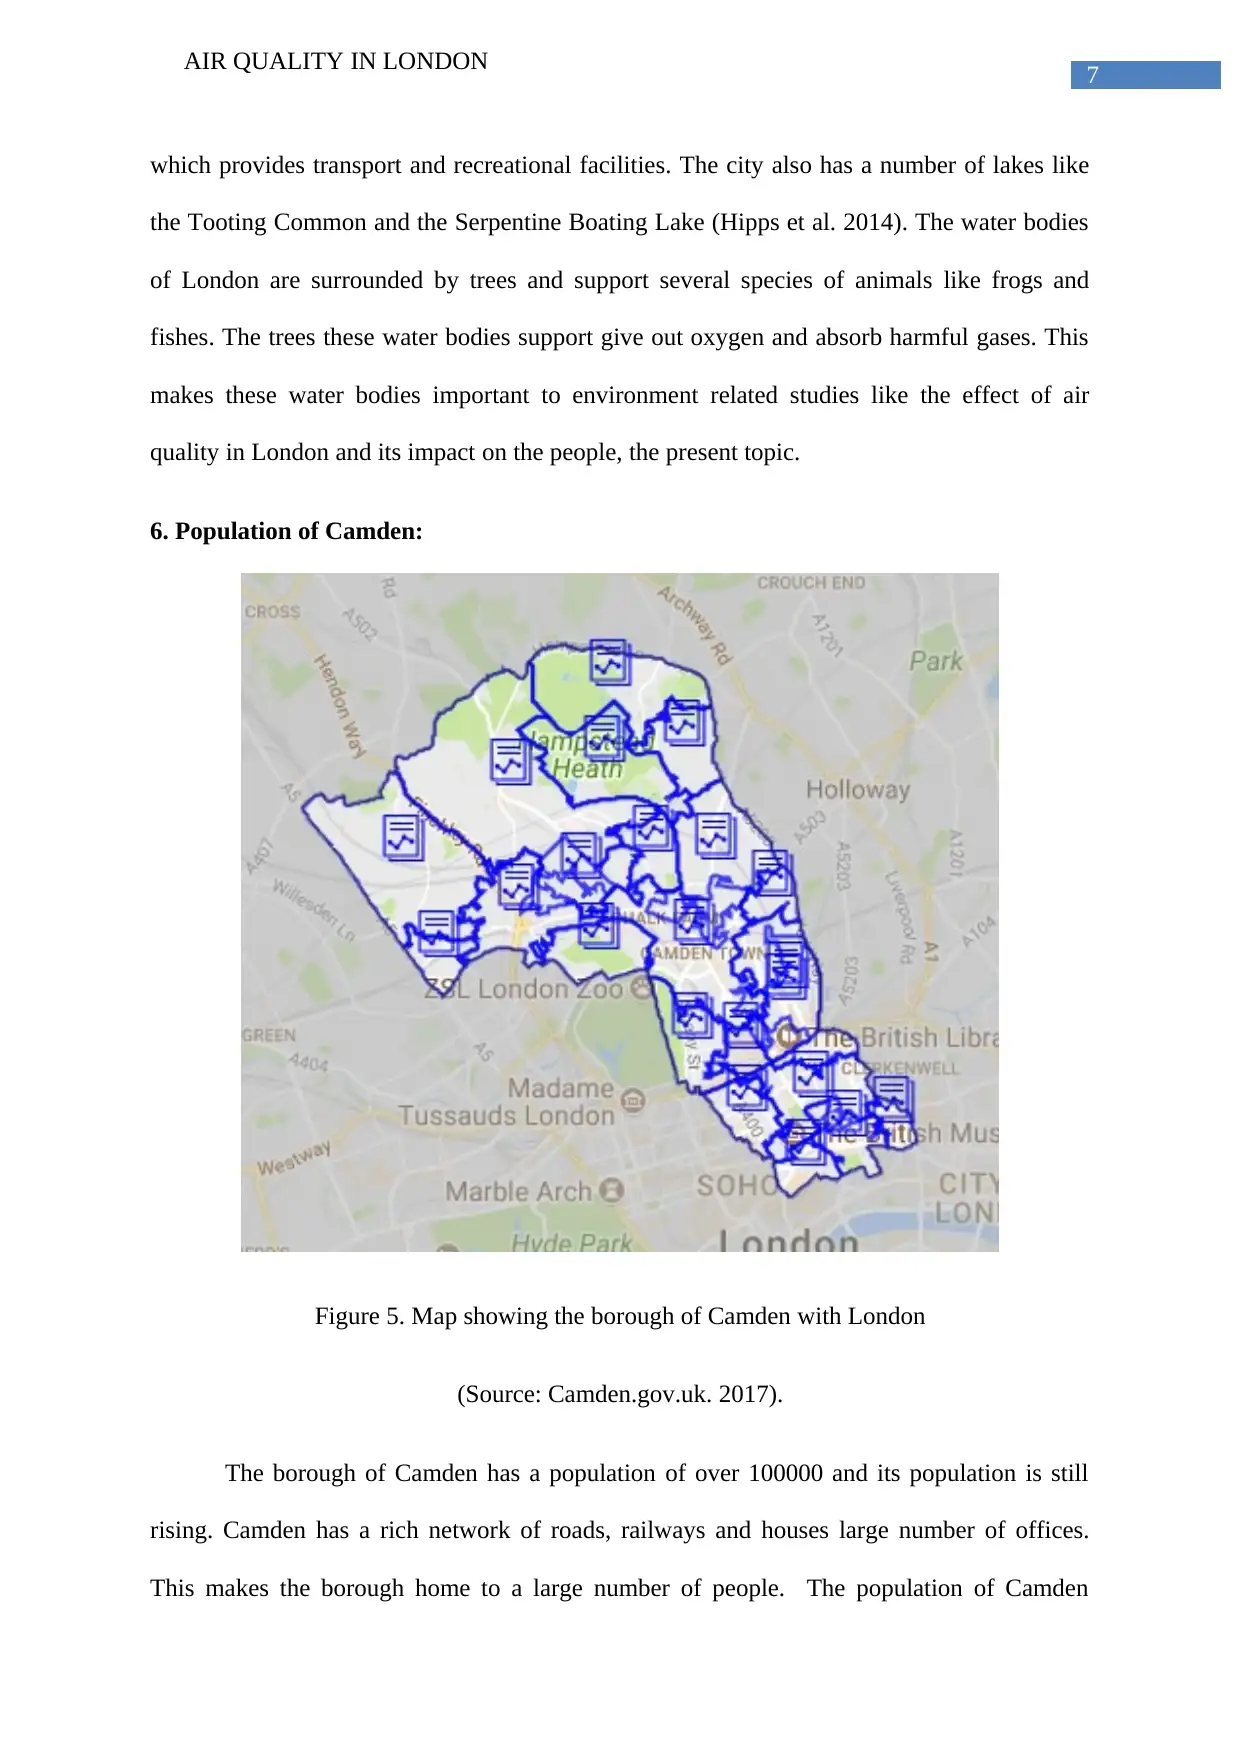
6. Population of Camden:
Figure 5. Map showing the borough of Camden with London
(Source: Camden.gov.uk. 2017).
The borough of Camden has a population of over 100000 and its population is still
rising. Camden has a rich network of roads, railways and houses large number of offices.
This makes the borough home to a large number of people. The population of Camden
AIR QUALITY IN LONDON
which provides transport and recreational facilities. The city also has a number of lakes like
the Tooting Common and the Serpentine Boating Lake (Hipps et al. 2014). The water bodies
of London are surrounded by trees and support several species of animals like frogs and
fishes. The trees these water bodies support give out oxygen and absorb harmful gases. This
makes these water bodies important to environment related studies like the effect of air
quality in London and its impact on the people, the present topic.
6. Population of Camden:
Figure 5. Map showing the borough of Camden with London
(Source: Camden.gov.uk. 2017).
The borough of Camden has a population of over 100000 and its population is still
rising. Camden has a rich network of roads, railways and houses large number of offices.
This makes the borough home to a large number of people. The population of Camden
8
AIR QUALITY IN LONDON
consist of rich upper class people, middle class and the lower class people living in the slums.
The population of Camden consists of British, Irish and immigrants. The main immigrants
residing Camden are the Asians mainly from India and China, Africans and North Americans
(Kanzaria and Hoffman 2017). The main religious groups staying in Camden are Christians,
Hindus, Islam and Buddhists.
7. Geoprocessing operations in Cambria
The geoprocessinng operations of Camden consist of collecting set of data and
performing experiments on the data to gain a desired outcome. The desired outcome in this
case consists of finding the number of people in Cambria suffering due to air pollution in the
city.
8. Number of people affected by poor air quality:
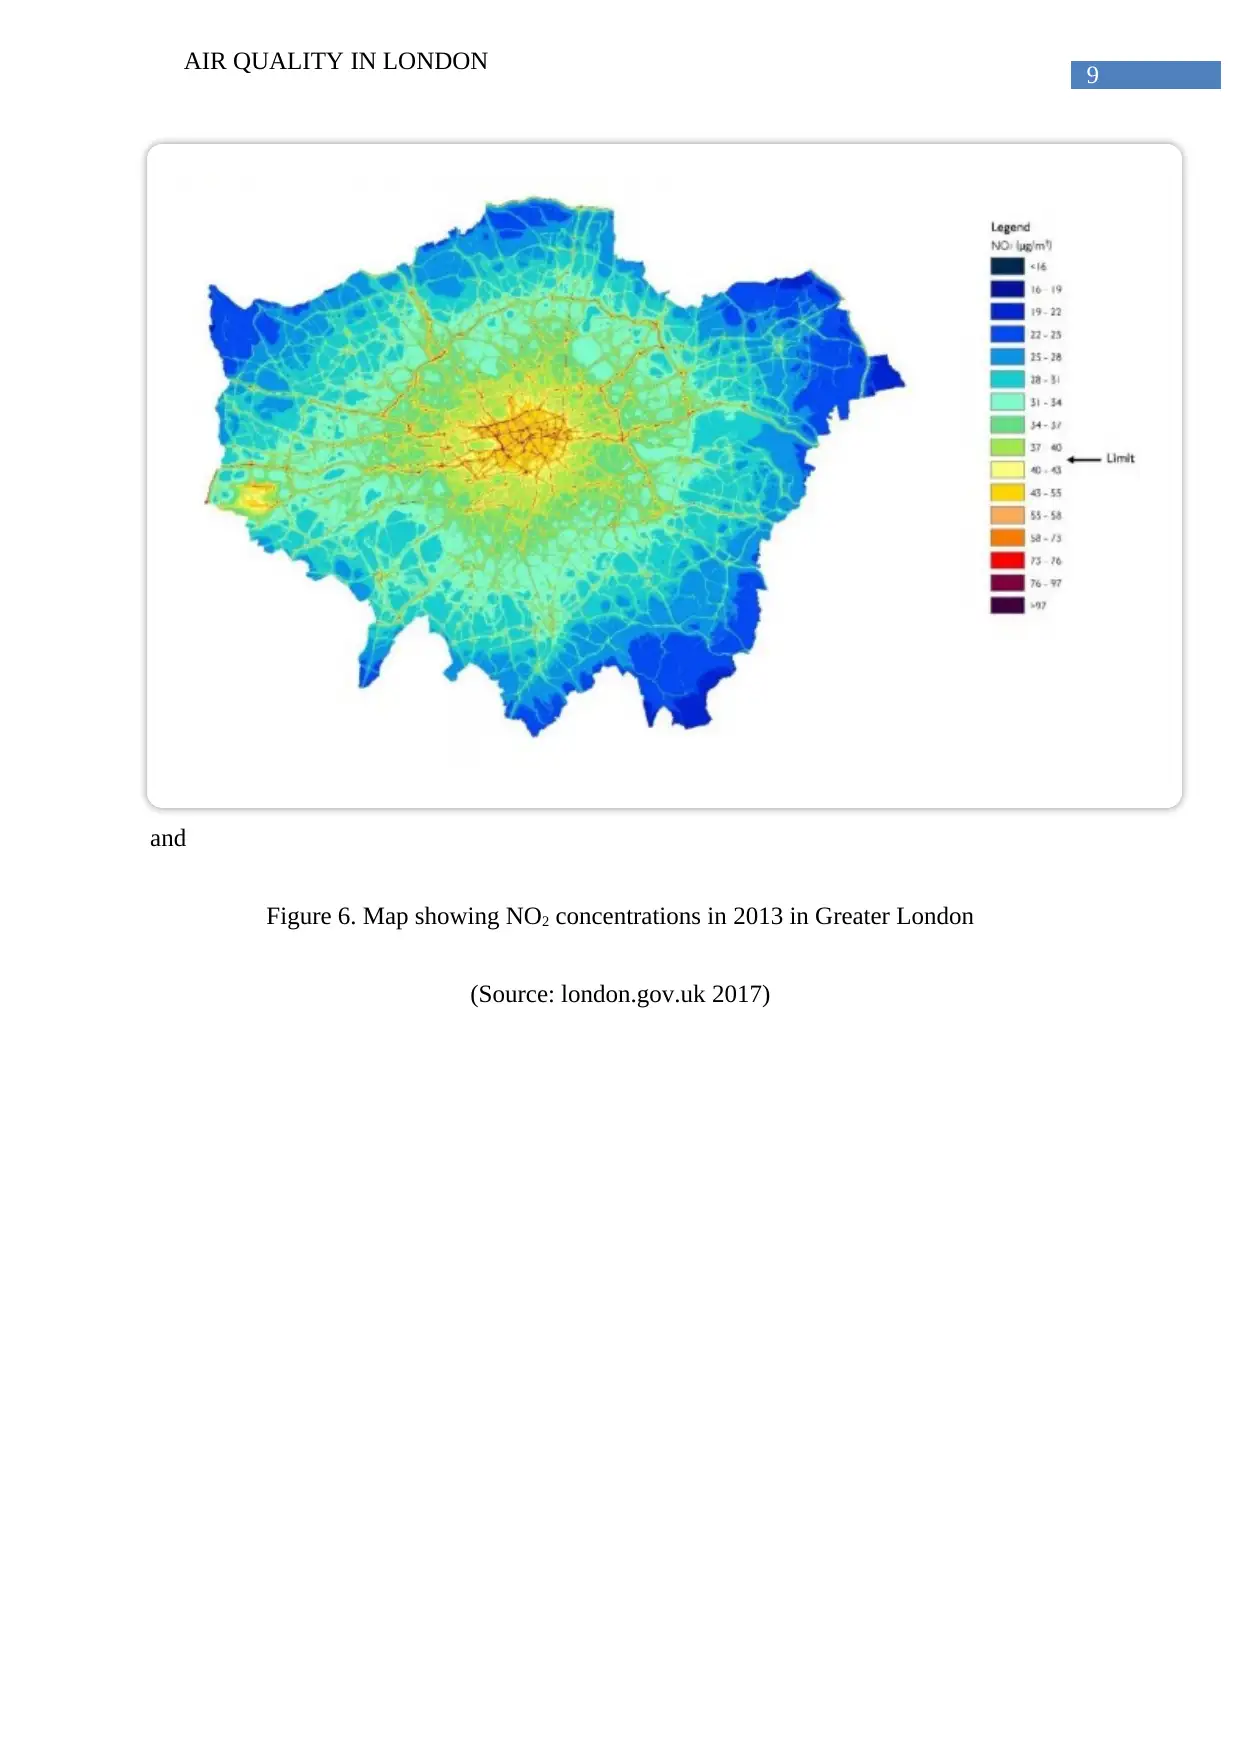
The map below shows the concentration of nitrogen dioxide (NO2) pollution the
Greater London in the year 2013. The map shows that Camden falls within high
concentration zone, which means that large numbers of people living in the area are exposed
to harmful effect of pollution. A report released by the Government of London reveals that
pollutants like NO2 and carbon dioxide pose threats to the respiratory system of the people.
Air pollution caused nearly half the death in 2010 in London (Kirk, Bristow and Zanni 2014).
The experts say that reduction in air pollution would save 4 million between 2010 and 2020.
This analysis shows that a large number of people residing in the city of London and
particularly in the areas of Camden are exposed to air pollution and health risks associated
with the pollution.
AIR QUALITY IN LONDON
consist of rich upper class people, middle class and the lower class people living in the slums.
The population of Camden consists of British, Irish and immigrants. The main immigrants
residing Camden are the Asians mainly from India and China, Africans and North Americans
(Kanzaria and Hoffman 2017). The main religious groups staying in Camden are Christians,
Hindus, Islam and Buddhists.
7. Geoprocessing operations in Cambria
The geoprocessinng operations of Camden consist of collecting set of data and
performing experiments on the data to gain a desired outcome. The desired outcome in this
case consists of finding the number of people in Cambria suffering due to air pollution in the
city.
8. Number of people affected by poor air quality:
The map below shows the concentration of nitrogen dioxide (NO2) pollution the
Greater London in the year 2013. The map shows that Camden falls within high
concentration zone, which means that large numbers of people living in the area are exposed
to harmful effect of pollution. A report released by the Government of London reveals that
pollutants like NO2 and carbon dioxide pose threats to the respiratory system of the people.
Air pollution caused nearly half the death in 2010 in London (Kirk, Bristow and Zanni 2014).
The experts say that reduction in air pollution would save 4 million between 2010 and 2020.
This analysis shows that a large number of people residing in the city of London and
particularly in the areas of Camden are exposed to air pollution and health risks associated
with the pollution.
⊘ This is a preview!⊘
Do you want full access?
Subscribe today to unlock all pages.
Trusted by 1+ million students worldwide
9
AIR QUALITY IN LONDON
and
Figure 6. Map showing NO2 concentrations in 2013 in Greater London
(Source: london.gov.uk 2017)
AIR QUALITY IN LONDON
and
Figure 6. Map showing NO2 concentrations in 2013 in Greater London
(Source: london.gov.uk 2017)
Paraphrase This Document
Need a fresh take? Get an instant paraphrase of this document with our AI Paraphraser
10
AIR QUALITY IN LONDON
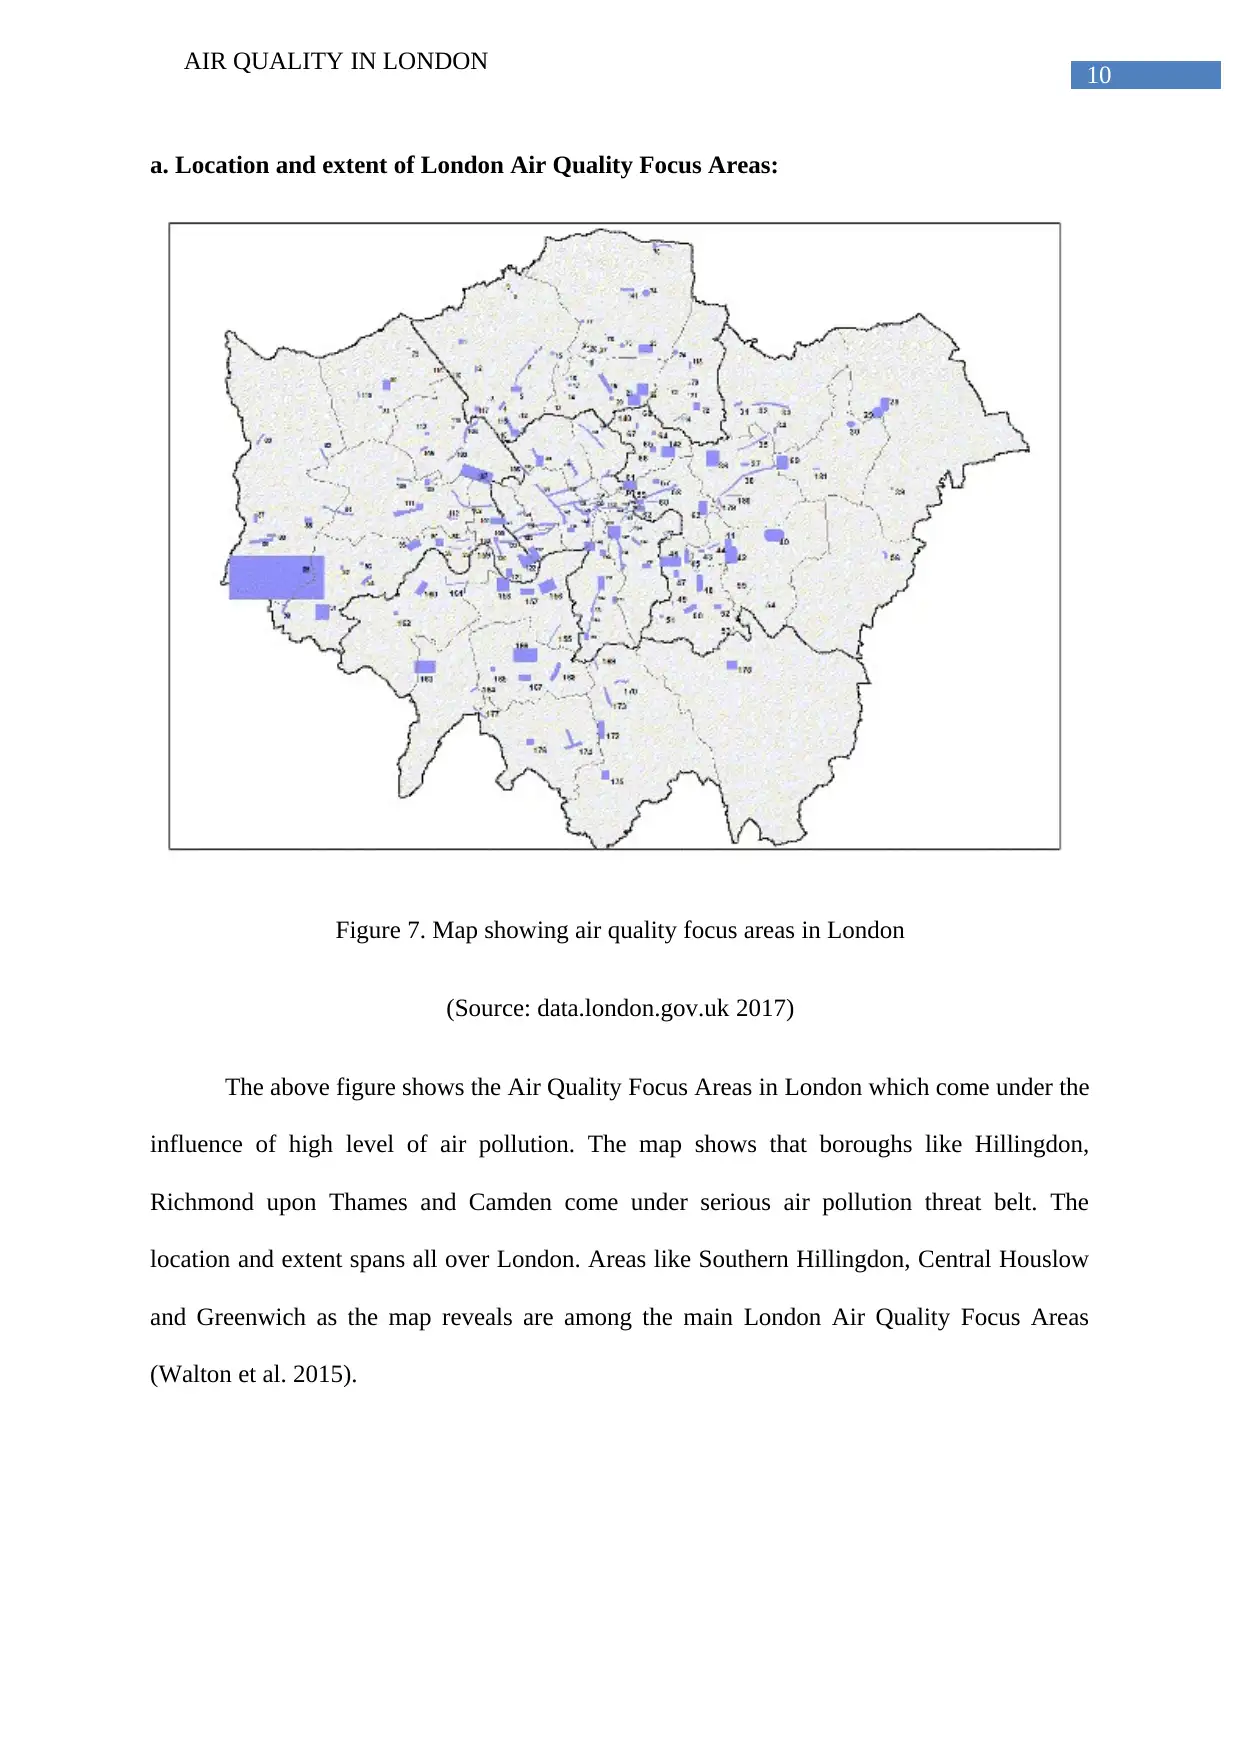
a. Location and extent of London Air Quality Focus Areas:
Figure 7. Map showing air quality focus areas in London
(Source: data.london.gov.uk 2017)
The above figure shows the Air Quality Focus Areas in London which come under the
influence of high level of air pollution. The map shows that boroughs like Hillingdon,
Richmond upon Thames and Camden come under serious air pollution threat belt. The
location and extent spans all over London. Areas like Southern Hillingdon, Central Houslow
and Greenwich as the map reveals are among the main London Air Quality Focus Areas
(Walton et al. 2015).
AIR QUALITY IN LONDON
a. Location and extent of London Air Quality Focus Areas:
Figure 7. Map showing air quality focus areas in London
(Source: data.london.gov.uk 2017)
The above figure shows the Air Quality Focus Areas in London which come under the
influence of high level of air pollution. The map shows that boroughs like Hillingdon,
Richmond upon Thames and Camden come under serious air pollution threat belt. The
location and extent spans all over London. Areas like Southern Hillingdon, Central Houslow
and Greenwich as the map reveals are among the main London Air Quality Focus Areas
(Walton et al. 2015).
11
AIR QUALITY IN LONDON
b. Geographical relationship between road network, underground stations, green space
and water areas.
The above discussion explores four aspects of London namely, road network, the
underground stations or tubes, green space and water areas. The analysis of London Air
Quality Focus Areas shows that the road network and the underground stations in London are
responsible for a great deal of pollution. This is because the cars and the railway release
immense quantities of exhausts containing devastating chemicals like nitrogen dioxide and
soot (theguardian.com 2017). These chemicals cause respiratory damage and other critical
diseases like cancer. As reported already, 75 percent of cardiovascular diseases in the United
Kingdom were attributed to exposure to this air pollution. This analysis shows that the
transport network of London primarily consisting of railways and roads are responsible for
the air pollution, which make them important in the study of London Air Quality Focus
Areas.
The analysis of the environmental aspects of London shows that the city has sufficient
water areas and green spaces. These green spaces and water areas are of great significance
while studying the London Air Quality. This is because these spaces support plant life, which
give out oxygen and absorb the harmful gases given out by the railway engines and the cars.
They as a result help the authorities and the people deal with the ill effects of air pollution.
These parks and water bodies also support animal lives who contribute to the biodiversity of
the city of London. This analysis shows that geographical relationship between the road
network, underground railways, green spaces and water bodies of London.
3. Process of analysis:
The appropriate process of analysis of the study is vector data model. The analysis of
the impact of air pollution on the people of London and the number of people, which come
⊘ This is a preview!⊘
Do you want full access?
Subscribe today to unlock all pages.
Trusted by 1+ million students worldwide
1 out of 17
Related Documents


Your All-in-One AI-Powered Toolkit for Academic Success.
+13062052269
info@desklib.com
Available 24*7 on WhatsApp / Email
![[object Object]](/_next/static/media/star-bottom.7253800d.svg)
Unlock your academic potential
Copyright © 2020–2025 A2Z Services. All Rights Reserved. Developed and managed by ZUCOL.