Data Analysis Report: Humidity Data for London, December 2019

Verified

Added on  2023/01/16

|10
|1607
|45
Report
AI Summary
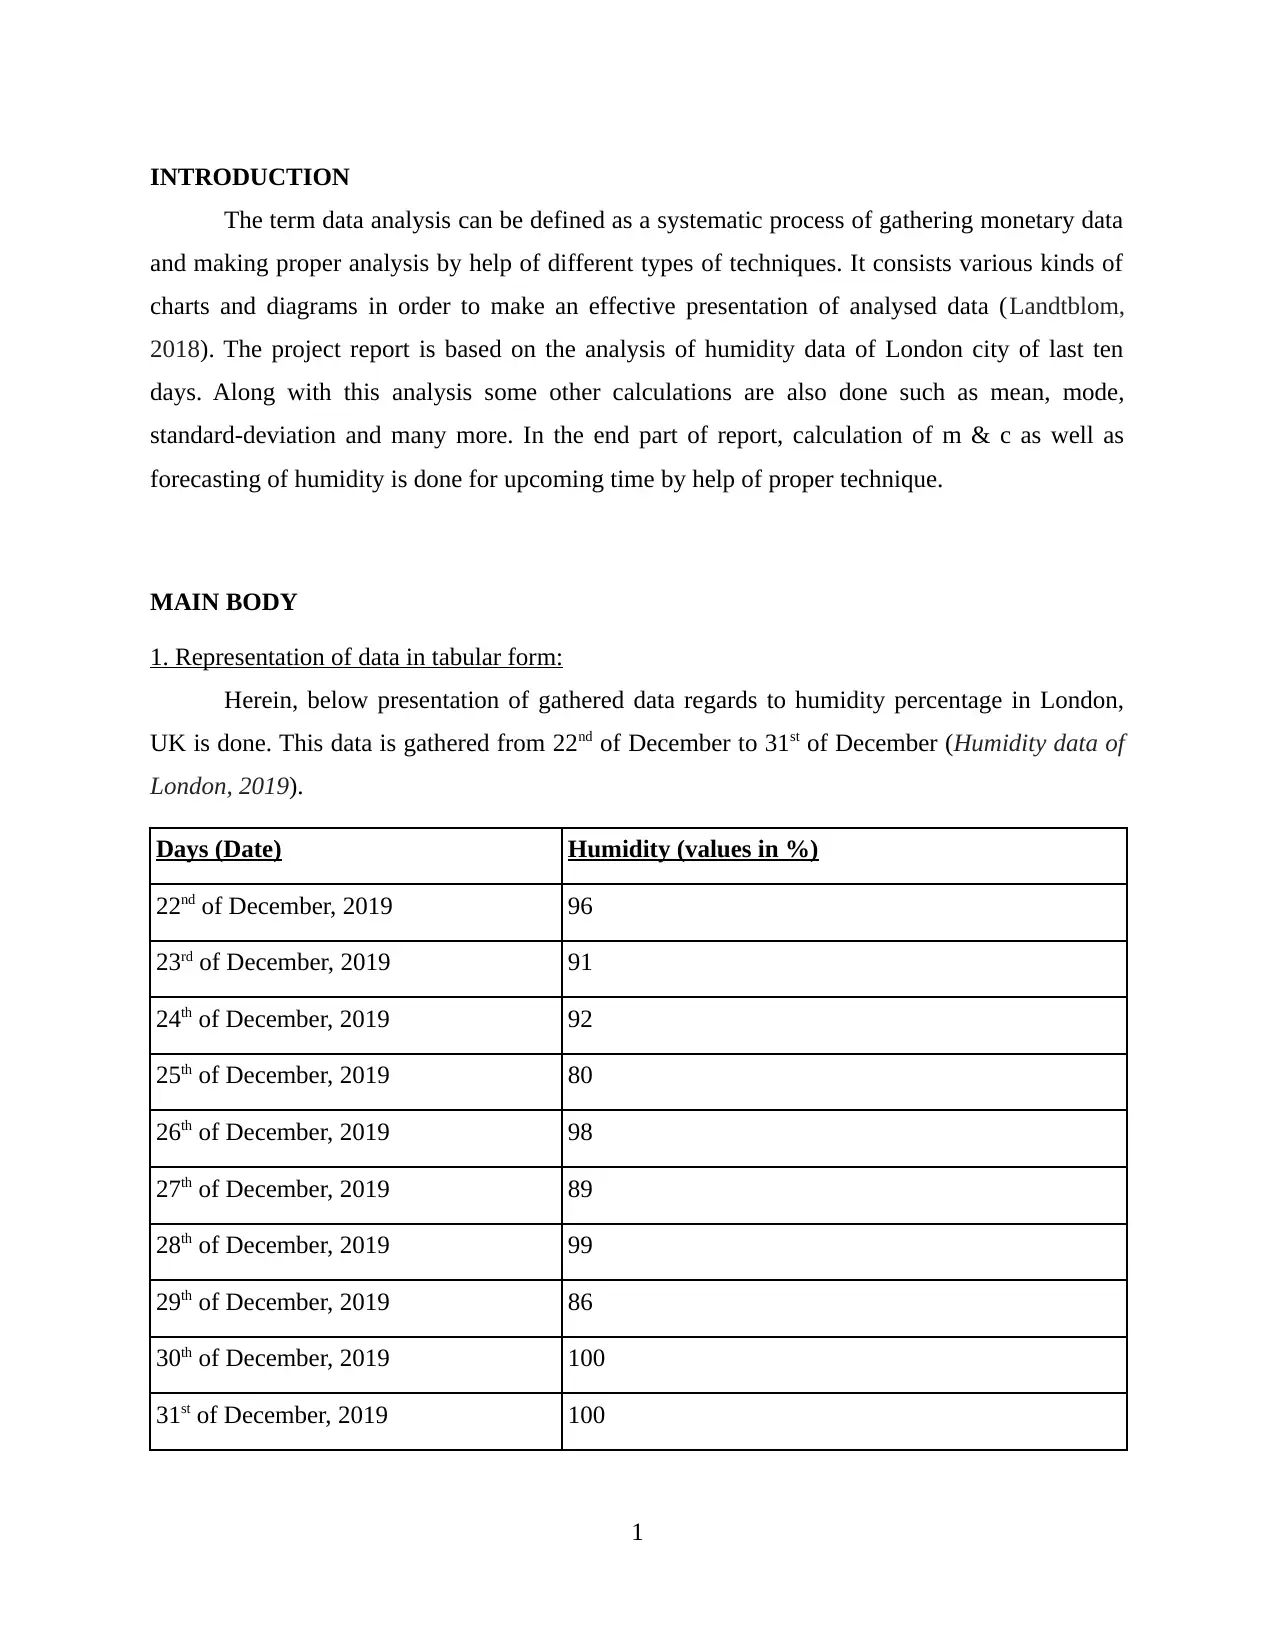
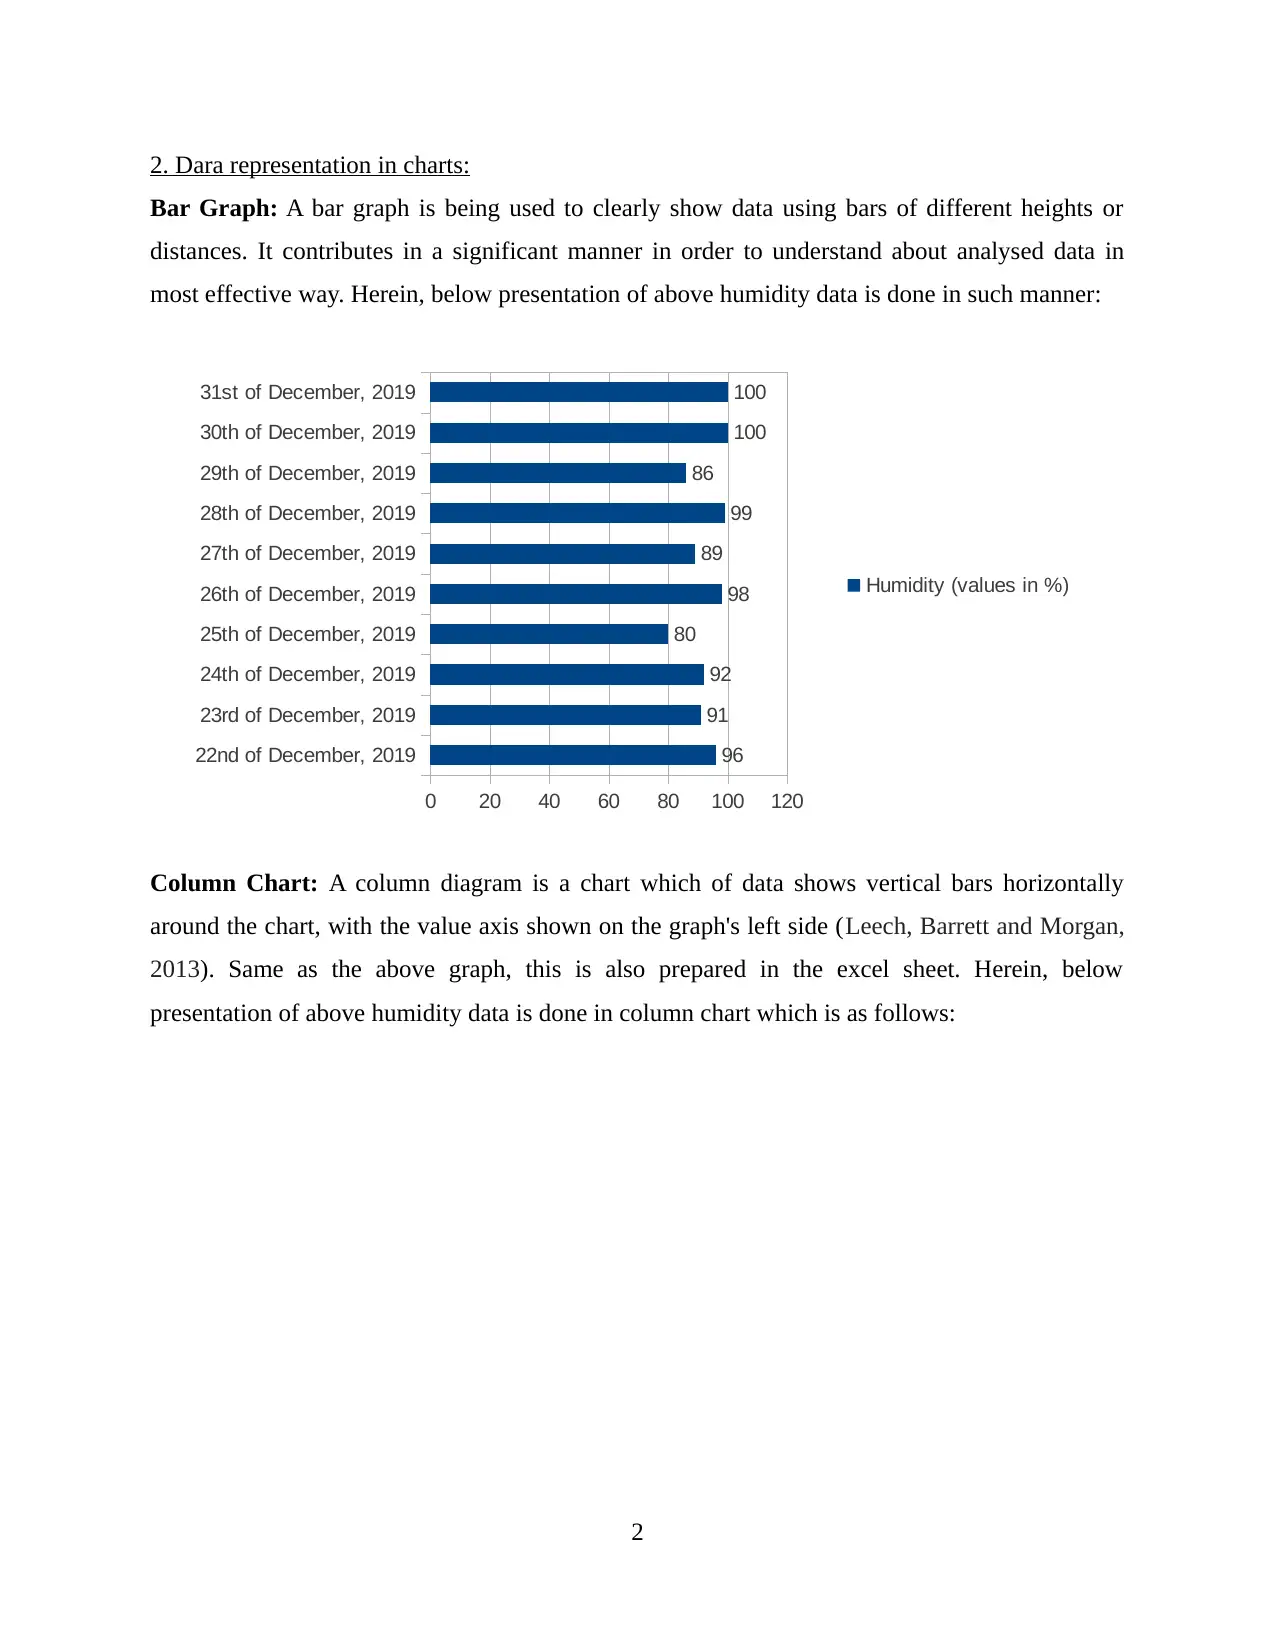
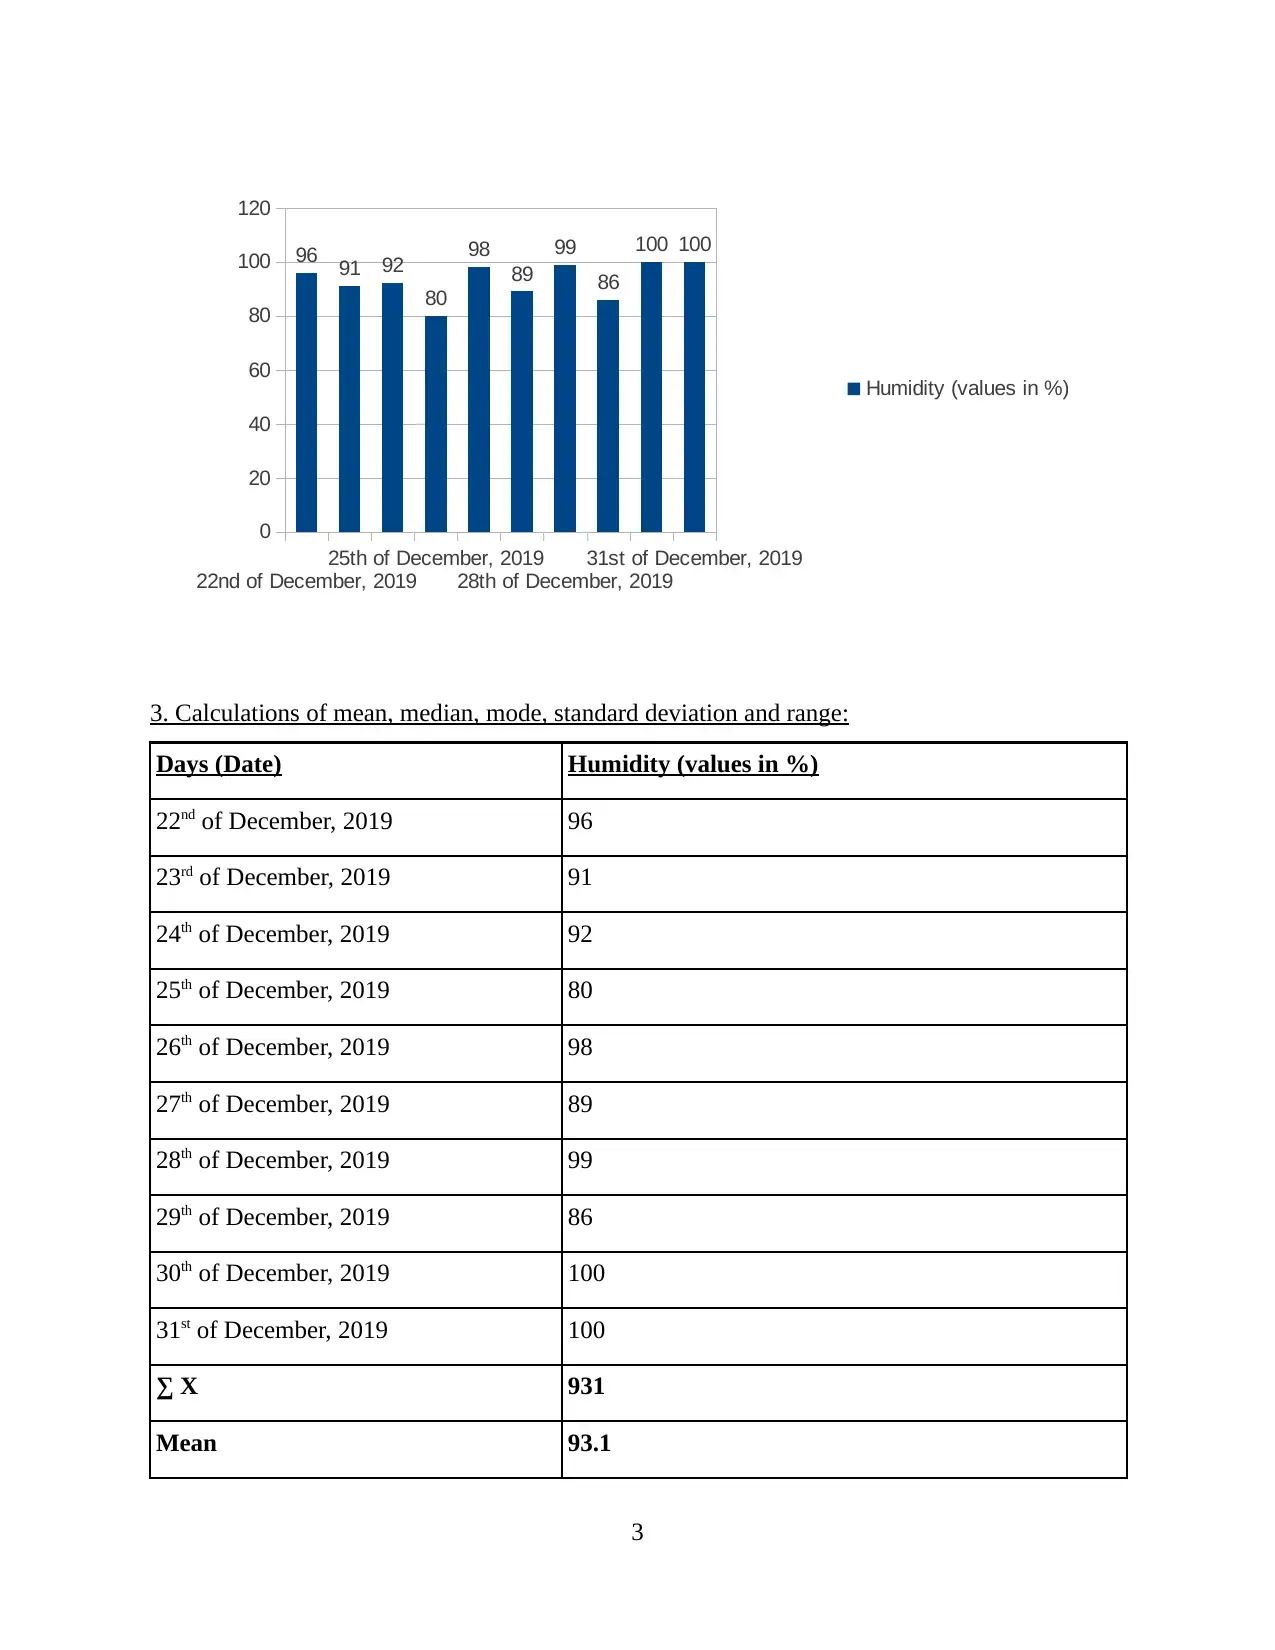
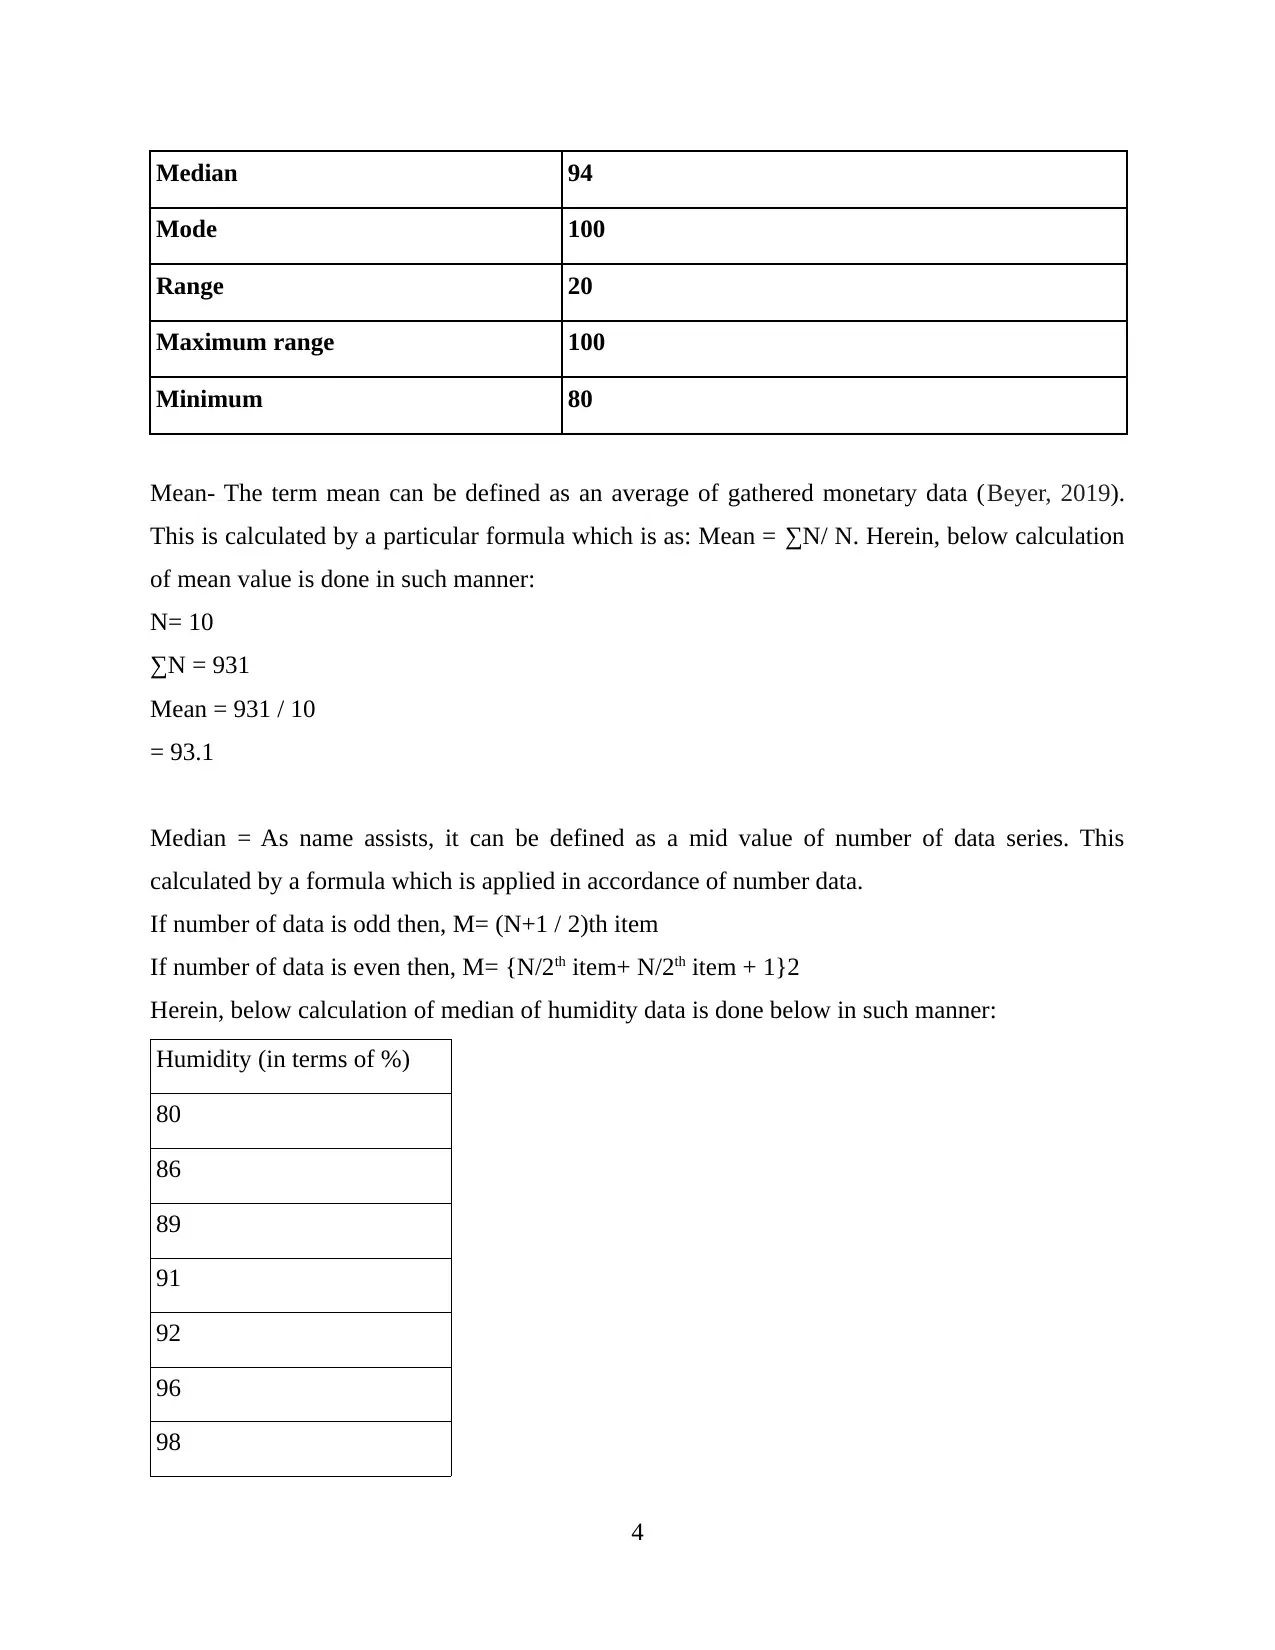
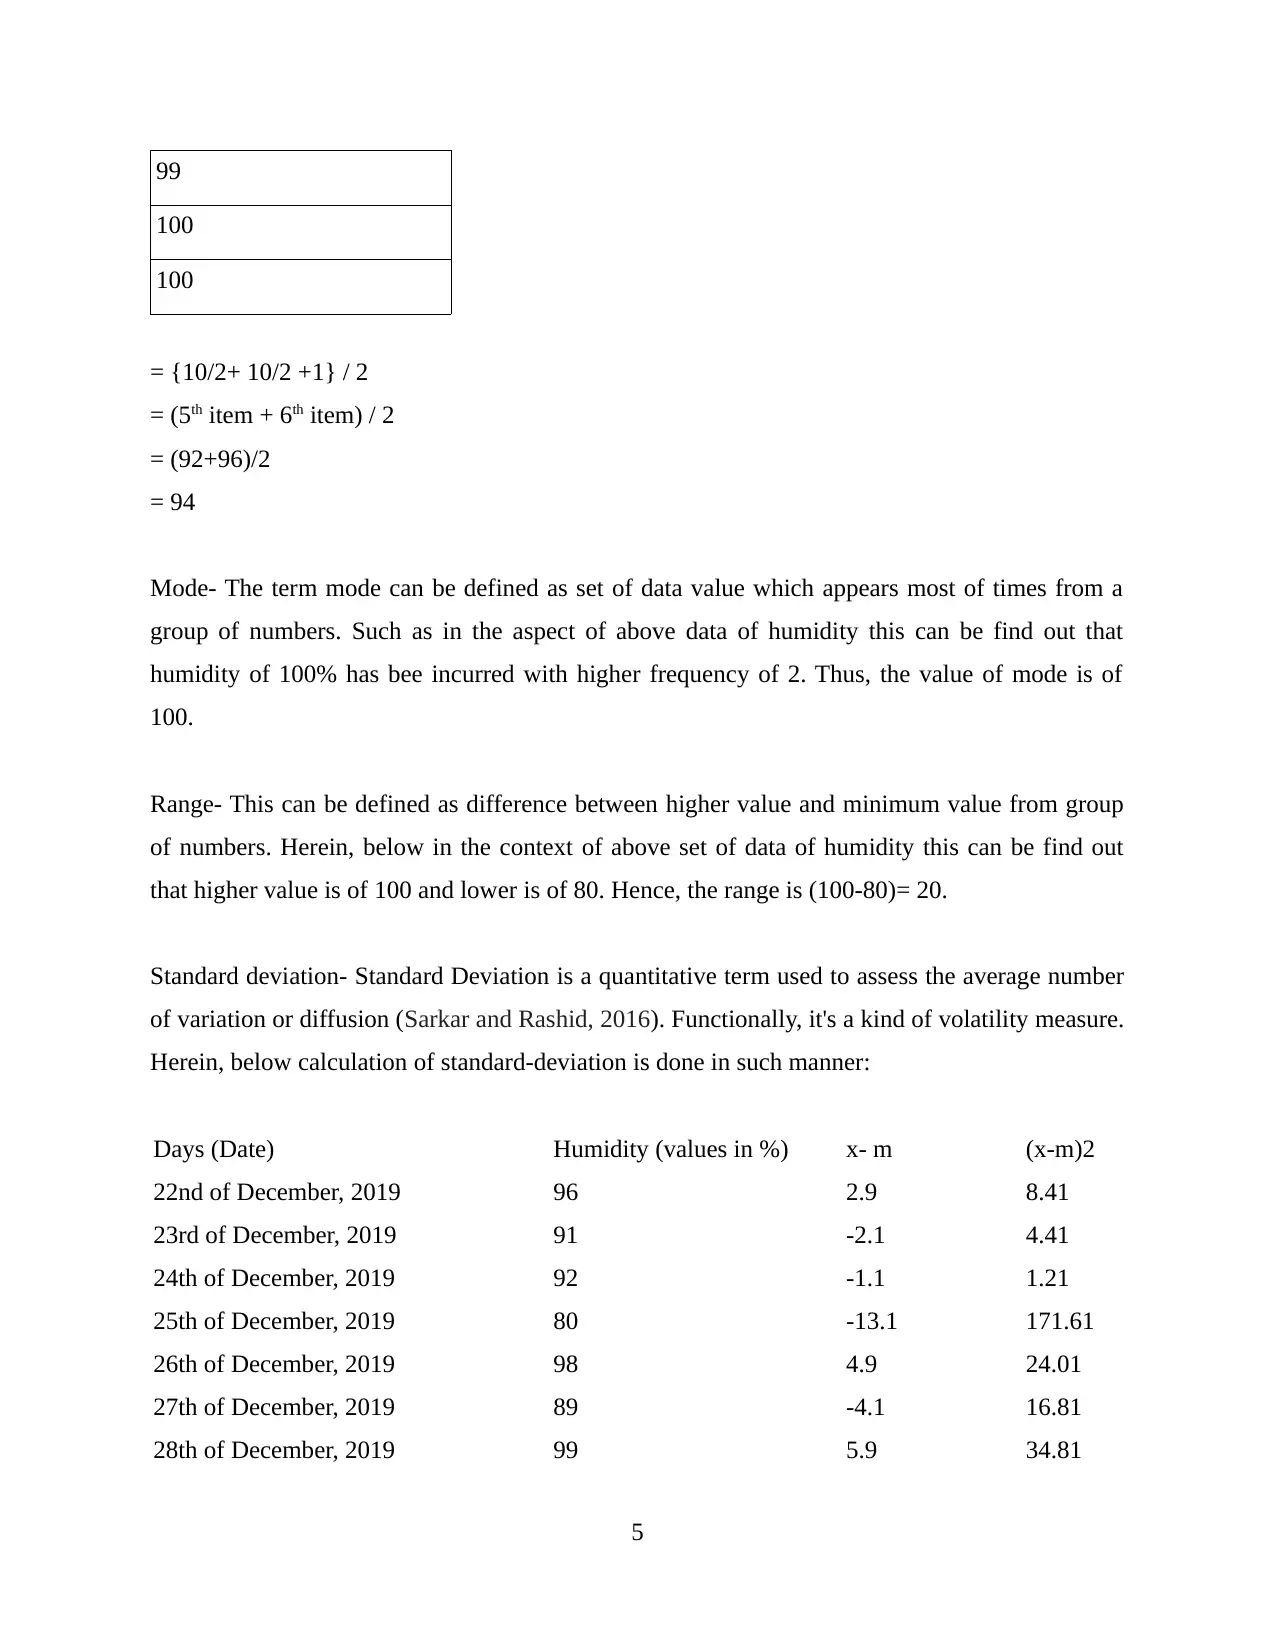
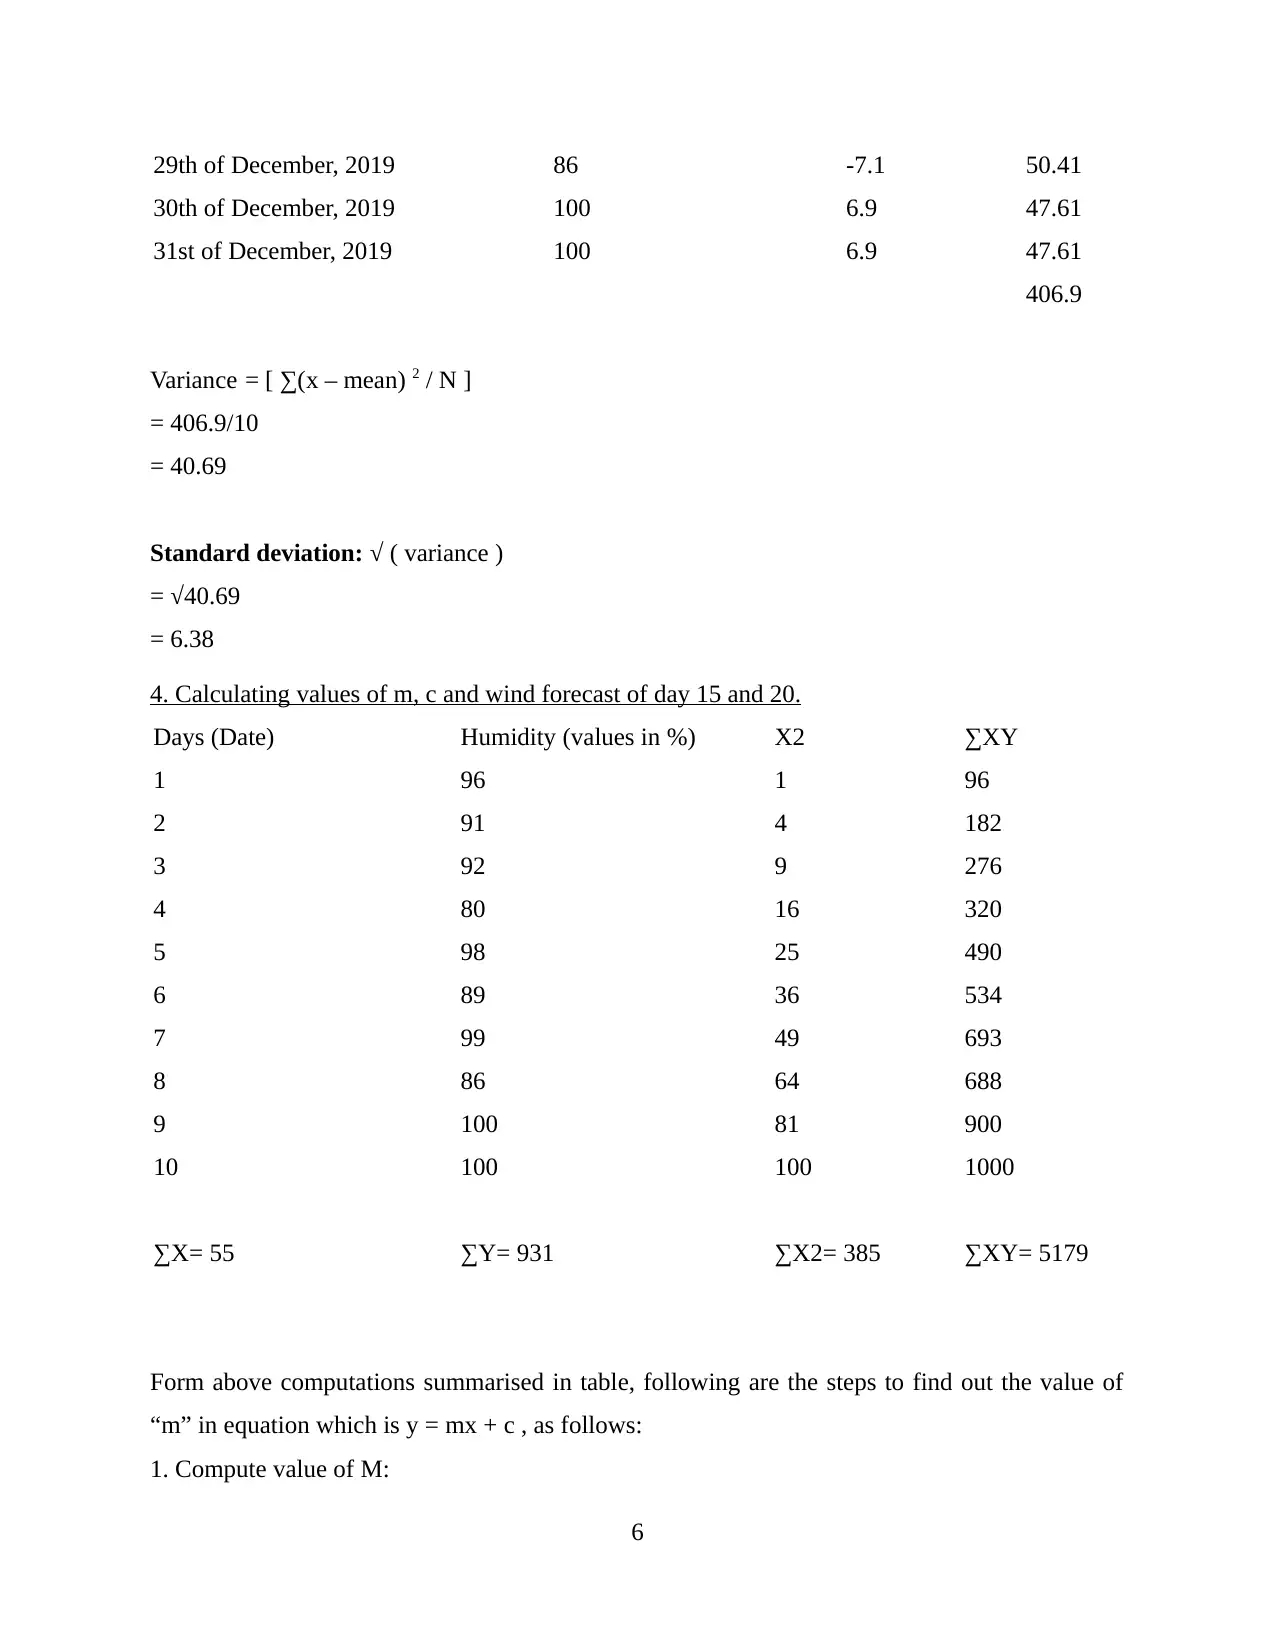
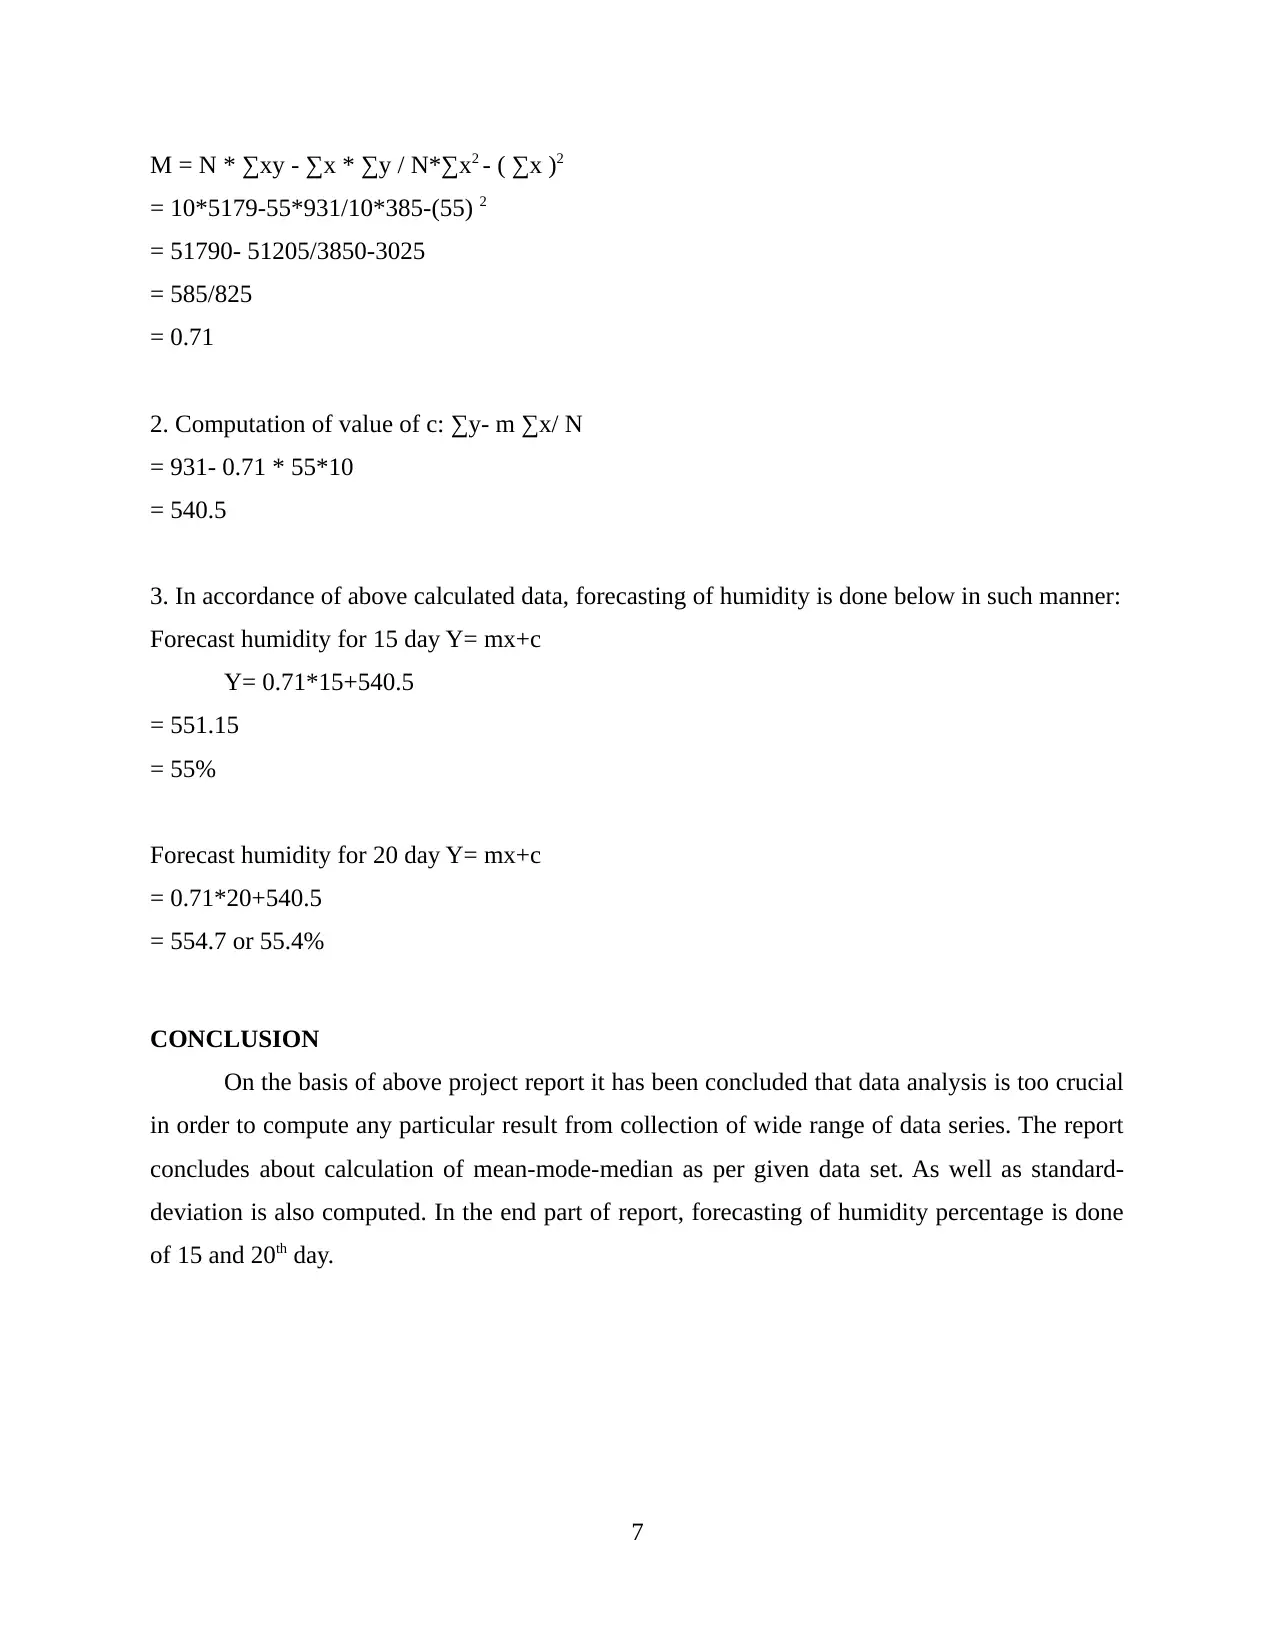
This report presents a data analysis of London's humidity levels from December 22nd to 31st, 2019. The analysis begins with a tabular representation of the data, followed by data visualization using bar and column charts. Statistical calculations, including mean, median, mode, range, and standard deviation, are performed to understand the central tendency and variability of the humidity data. Furthermore, the report calculates the values of 'm' and 'c' based on the data, and forecasts the humidity percentage for the 15th and 20th days using a linear equation. The report concludes with a summary of the findings and references to the sources used.
tabler-icon-diamond-filled.svg

Contribute Materials

Your contribution can guide someone’s learning journey. Share your documents today.
Document Page
Numeracy
&
Data Analysis
tabler-icon-diamond-filled.svg

Secure Best Marks with AI Grader

Need help grading? Try our AI Grader for instant feedback on your assignments.
Document Page
Table of Contents
INTRODUCTION................................................................................................................................1
MAIN BODY.......................................................................................................................................1
1. Representation of data in tabular form:.......................................................................................1
2. Dara representation in charts:......................................................................................................1
3. Calculations of mean, median, mode, standard deviation and range:..........................................3
4. Calculating values of m, c and wind forecast of day 15 and 20..................................................5
CONCLUSION ...................................................................................................................................6
REFERENCES.....................................................................................................................................7
Document Page
INTRODUCTION
The term data analysis can be defined as a systematic process of gathering monetary data
and making proper analysis by help of different types of techniques. It consists various kinds of
charts and diagrams in order to make an effective presentation of analysed data (Landtblom,
2018). The project report is based on the analysis of humidity data of London city of last ten
days. Along with this analysis some other calculations are also done such as mean, mode,
standard-deviation and many more. In the end part of report, calculation of m & c as well as
forecasting of humidity is done for upcoming time by help of proper technique.
MAIN BODY
1. Representation of data in tabular form:
Herein, below presentation of gathered data regards to humidity percentage in London,
UK is done. This data is gathered from 22nd of December to 31st of December (Humidity data of
London, 2019).
Days (Date) Humidity (values in %)
22nd of December, 2019 96
23rd of December, 2019 91
24th of December, 2019 92
25th of December, 2019 80
26th of December, 2019 98
27th of December, 2019 89
28th of December, 2019 99
29th of December, 2019 86
30th of December, 2019 100
31st of December, 2019 100
1
Document Page
2. Dara representation in charts:
Bar Graph: A bar graph is being used to clearly show data using bars of different heights or
distances. It contributes in a significant manner in order to understand about analysed data in
most effective way. Herein, below presentation of above humidity data is done in such manner:
22nd of December, 2019
23rd of December, 2019
24th of December, 2019
25th of December, 2019
26th of December, 2019
27th of December, 2019
28th of December, 2019
29th of December, 2019
30th of December, 2019
31st of December, 2019
0 20 40 60 80 100 120
96
91
92
80
98
89
99
86
100
100
Humidity (values in %)
Column Chart: A column diagram is a chart which of data shows vertical bars horizontally
around the chart, with the value axis shown on the graph's left side (Leech, Barrett and Morgan,
2013). Same as the above graph, this is also prepared in the excel sheet. Herein, below
presentation of above humidity data is done in column chart which is as follows:
2
tabler-icon-diamond-filled.svg

Secure Best Marks with AI Grader

Need help grading? Try our AI Grader for instant feedback on your assignments.
Document Page
22nd of December, 2019
25th of December, 2019
28th of December, 2019
31st of December, 2019
0
20
40
60
80
100
120
96 91 92
80
98
89
99
86
100 100
Humidity (values in %)
3. Calculations of mean, median, mode, standard deviation and range:
Days (Date) Humidity (values in %)
22nd of December, 2019 96
23rd of December, 2019 91
24th of December, 2019 92
25th of December, 2019 80
26th of December, 2019 98
27th of December, 2019 89
28th of December, 2019 99
29th of December, 2019 86
30th of December, 2019 100
31st of December, 2019 100
X 931
Mean 93.1
3
Document Page
Median 94
Mode 100
Range 20
Maximum range 100
Minimum 80
Mean- The term mean can be defined as an average of gathered monetary data (Beyer, 2019).
This is calculated by a particular formula which is as: Mean = ∑N/ N. Herein, below calculation
of mean value is done in such manner:
N= 10
∑N = 931
Mean = 931 / 10
= 93.1
Median = As name assists, it can be defined as a mid value of number of data series. This
calculated by a formula which is applied in accordance of number data.
If number of data is odd then, M= (N+1 / 2)th item
If number of data is even then, M= {N/2th item+ N/2th item + 1}2
Herein, below calculation of median of humidity data is done below in such manner:
Humidity (in terms of %)
80
86
89
91
92
96
98
4
Document Page
99
100
100
= {10/2+ 10/2 +1} / 2
= (5th item + 6th item) / 2
= (92+96)/2
= 94
Mode- The term mode can be defined as set of data value which appears most of times from a
group of numbers. Such as in the aspect of above data of humidity this can be find out that
humidity of 100% has bee incurred with higher frequency of 2. Thus, the value of mode is of
100.
Range- This can be defined as difference between higher value and minimum value from group
of numbers. Herein, below in the context of above set of data of humidity this can be find out
that higher value is of 100 and lower is of 80. Hence, the range is (100-80)= 20.
Standard deviation- Standard Deviation is a quantitative term used to assess the average number
of variation or diffusion (Sarkar and Rashid, 2016). Functionally, it's a kind of volatility measure.
Herein, below calculation of standard-deviation is done in such manner:
Days (Date) Humidity (values in %) x- m (x-m)2
22nd of December, 2019 96 2.9 8.41
23rd of December, 2019 91 -2.1 4.41
24th of December, 2019 92 -1.1 1.21
25th of December, 2019 80 -13.1 171.61
26th of December, 2019 98 4.9 24.01
27th of December, 2019 89 -4.1 16.81
28th of December, 2019 99 5.9 34.81
5
tabler-icon-diamond-filled.svg

Paraphrase This Document

Need a fresh take? Get an instant paraphrase of this document with our AI Paraphraser
Document Page
29th of December, 2019 86 -7.1 50.41
30th of December, 2019 100 6.9 47.61
31st of December, 2019 100 6.9 47.61
406.9
Variance = [ ∑(x – mean) 2 / N ]
= 406.9/10
= 40.69
Standard deviation: √ ( variance )
= √40.69
= 6.38
4. Calculating values of m, c and wind forecast of day 15 and 20.
Days (Date) Humidity (values in %) X2 ∑XY
1 96 1 96
2 91 4 182
3 92 9 276
4 80 16 320
5 98 25 490
6 89 36 534
7 99 49 693
8 86 64 688
9 100 81 900
10 100 100 1000
∑X= 55 ∑Y= 931 ∑X2= 385 ∑XY= 5179
Form above computations summarised in table, following are the steps to find out the value of
“m” in equation which is y = mx + c , as follows:
1. Compute value of M:
6
Document Page
M = N * ∑xy - ∑x * ∑y / N*∑x2 - ( ∑x )2
= 10*5179-55*931/10*385-(55) 2
= 51790- 51205/3850-3025
= 585/825
= 0.71
2. Computation of value of c: ∑y- m ∑x/ N
= 931- 0.71 * 55*10
= 540.5
3. In accordance of above calculated data, forecasting of humidity is done below in such manner:
Forecast humidity for 15 day Y= mx+c
Y= 0.71*15+540.5
= 551.15
= 55%
Forecast humidity for 20 day Y= mx+c
= 0.71*20+540.5
= 554.7 or 55.4%
CONCLUSION
On the basis of above project report it has been concluded that data analysis is too crucial
in order to compute any particular result from collection of wide range of data series. The report
concludes about calculation of mean-mode-median as per given data set. As well as standard-
deviation is also computed. In the end part of report, forecasting of humidity percentage is done
of 15 and 20th day.
7
Document Page
REFERENCES
Books and Journals:
Landtblom, K. K., 2018. Prospective Teachers’ Conceptions of the Concepts Mean, Median and
Mode. In Students' and Teachers' Values, Attitudes, Feelings and Beliefs in Mathematics
Classrooms (pp. 43-52). Springer, Cham.
Beyer, W. H., 2019. Handbook of tables for probability and statistics. Crc Press.
Sarkar, J. and Rashid, M., 2016. Visualizing mean, median, mean deviation, and standard
deviation of a set of numbers. The American Statistician. 70(3). pp.304-312.
Leech, N., Barrett, K. and Morgan, G. A., 2013. SPSS for intermediate statistics: Use and
interpretation. Routledge.
Online
Humidity data of London. 2019. [Online]. Available through:
<https://www.timeanddate.com/weather/uk/london/historic>
8
chevron_up_icon
1 out of 10
circle_padding
hide_on_mobile
zoom_out_icon
logo.png

Your All-in-One AI-Powered Toolkit for Academic Success.

Available 24*7 on WhatsApp / Email

[object Object]