Data and Numerical Analysis: Forecasting London Humidity in December

Verified

Added on  2023/01/18

|11
|1511
|54
Homework Assignment
AI Summary
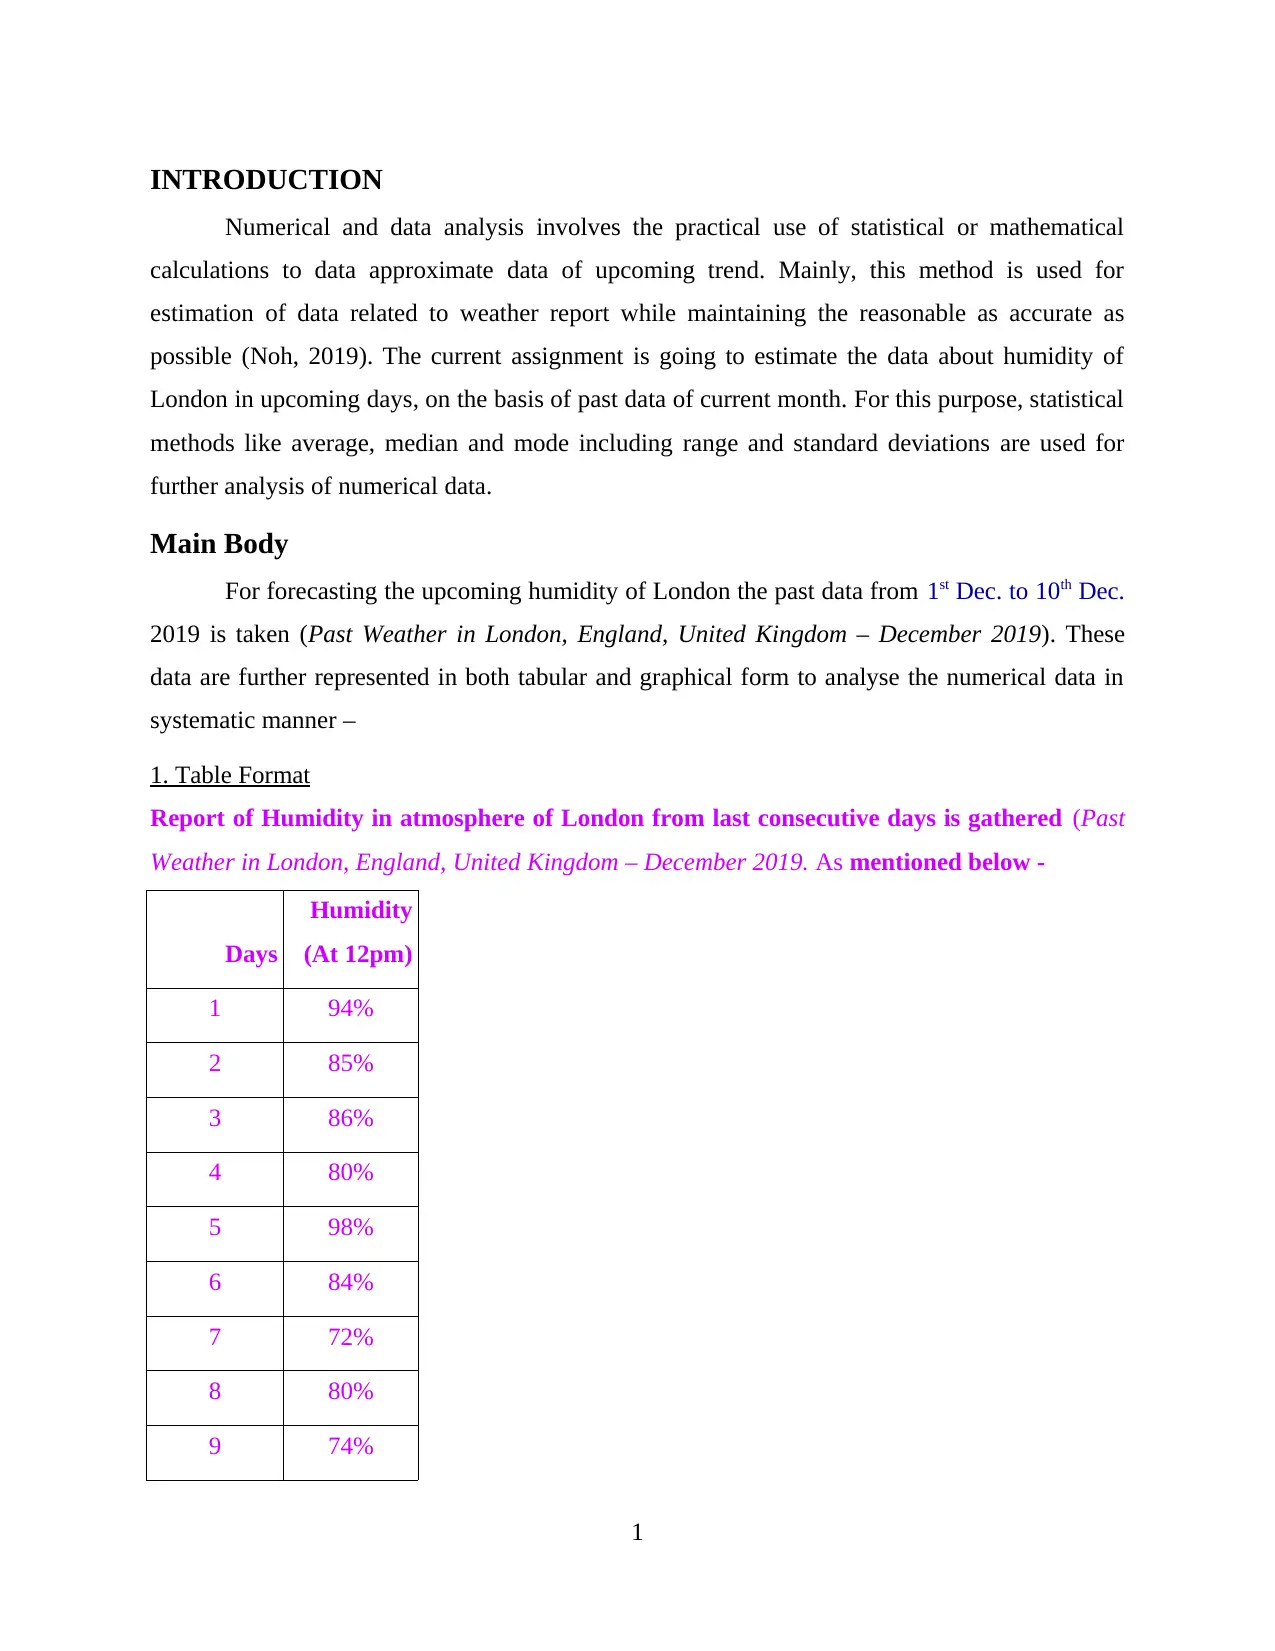
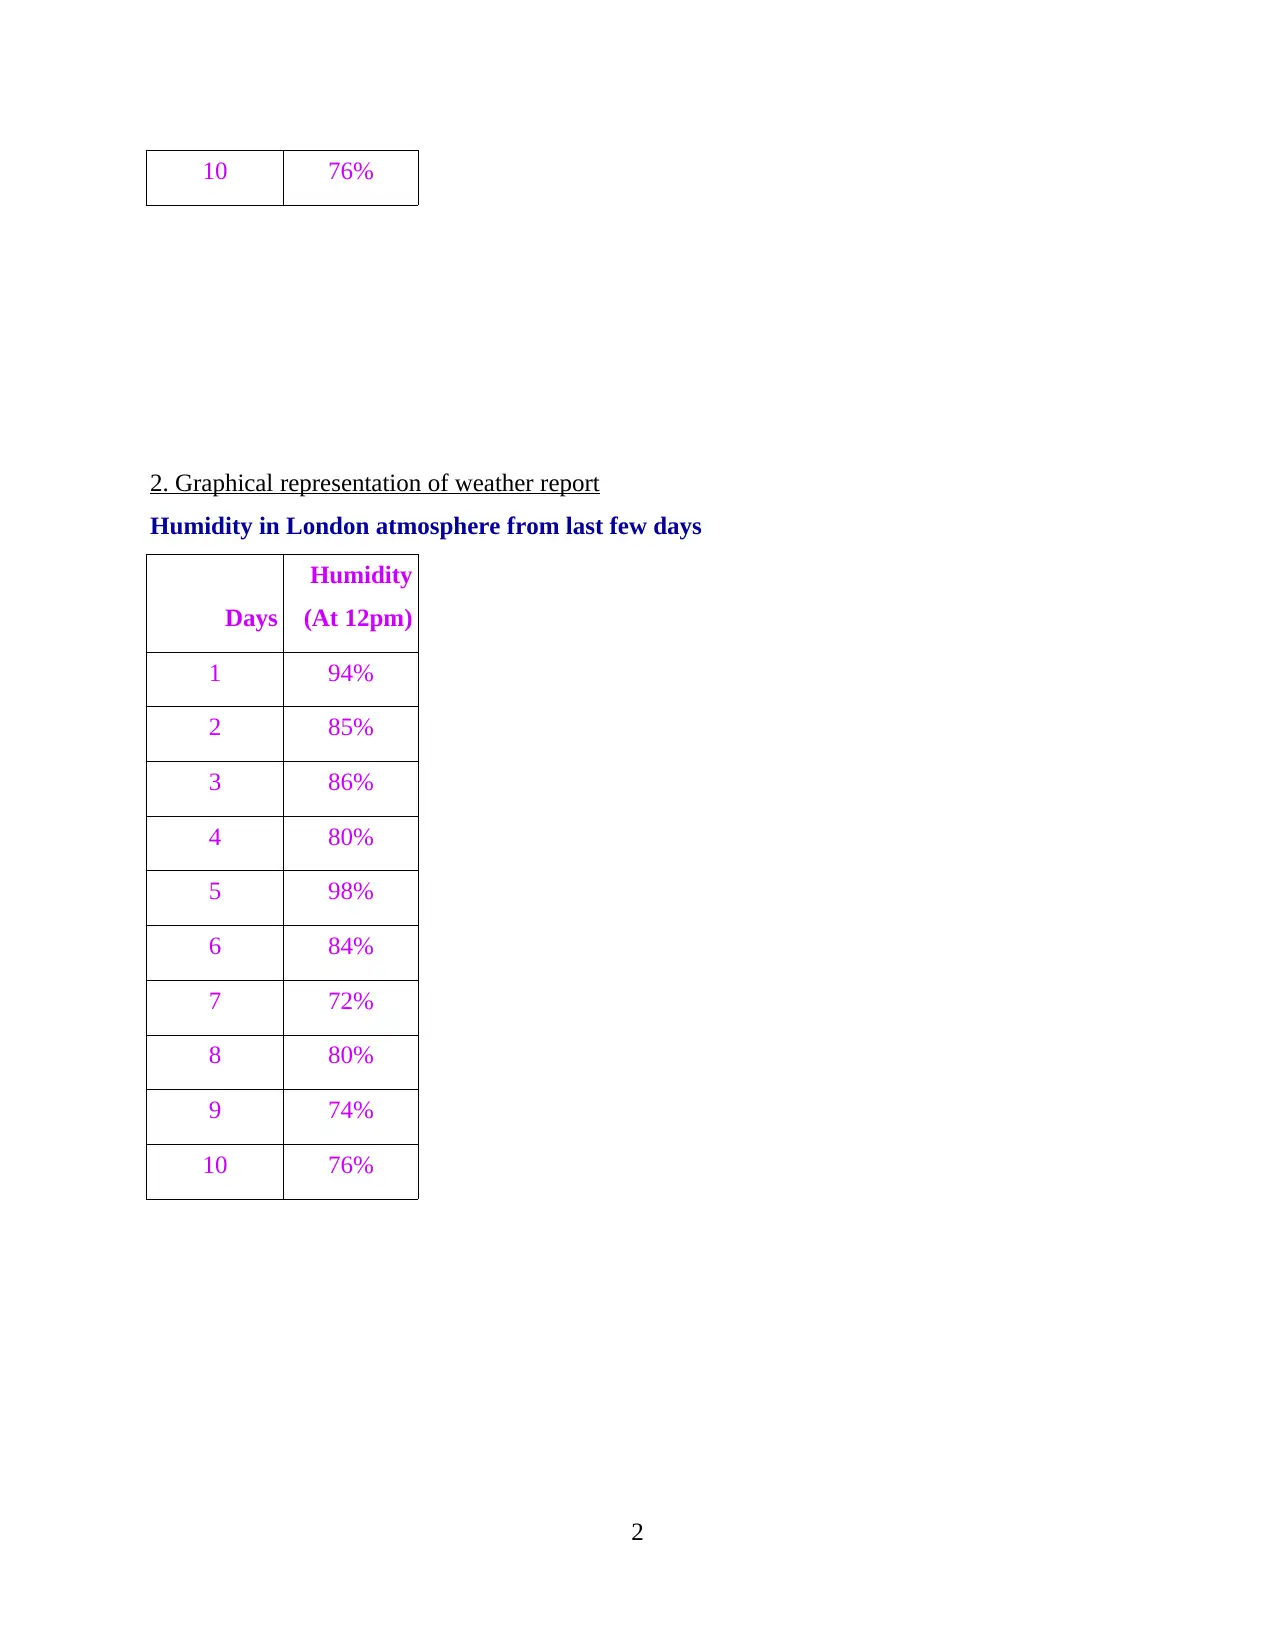
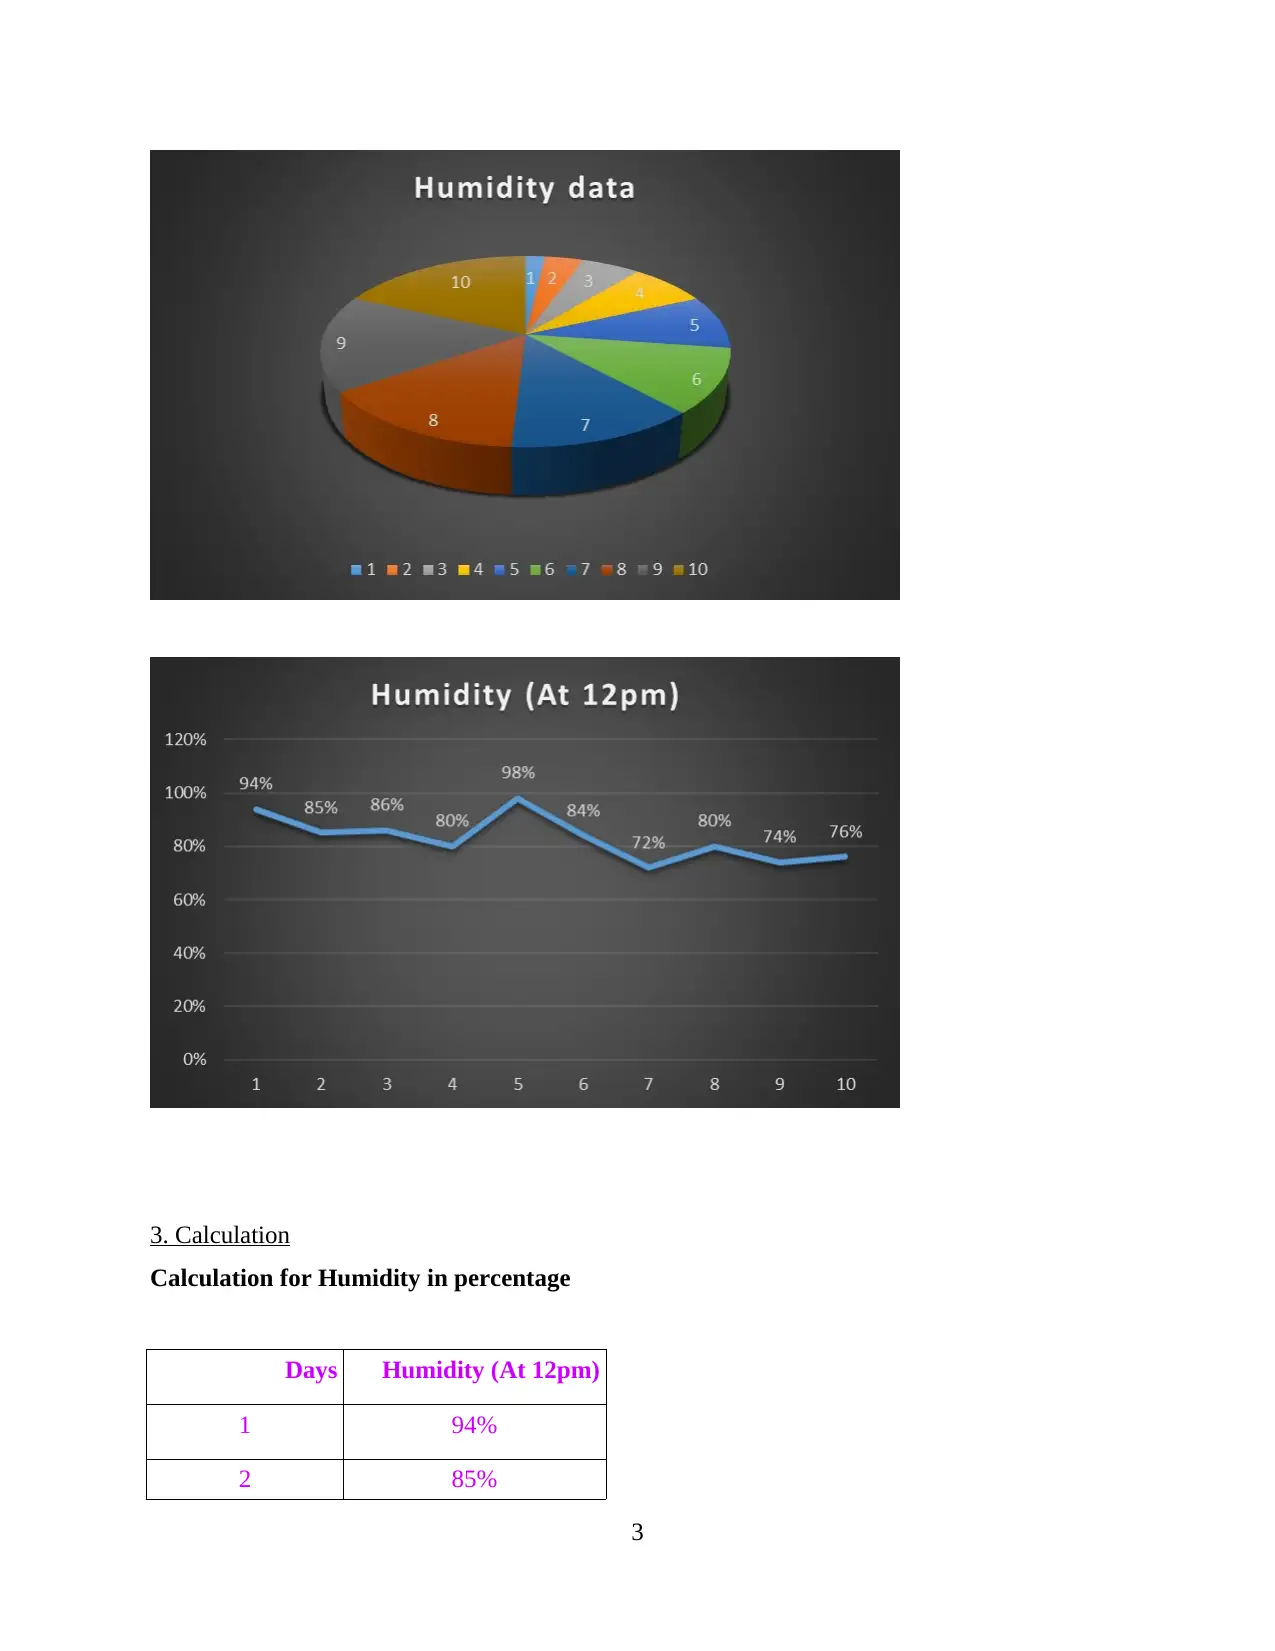
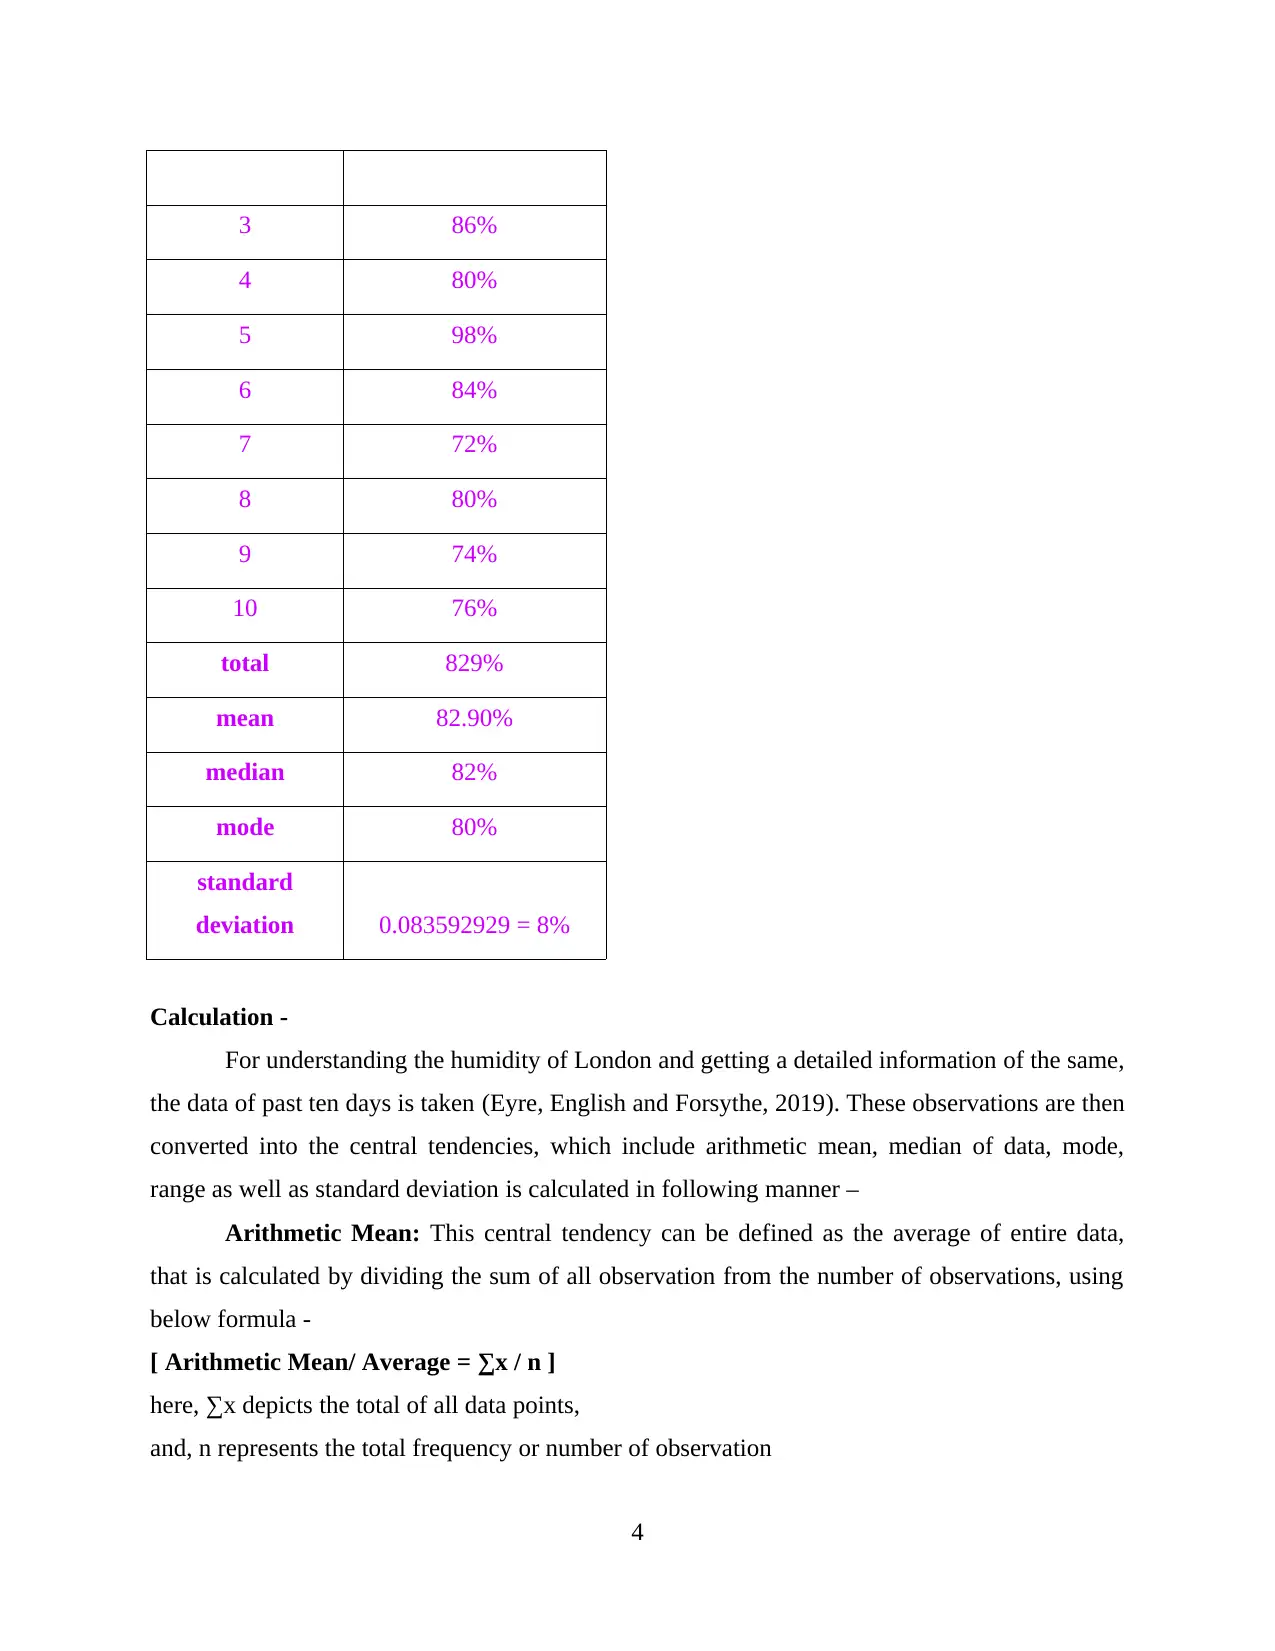
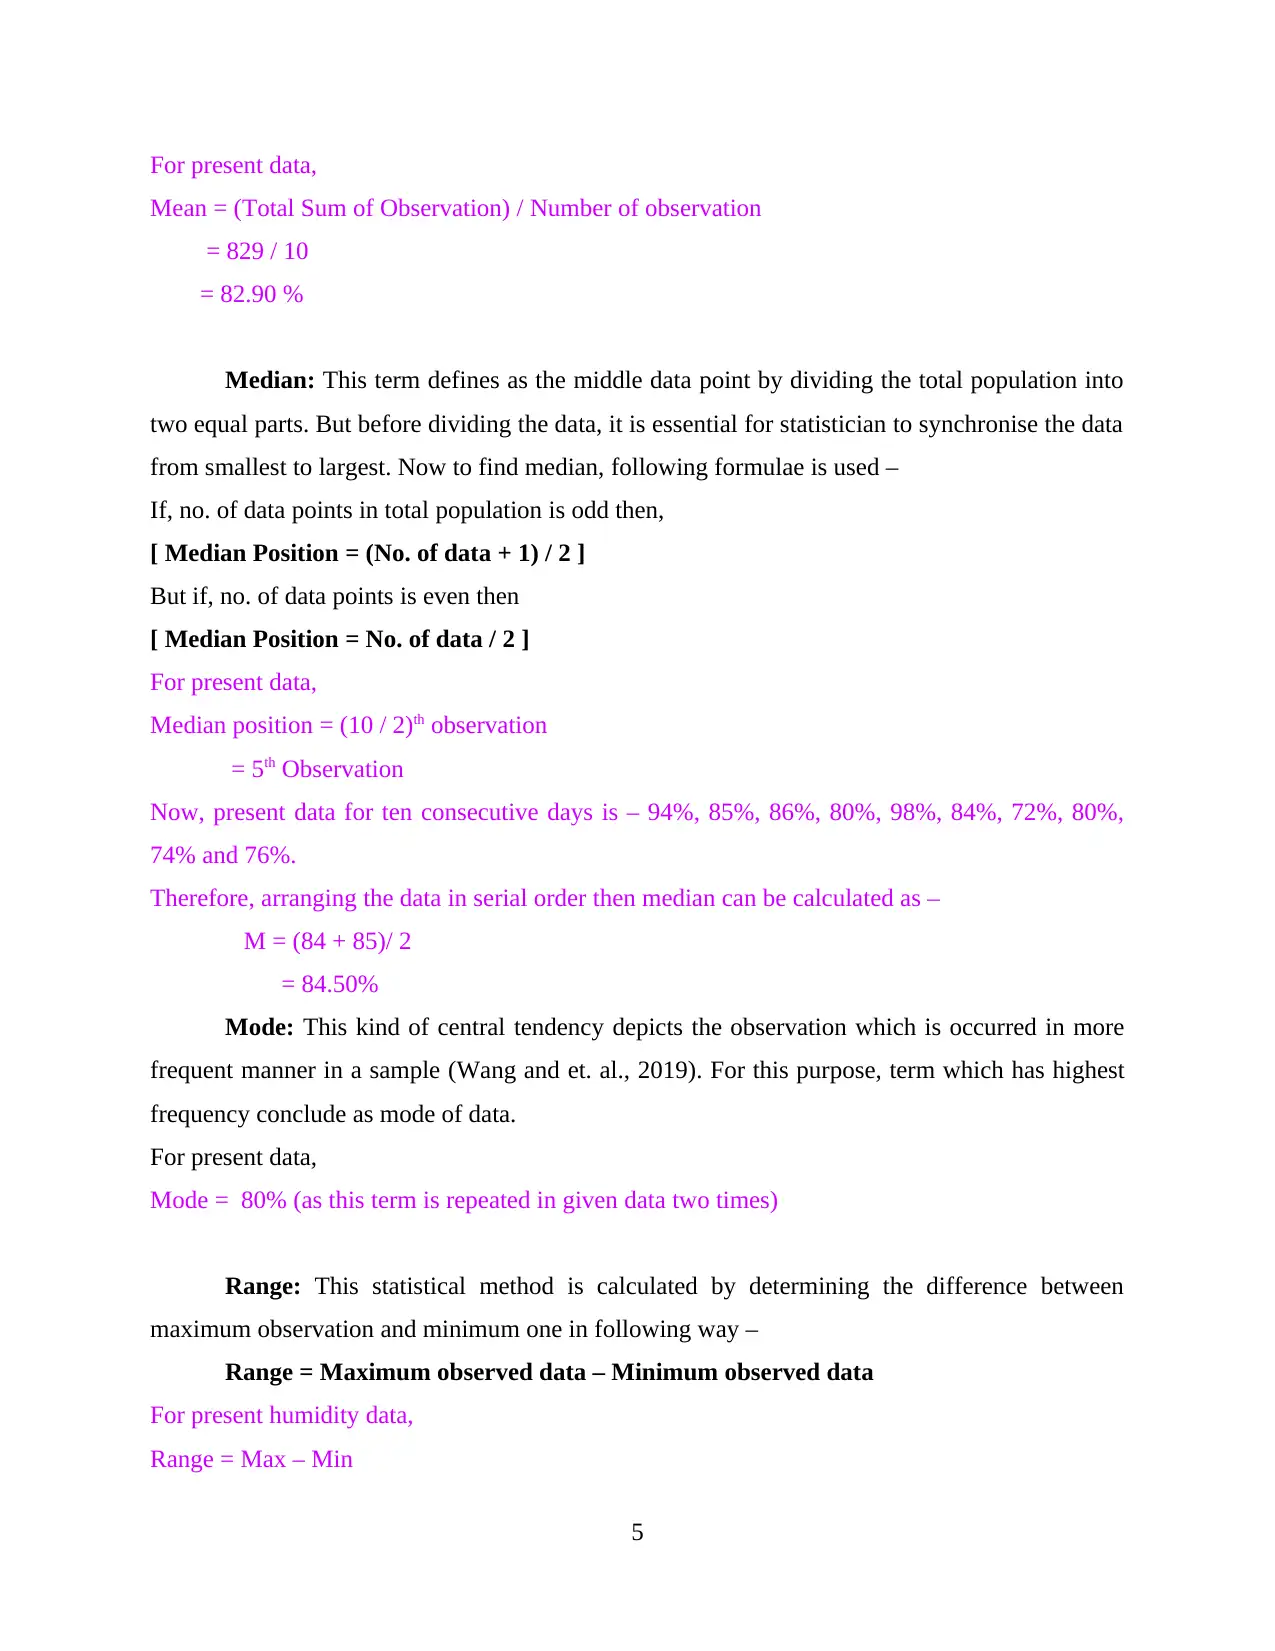
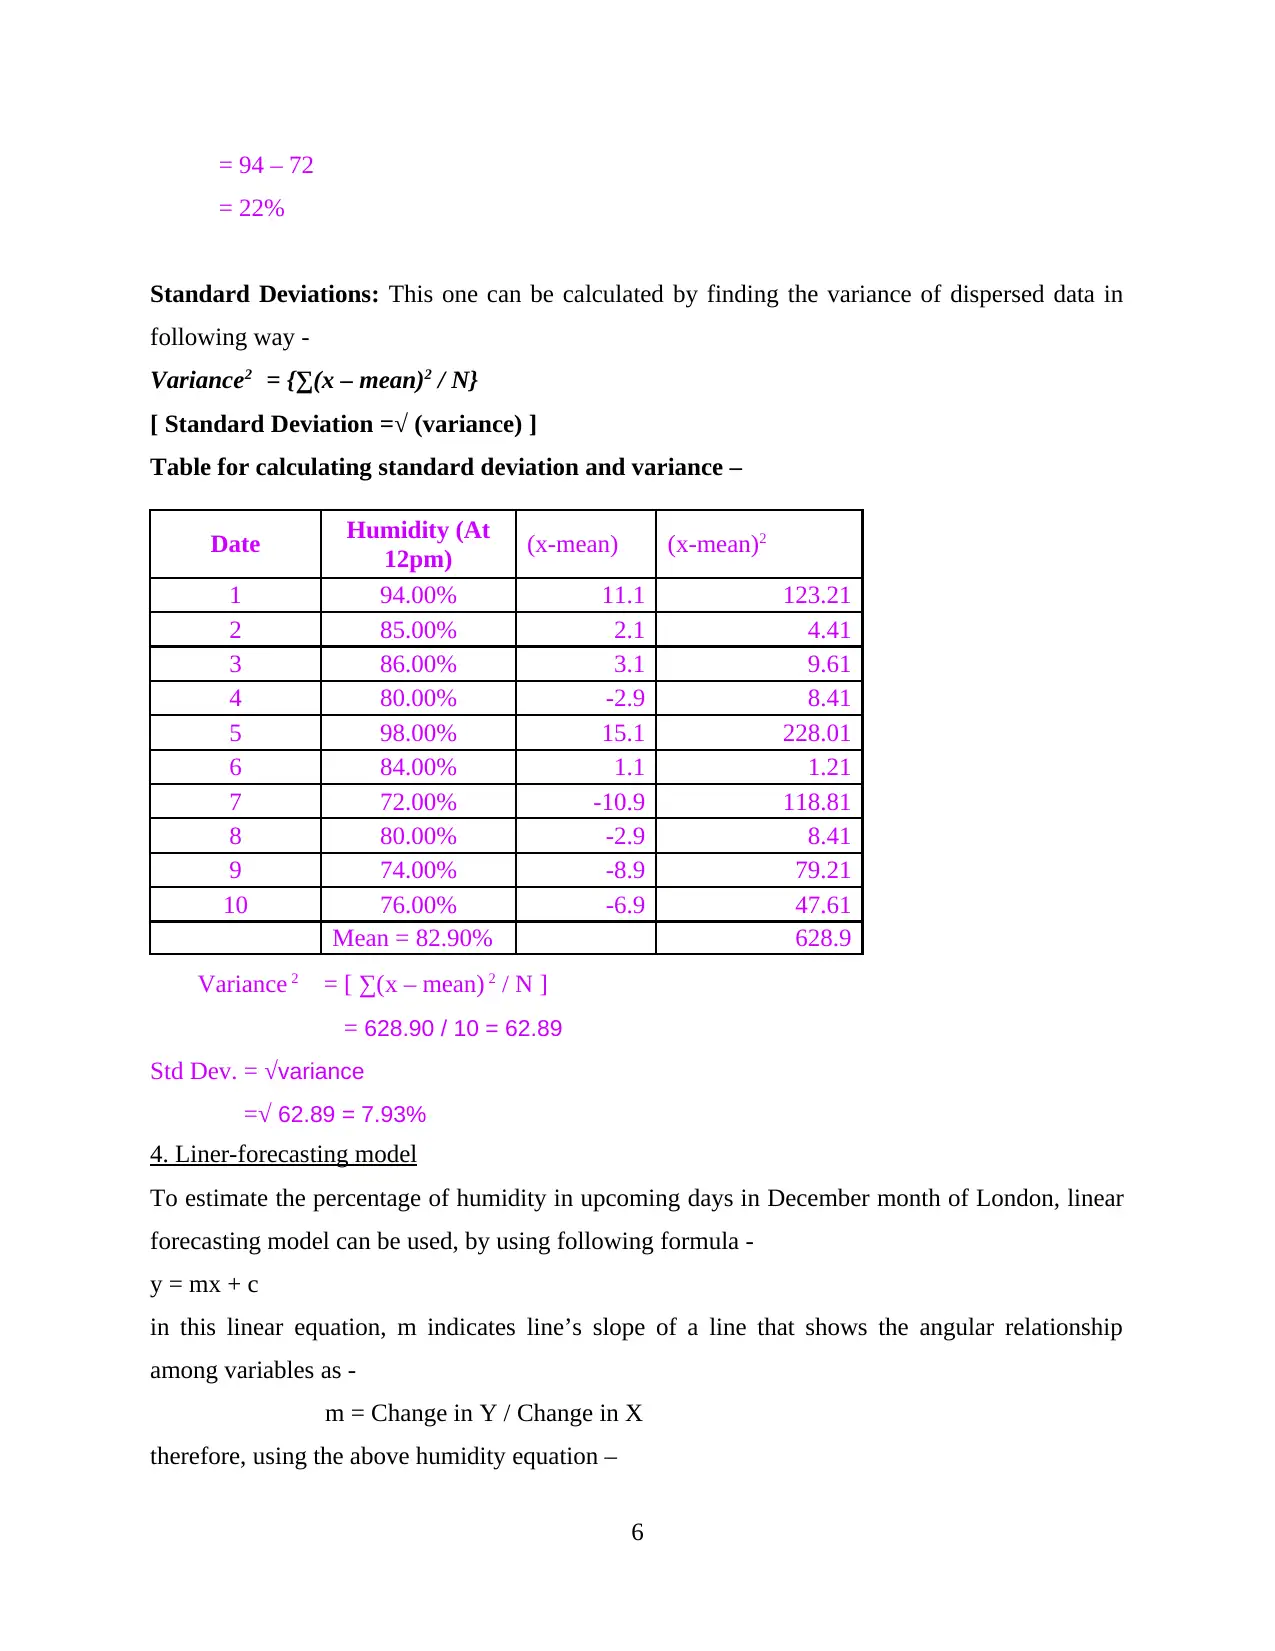
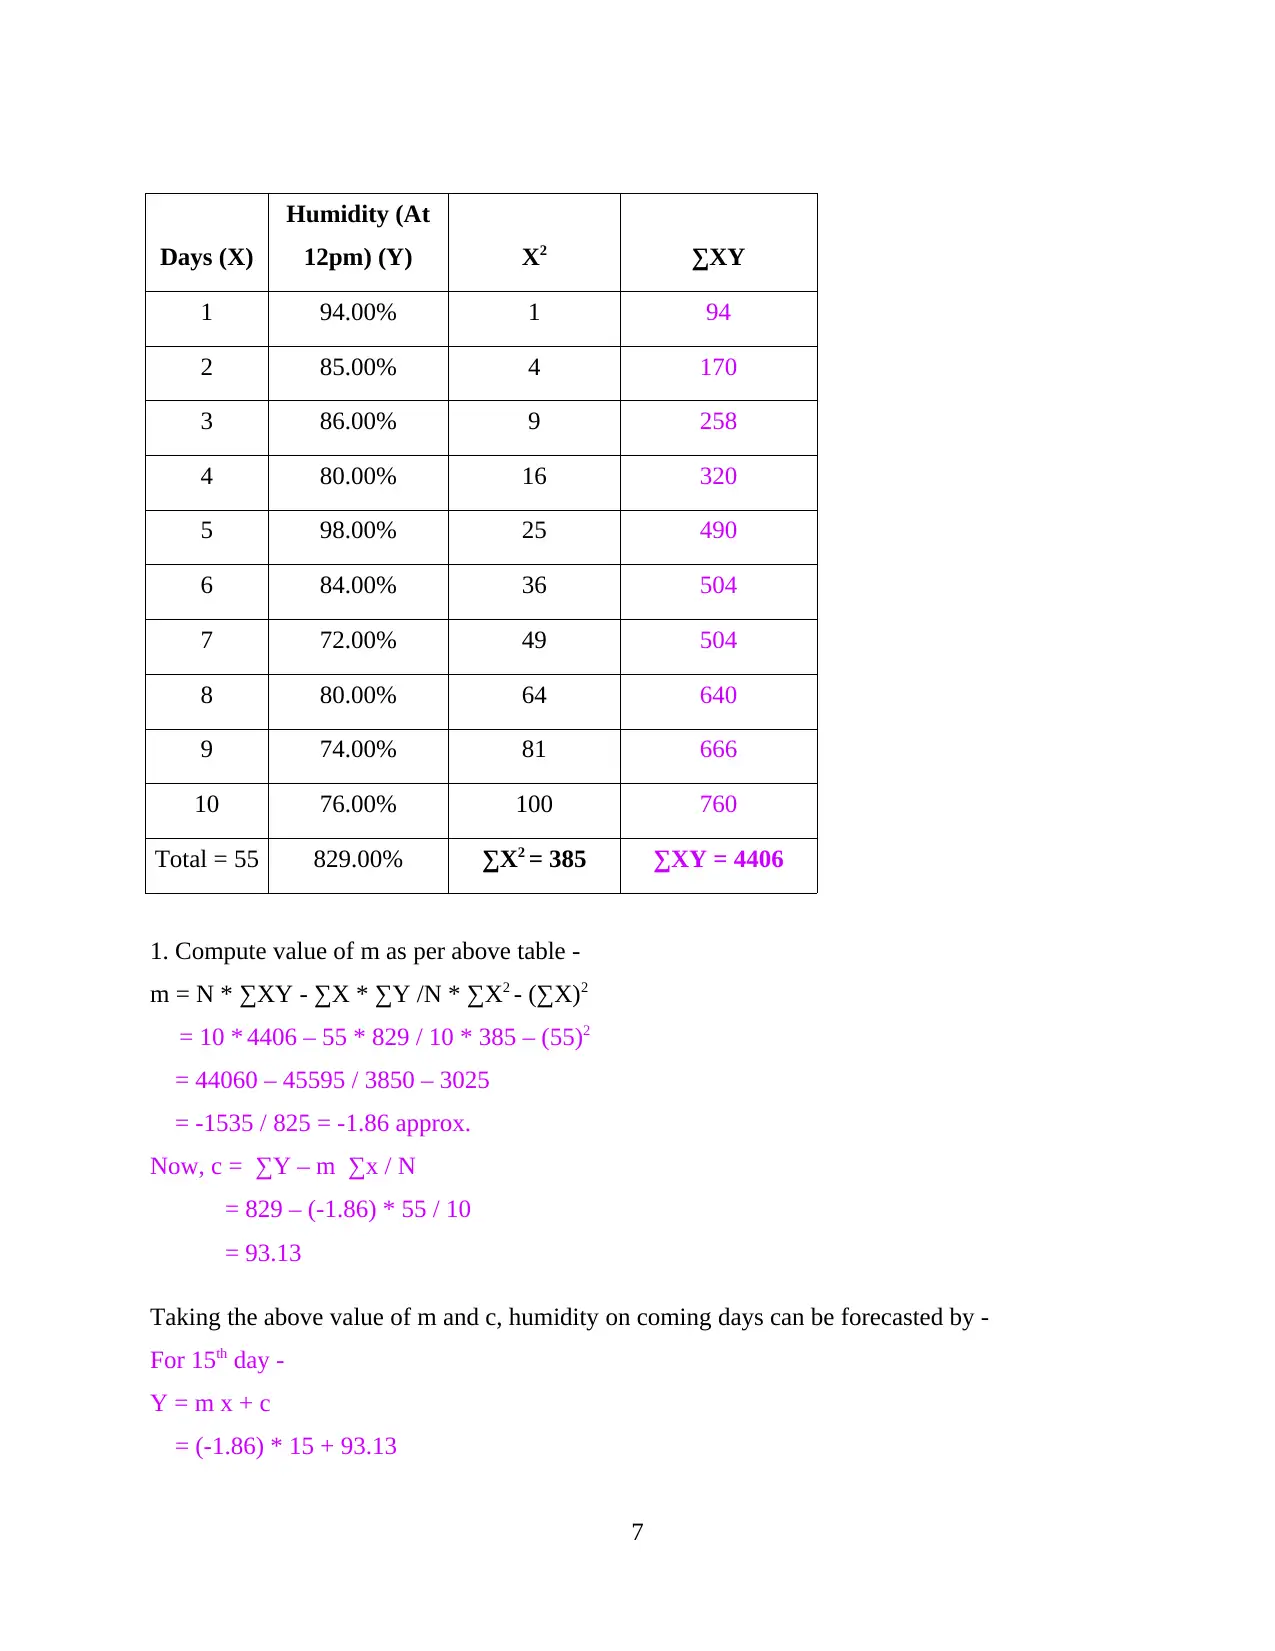
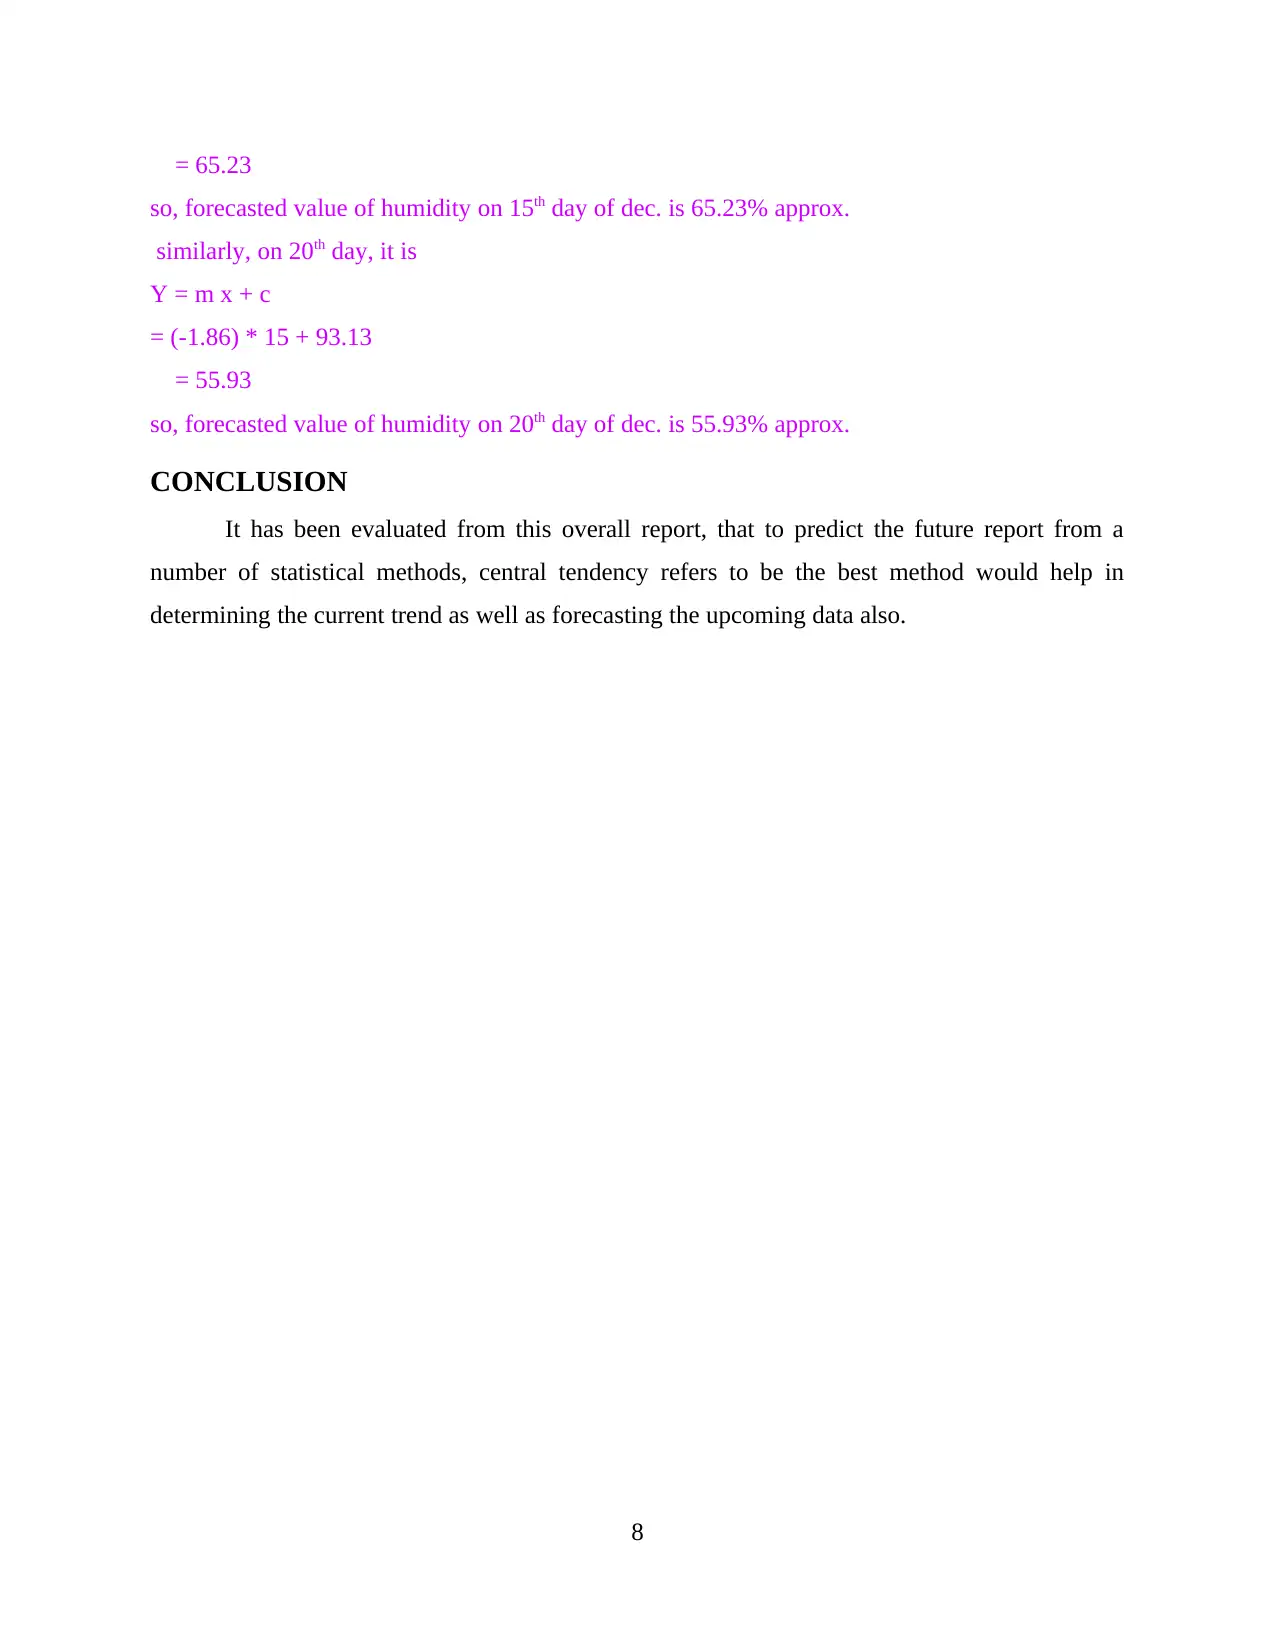
This assignment focuses on the numerical and data analysis of London's humidity, utilizing data from December 2019 to forecast future trends. The analysis begins with a table and graphical representation of the humidity data, followed by detailed calculations of central tendencies, including mean, median, mode, range, and standard deviation. The assignment then applies a linear forecasting model to predict humidity levels for the 15th and 20th days of December. The findings suggest the effectiveness of statistical methods in determining current trends and forecasting future data. The report includes references to relevant books and online resources used for the analysis.
Document Page
Data and Numerical
Analysis
tabler-icon-diamond-filled.svg

Secure Best Marks with AI Grader

Need help grading? Try our AI Grader for instant feedback on your assignments.
Document Page
Table of Contents
INTRODUCTION...........................................................................................................................1
Main Body.......................................................................................................................................1
1. Table Format......................................................................................................................1
2. Graphical representation of weather report........................................................................2
3. Calculation..........................................................................................................................3
4. Liner-forecasting model.....................................................................................................5
CONCLUSION................................................................................................................................7
REFERENCES................................................................................................................................8
Document Page
INTRODUCTION
Numerical and data analysis involves the practical use of statistical or mathematical
calculations to data approximate data of upcoming trend. Mainly, this method is used for
estimation of data related to weather report while maintaining the reasonable as accurate as
possible (Noh, 2019). The current assignment is going to estimate the data about humidity of
London in upcoming days, on the basis of past data of current month. For this purpose, statistical
methods like average, median and mode including range and standard deviations are used for
further analysis of numerical data.
Main Body
For forecasting the upcoming humidity of London the past data from 1st Dec. to 10th Dec.
2019 is taken (Past Weather in London, England, United Kingdom – December 2019). These
data are further represented in both tabular and graphical form to analyse the numerical data in
systematic manner –
1. Table Format
Report of Humidity in atmosphere of London from last consecutive days is gathered (Past
Weather in London, England, United Kingdom – December 2019. As mentioned below -
Days
Humidity
(At 12pm)
1 94%
2 85%
3 86%
4 80%
5 98%
6 84%
7 72%
8 80%
9 74%
1
Document Page
10 76%
2. Graphical representation of weather report
Humidity in London atmosphere from last few days
Days
Humidity
(At 12pm)
1 94%
2 85%
3 86%
4 80%
5 98%
6 84%
7 72%
8 80%
9 74%
10 76%
2
tabler-icon-diamond-filled.svg

Secure Best Marks with AI Grader

Need help grading? Try our AI Grader for instant feedback on your assignments.
Document Page
3. Calculation
Calculation for Humidity in percentage
Days Humidity (At 12pm)
1 94%
2 85%
3
Document Page
3 86%
4 80%
5 98%
6 84%
7 72%
8 80%
9 74%
10 76%
total 829%
mean 82.90%
median 82%
mode 80%
standard
deviation 0.083592929 = 8%
Calculation -
For understanding the humidity of London and getting a detailed information of the same,
the data of past ten days is taken (Eyre, English and Forsythe, 2019). These observations are then
converted into the central tendencies, which include arithmetic mean, median of data, mode,
range as well as standard deviation is calculated in following manner –
Arithmetic Mean: This central tendency can be defined as the average of entire data,
that is calculated by dividing the sum of all observation from the number of observations, using
below formula -
[ Arithmetic Mean/ Average = x / n ]
here, x depicts the total of all data points,
and, n represents the total frequency or number of observation
4
Document Page
For present data,
Mean = (Total Sum of Observation) / Number of observation
= 829 / 10
= 82.90 %
Median: This term defines as the middle data point by dividing the total population into
two equal parts. But before dividing the data, it is essential for statistician to synchronise the data
from smallest to largest. Now to find median, following formulae is used –
If, no. of data points in total population is odd then,
[ Median Position = (No. of data + 1) / 2 ]
But if, no. of data points is even then
[ Median Position = No. of data / 2 ]
For present data,
Median position = (10 / 2)th observation
= 5th Observation
Now, present data for ten consecutive days is – 94%, 85%, 86%, 80%, 98%, 84%, 72%, 80%,
74% and 76%.
Therefore, arranging the data in serial order then median can be calculated as –
M = (84 + 85)/ 2
= 84.50%
Mode: This kind of central tendency depicts the observation which is occurred in more
frequent manner in a sample (Wang and et. al., 2019). For this purpose, term which has highest
frequency conclude as mode of data.
For present data,
Mode = 80% (as this term is repeated in given data two times)
Range: This statistical method is calculated by determining the difference between
maximum observation and minimum one in following way –
Range = Maximum observed data – Minimum observed data
For present humidity data,
Range = Max – Min
5
tabler-icon-diamond-filled.svg

Paraphrase This Document

Need a fresh take? Get an instant paraphrase of this document with our AI Paraphraser
Document Page
= 94 – 72
= 22%
Standard Deviations: This one can be calculated by finding the variance of dispersed data in
following way -
Variance2 = {∑(x – mean)2 / N}
[ Standard Deviation = (variance) ]
Table for calculating standard deviation and variance –
Date Humidity (At
12pm) (x-mean) (x-mean)2
1 94.00% 11.1 123.21
2 85.00% 2.1 4.41
3 86.00% 3.1 9.61
4 80.00% -2.9 8.41
5 98.00% 15.1 228.01
6 84.00% 1.1 1.21
7 72.00% -10.9 118.81
8 80.00% -2.9 8.41
9 74.00% -8.9 79.21
10 76.00% -6.9 47.61
Mean = 82.90% 628.9
Variance 2 = [ ∑(x – mean) 2 / N ]
= 628.90 / 10 = 62.89
Std Dev. = variance
= 62.89 = 7.93%
4. Liner-forecasting model
To estimate the percentage of humidity in upcoming days in December month of London, linear
forecasting model can be used, by using following formula -
y = mx + c
in this linear equation, m indicates line’s slope of a line that shows the angular relationship
among variables as -
m = Change in Y / Change in X
therefore, using the above humidity equation –
6
Document Page
Days (X)
Humidity (At
12pm) (Y) X2 ∑XY
1 94.00% 1 94
2 85.00% 4 170
3 86.00% 9 258
4 80.00% 16 320
5 98.00% 25 490
6 84.00% 36 504
7 72.00% 49 504
8 80.00% 64 640
9 74.00% 81 666
10 76.00% 100 760
Total = 55 829.00% ∑X2 = 385 ∑XY = 4406
1. Compute value of m as per above table -
m = N * ∑XY - ∑X * ∑Y /N * ∑X2 - (∑X)2
= 10 * 4406 – 55 * 829 / 10 * 385 – (55)2
= 44060 – 45595 / 3850 – 3025
= -1535 / 825 = -1.86 approx.
Now, c = ∑Y – m ∑x / N
= 829 – (-1.86) * 55 / 10
= 93.13
Taking the above value of m and c, humidity on coming days can be forecasted by -
For 15th day -
Y = m x + c
= (-1.86) * 15 + 93.13
7
Document Page
= 65.23
so, forecasted value of humidity on 15th day of dec. is 65.23% approx.
similarly, on 20th day, it is
Y = m x + c
= (-1.86) * 15 + 93.13
= 55.93
so, forecasted value of humidity on 20th day of dec. is 55.93% approx.
CONCLUSION
It has been evaluated from this overall report, that to predict the future report from a
number of statistical methods, central tendency refers to be the best method would help in
determining the current trend as well as forecasting the upcoming data also.
8
tabler-icon-diamond-filled.svg

Secure Best Marks with AI Grader

Need help grading? Try our AI Grader for instant feedback on your assignments.
Document Page
REFERENCES
Books and Journals
Noh, H. M., 2019. Numerical analysis of aerodynamic noise from pantograph in high-speed
trains using lattice Boltzmann method. Advances in Mechanical Engineering. 11(7).
p.1687814019863995.
Wang, Y. and et. al., 2019. Test of a Weather-Adaptive Dual-Resolution Hybrid Warn-on-
Forecast Analysis and Forecast System for Several Severe Weather Events. Weather and
Forecasting. 34(6). pp.1807-1827.
Eyre, J. R., English, S. J. and Forsythe, M., 2019. Assimilation of satellite data in numerical
weather prediction. Part I: the early years. Quarterly Journal of the Royal
Meteorological Society.
Online
Past Weather in London, England, United Kingdom – December 2019. [Online] Available
Through: (https://www.timeanddate.com/weather/uk/london/historic?
month=12&year=2019)
(<https://www.timeanddate.com/weather/uk/london/historic?month=12&year=2019>.
9
chevron_up_icon
1 out of 11
circle_padding
hide_on_mobile
zoom_out_icon
[object Object]