Analysis of London Wind Speed Data: Numeracy and Data Analysis Report

Verified

Added on  2021/02/19

|9
|1408
|134
Report
AI Summary
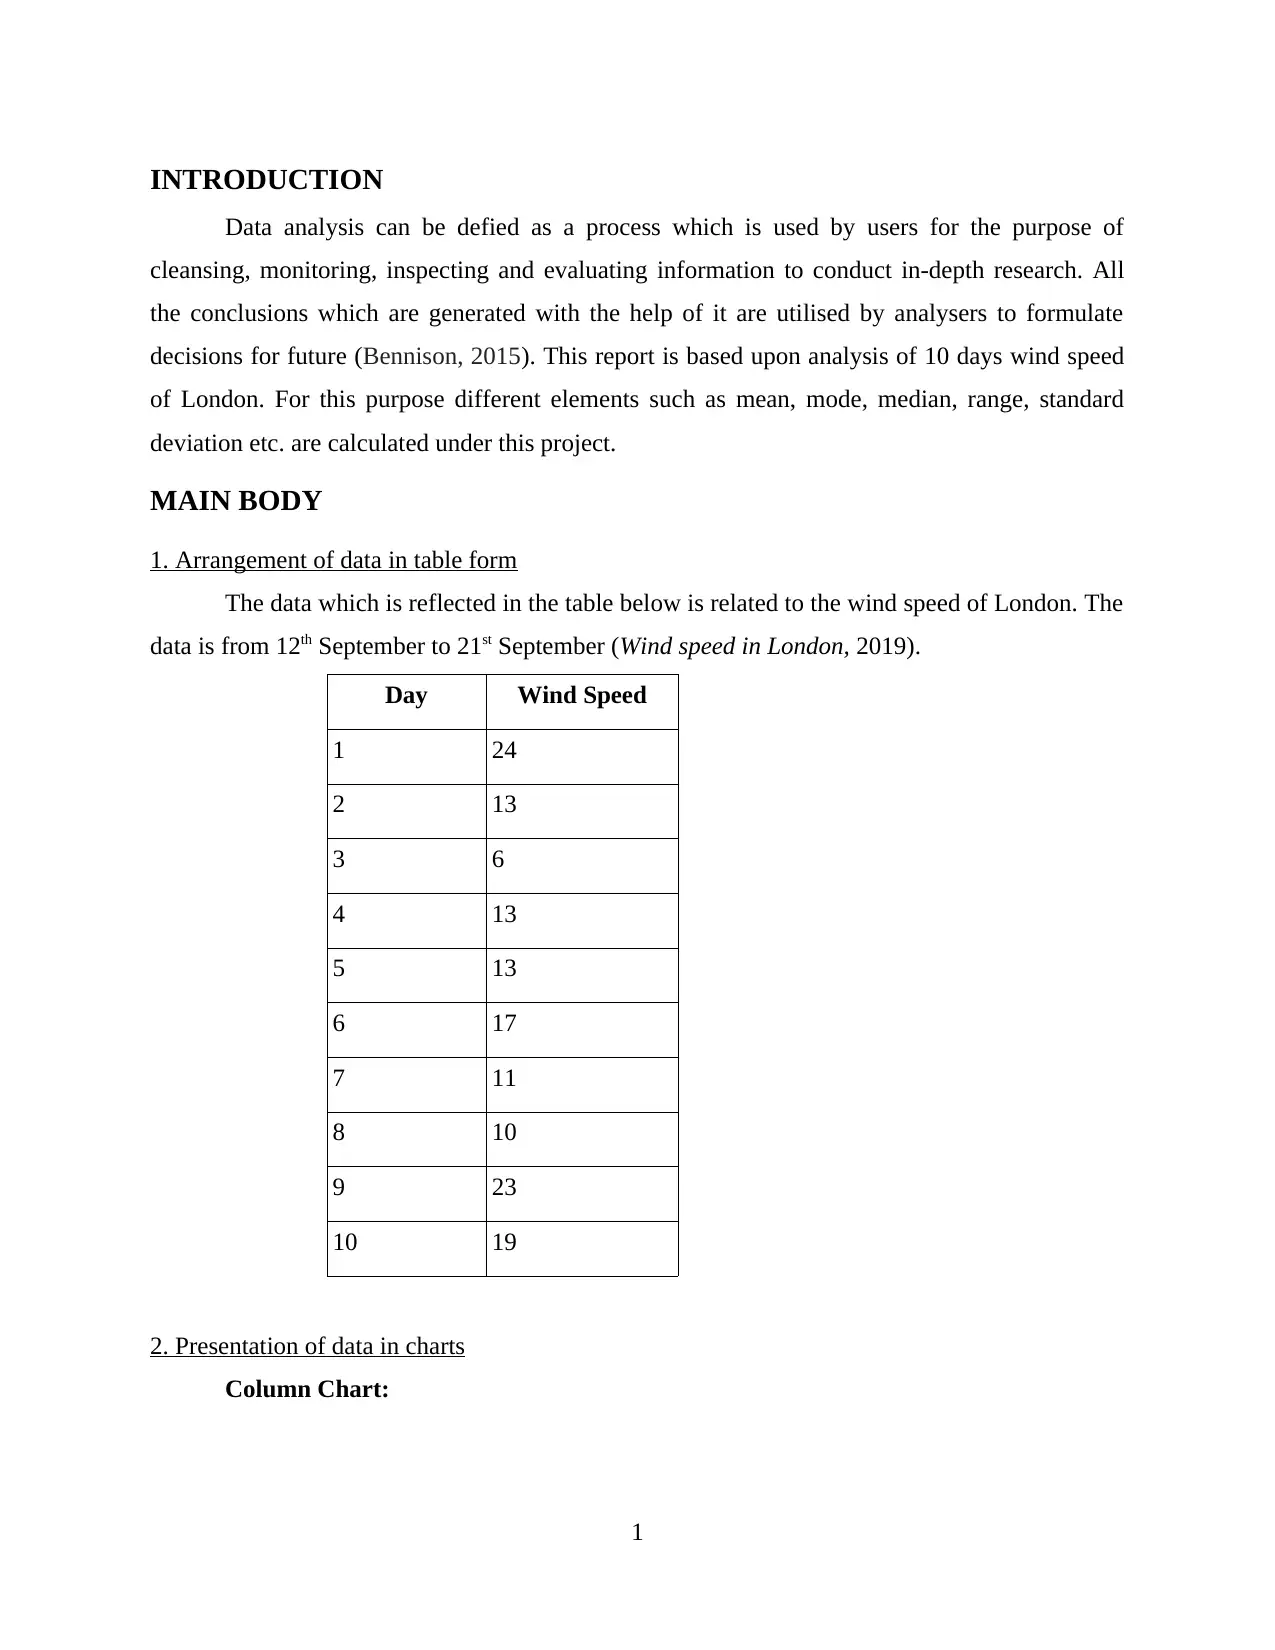
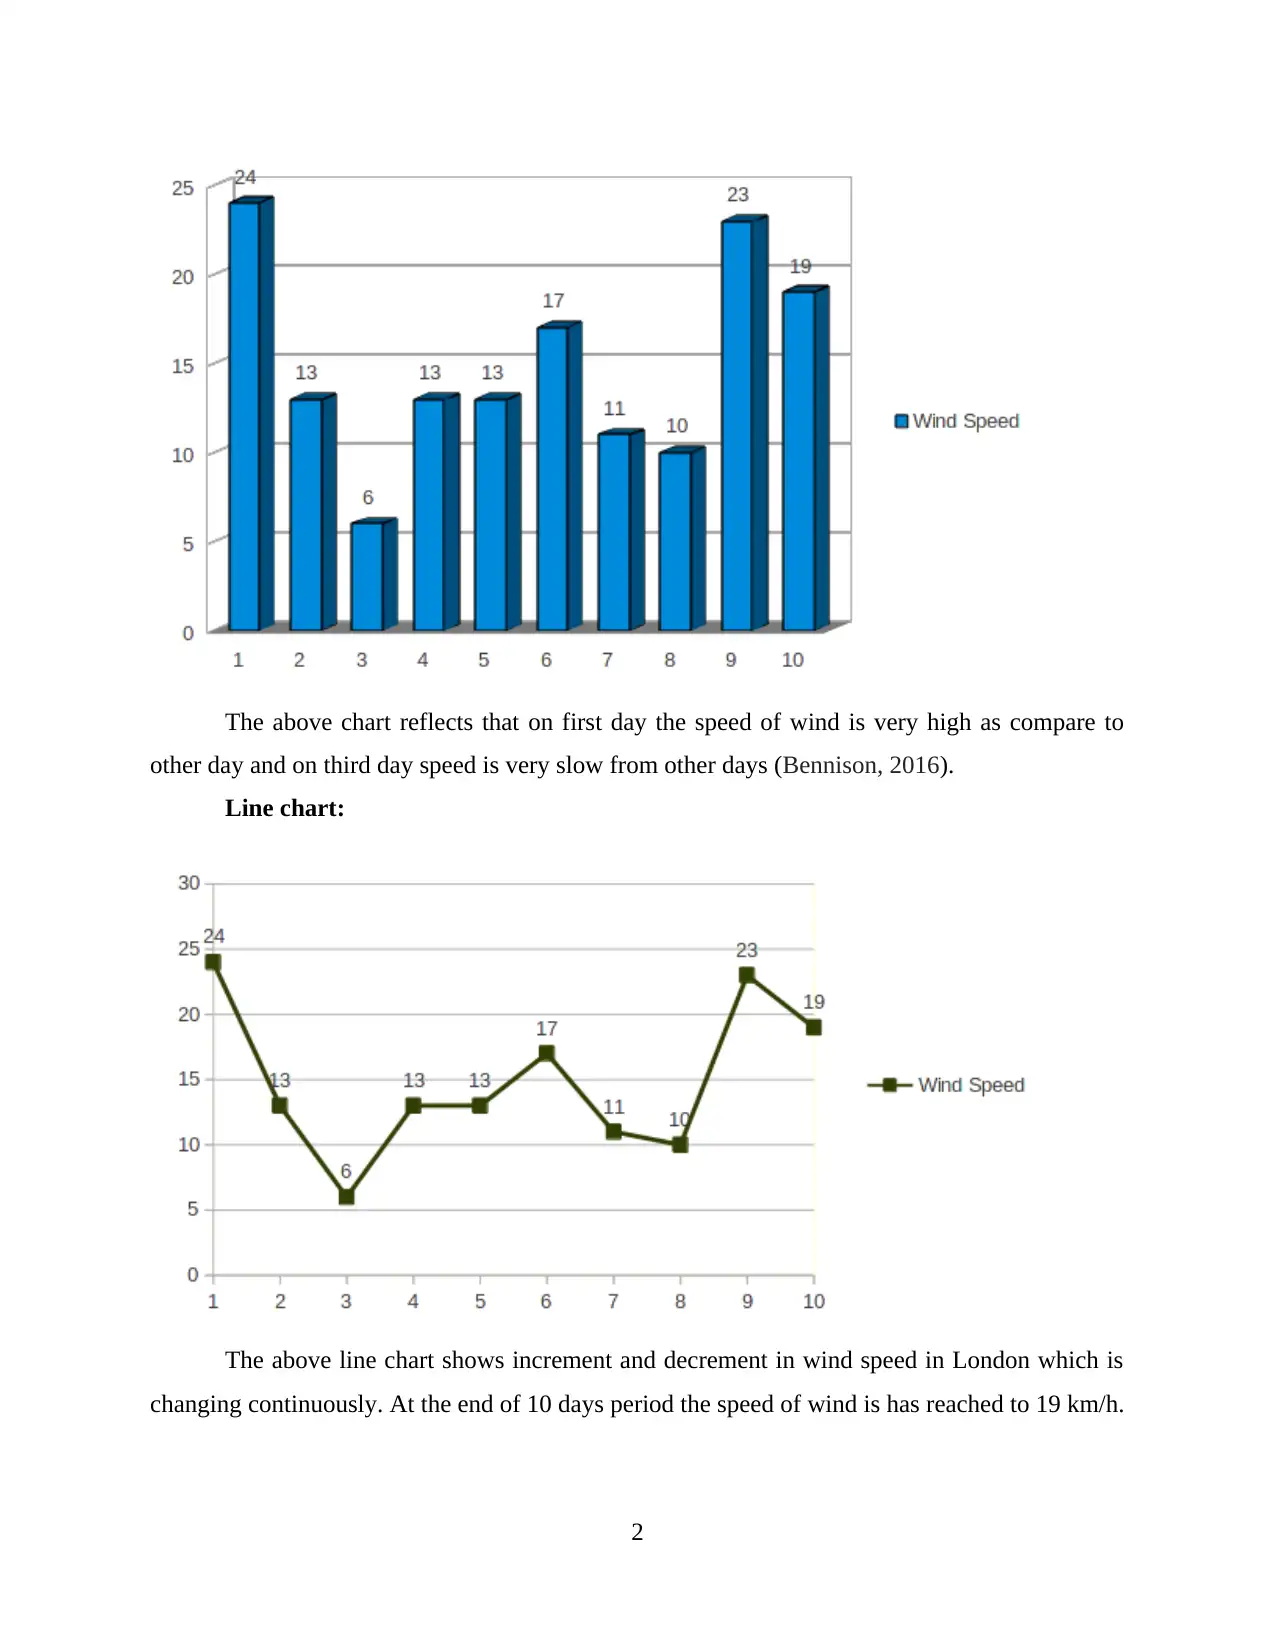
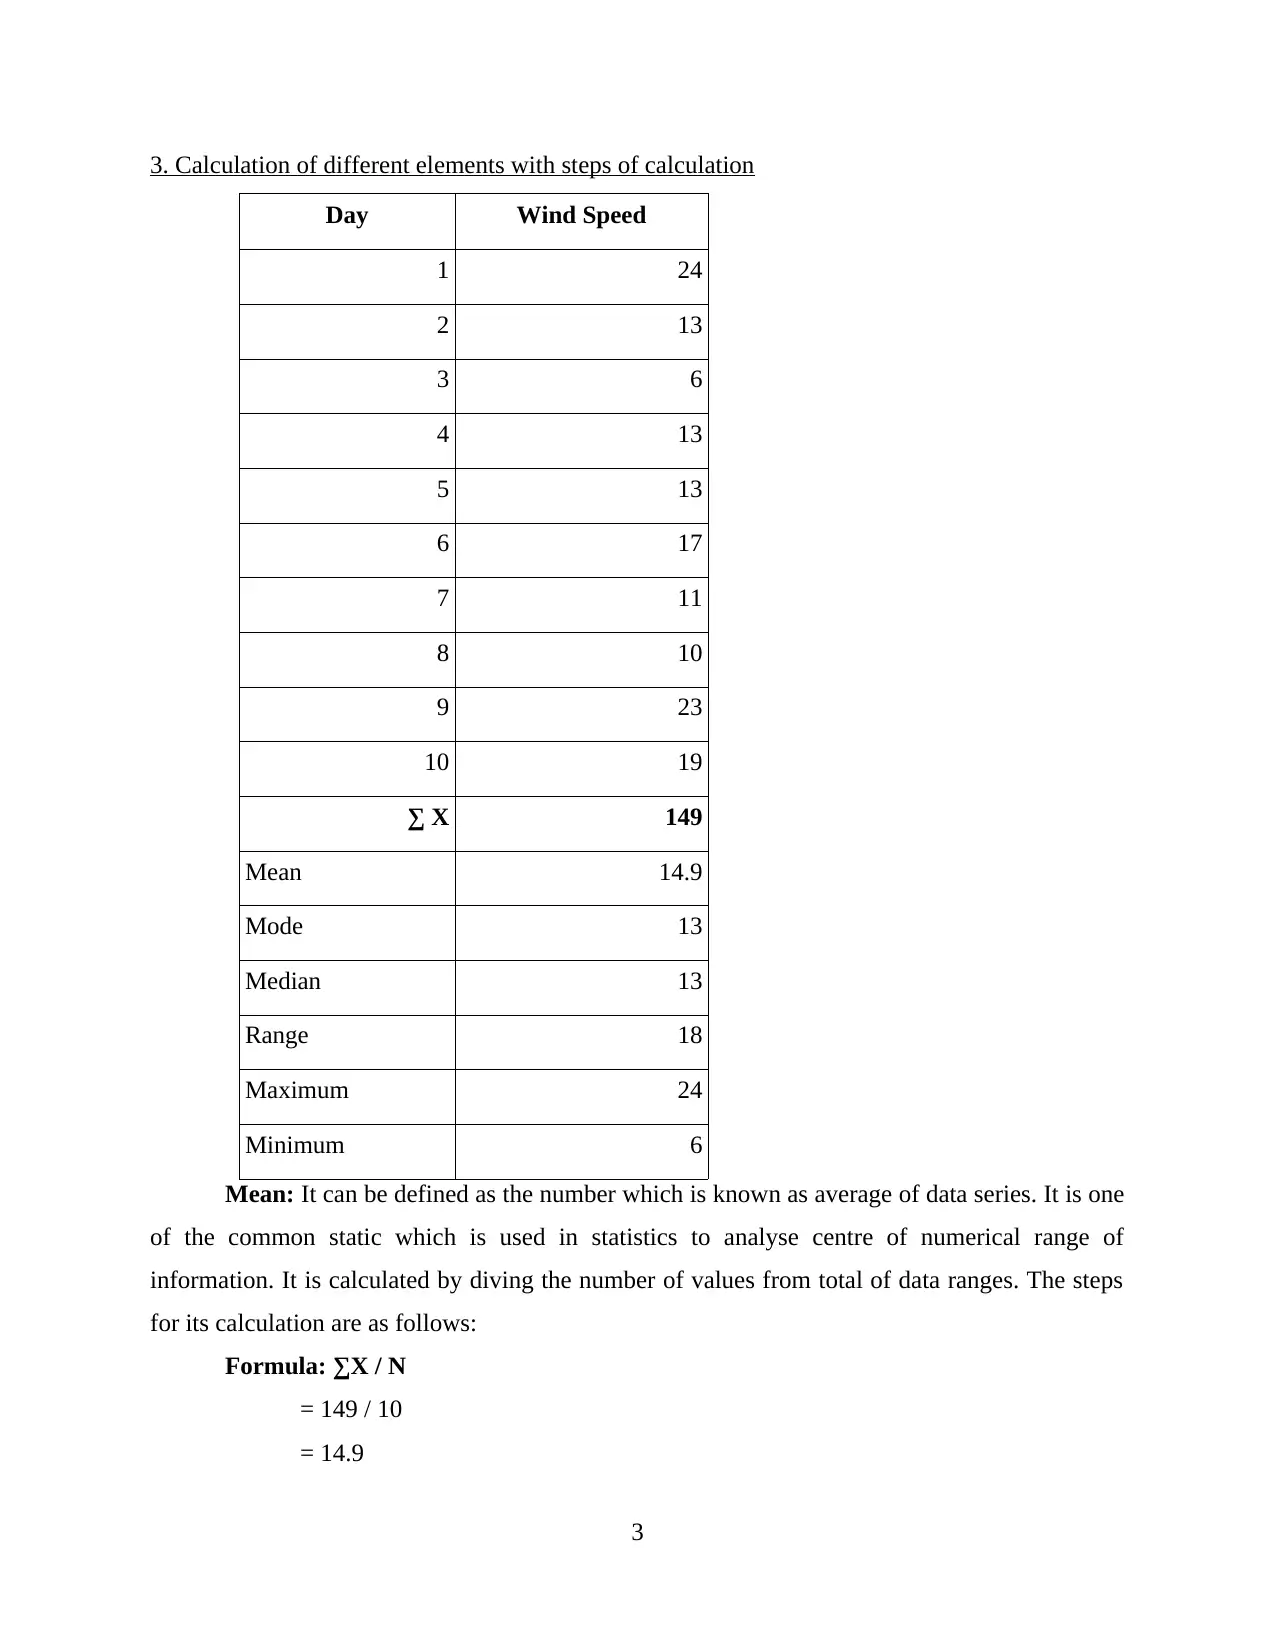
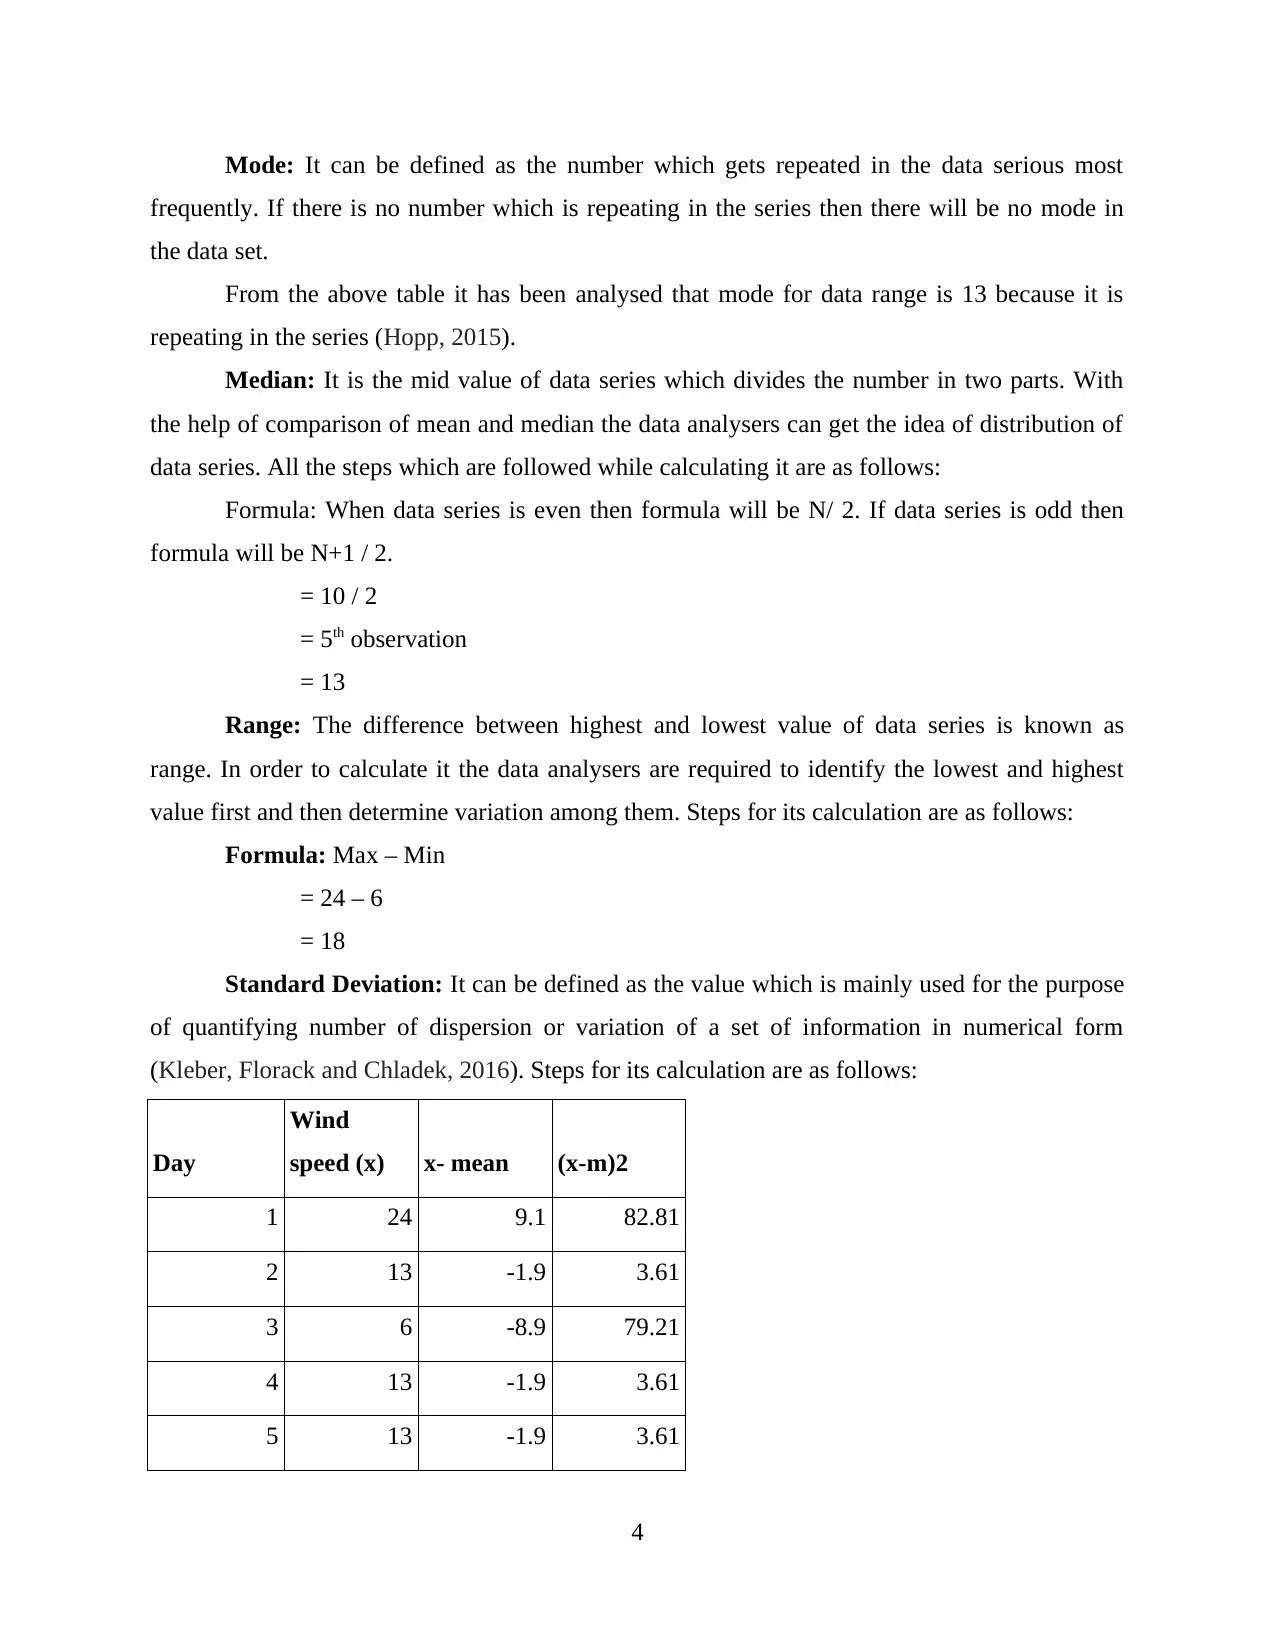
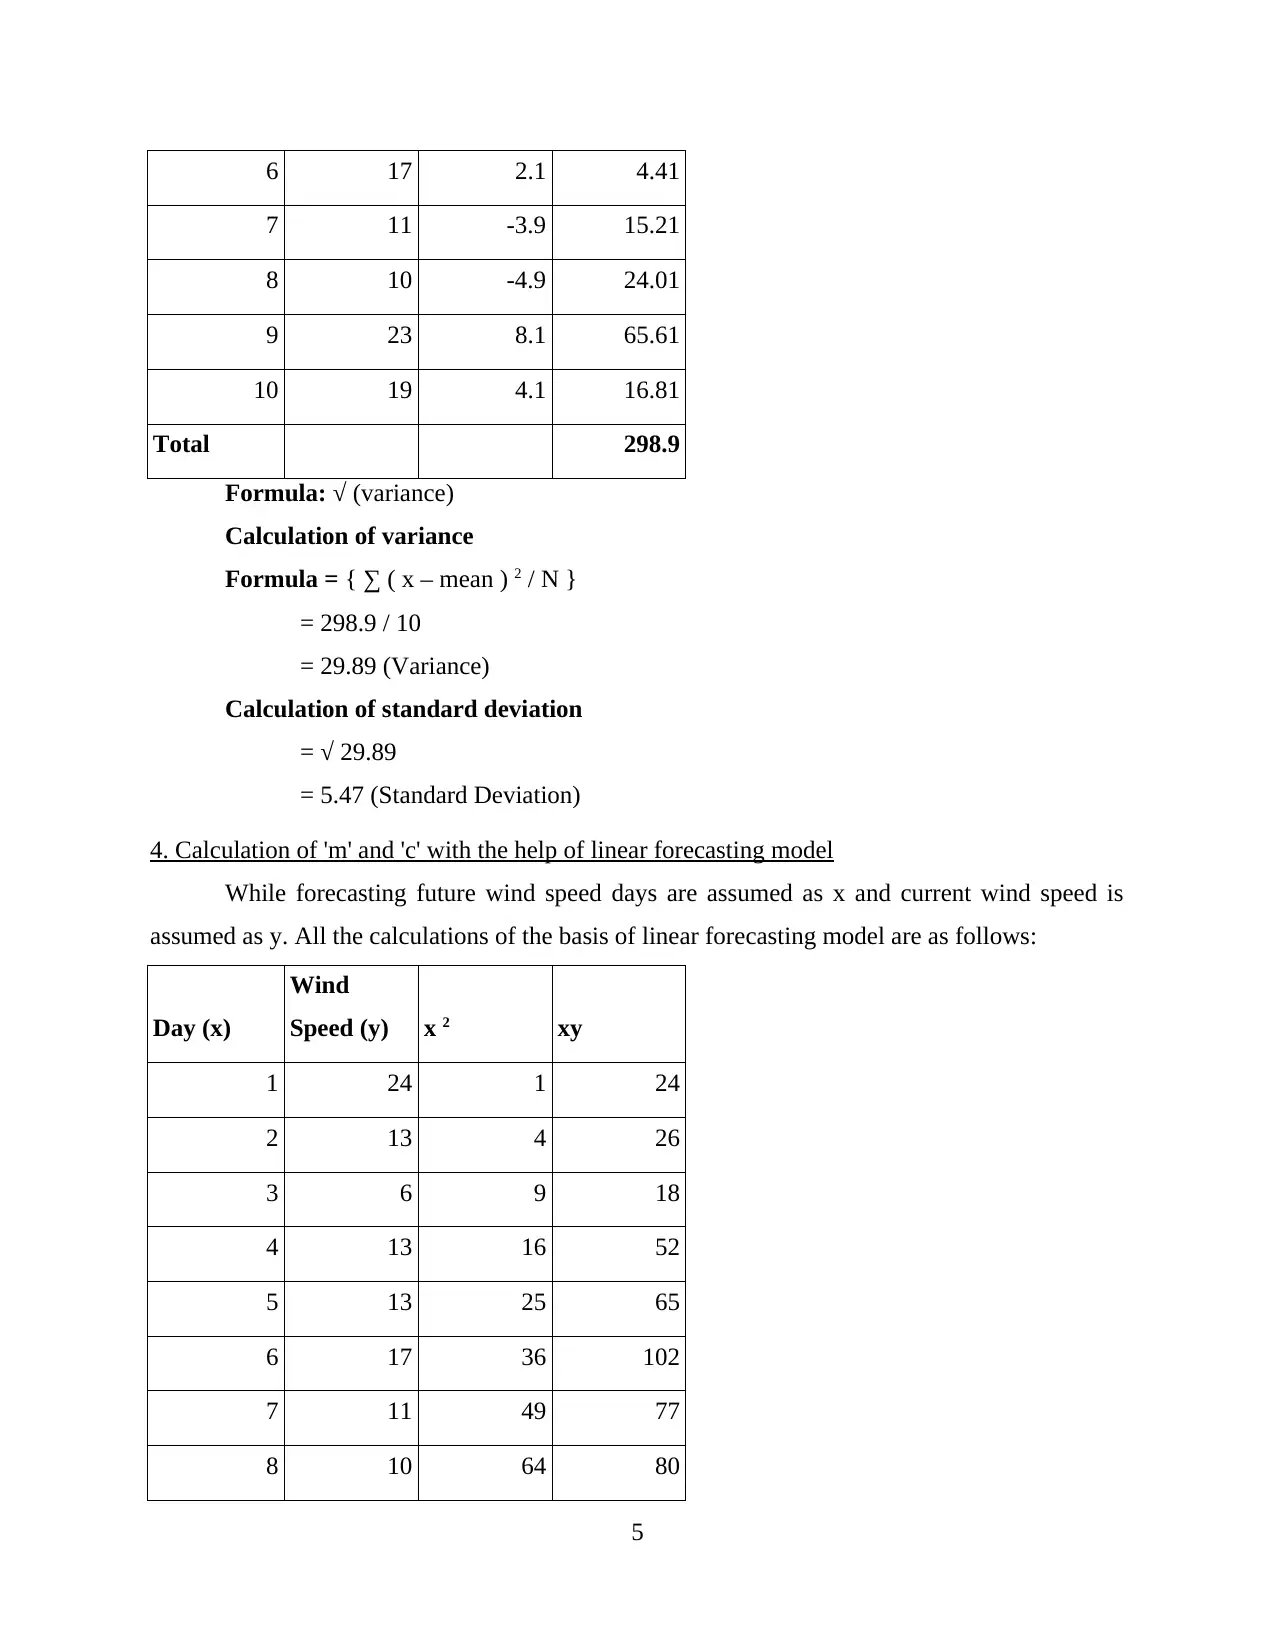
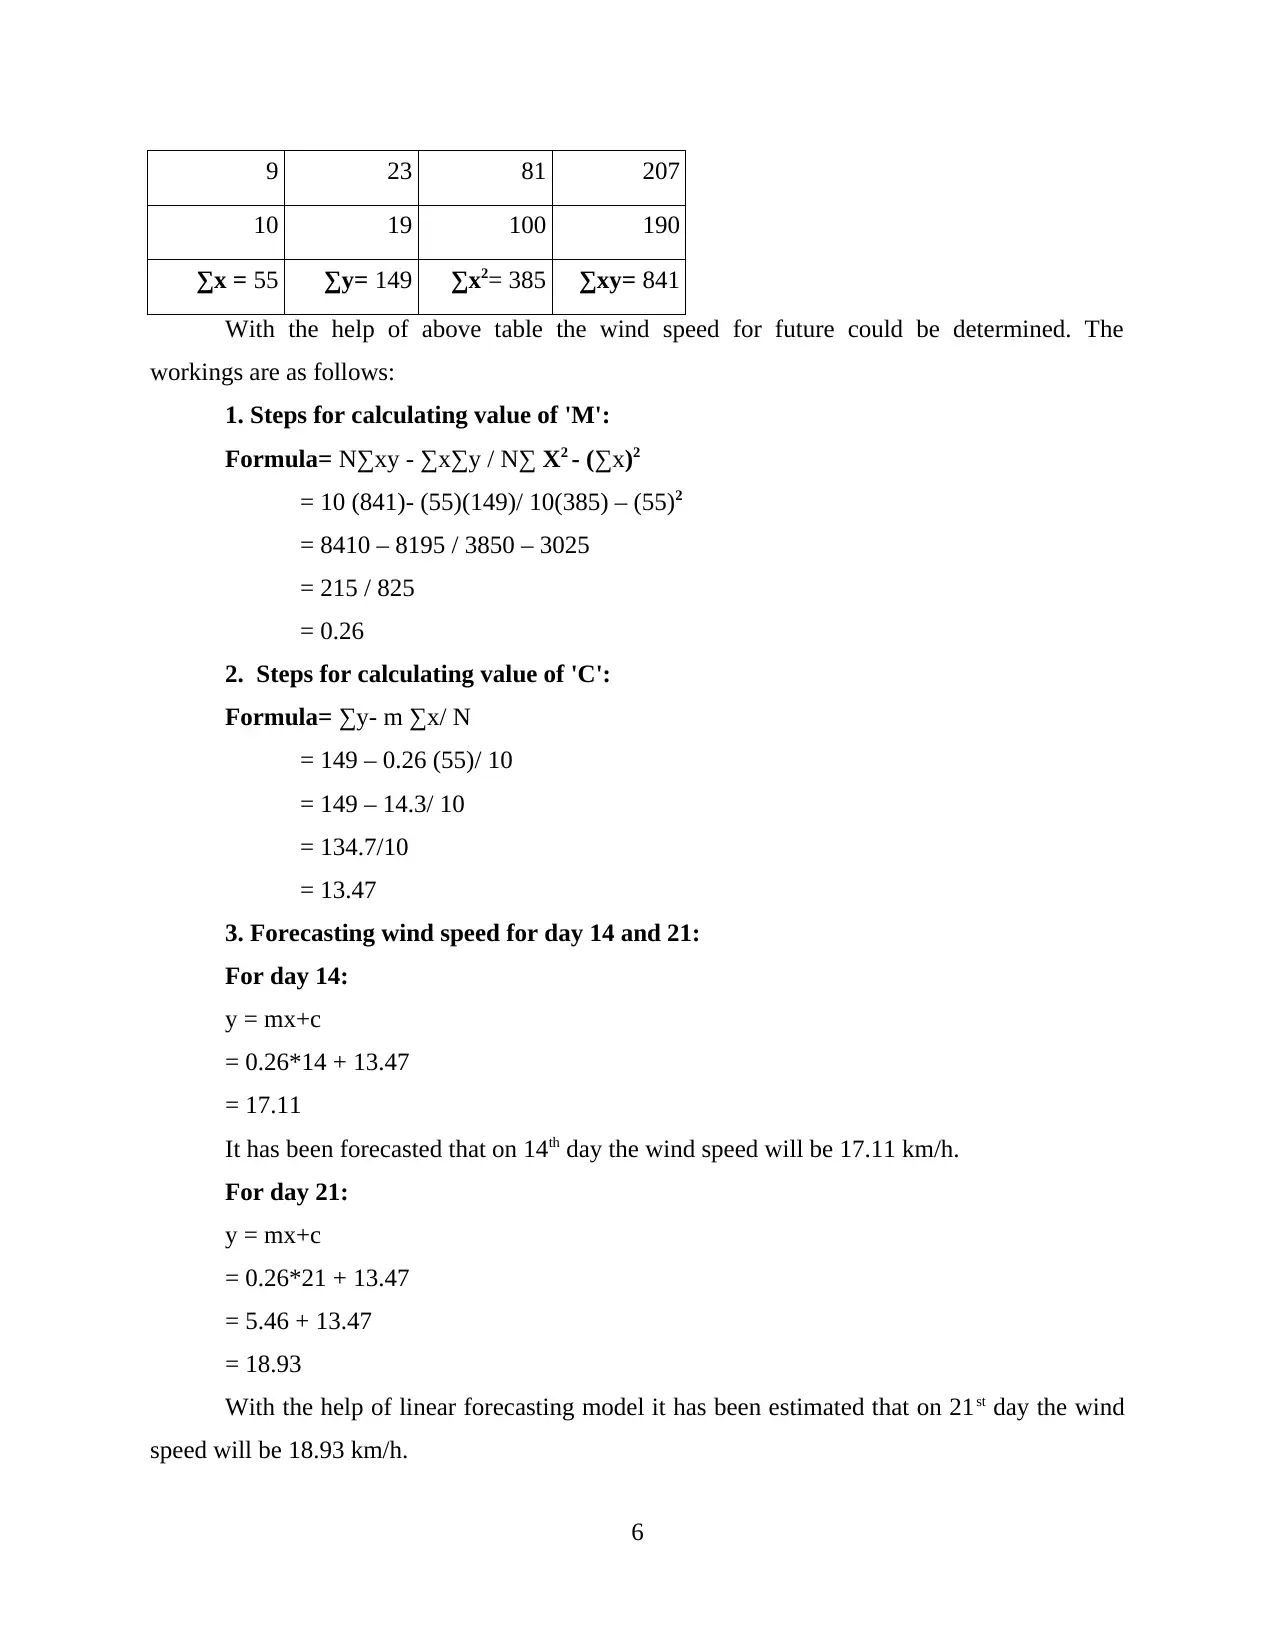
This report presents a data analysis of London wind speed from September 12th to 21st. The analysis begins with the arrangement of wind speed data in a table format. It then proceeds to visually represent the data using column and line charts, illustrating the fluctuations in wind speed over the ten-day period. The core of the report involves the calculation of various statistical elements, including mean, mode, median, range, and standard deviation, with detailed steps provided for each calculation. Furthermore, the report employs a linear forecasting model to predict future wind speeds, calculating the values of 'm' and 'c' to forecast wind speeds for days 14 and 21. The report concludes with a summary of the findings and references relevant sources.
Document Page
Numeracy and
Data Analysis
tabler-icon-diamond-filled.svg

Secure Best Marks with AI Grader

Need help grading? Try our AI Grader for instant feedback on your assignments.
Document Page
Table of Contents
INTRODUCTION...........................................................................................................................1
MAIN BODY...................................................................................................................................1
1. Arrangement of data in table form...........................................................................................1
2. Presentation of data in charts...................................................................................................1
3. Calculation of different elements with steps of calculation.....................................................3
4. Calculation of 'm' and 'c' with the help of linear forecasting model........................................5
CONCLUSION................................................................................................................................6
REFERENCES................................................................................................................................7
Document Page
INTRODUCTION
Data analysis can be defied as a process which is used by users for the purpose of
cleansing, monitoring, inspecting and evaluating information to conduct in-depth research. All
the conclusions which are generated with the help of it are utilised by analysers to formulate
decisions for future (Bennison, 2015). This report is based upon analysis of 10 days wind speed
of London. For this purpose different elements such as mean, mode, median, range, standard
deviation etc. are calculated under this project.
MAIN BODY
1. Arrangement of data in table form
The data which is reflected in the table below is related to the wind speed of London. The
data is from 12th September to 21st September (Wind speed in London, 2019).
Day Wind Speed
1 24
2 13
3 6
4 13
5 13
6 17
7 11
8 10
9 23
10 19
2. Presentation of data in charts
Column Chart:
1
Document Page
The above chart reflects that on first day the speed of wind is very high as compare to
other day and on third day speed is very slow from other days (Bennison, 2016).
Line chart:
The above line chart shows increment and decrement in wind speed in London which is
changing continuously. At the end of 10 days period the speed of wind is has reached to 19 km/h.
2
tabler-icon-diamond-filled.svg

Secure Best Marks with AI Grader

Need help grading? Try our AI Grader for instant feedback on your assignments.
Document Page
3. Calculation of different elements with steps of calculation
Day Wind Speed
1 24
2 13
3 6
4 13
5 13
6 17
7 11
8 10
9 23
10 19
X 149
Mean 14.9
Mode 13
Median 13
Range 18
Maximum 24
Minimum 6
Mean: It can be defined as the number which is known as average of data series. It is one
of the common static which is used in statistics to analyse centre of numerical range of
information. It is calculated by diving the number of values from total of data ranges. The steps
for its calculation are as follows:
Formula: ∑X / N
= 149 / 10
= 14.9
3
Document Page
Mode: It can be defined as the number which gets repeated in the data serious most
frequently. If there is no number which is repeating in the series then there will be no mode in
the data set.
From the above table it has been analysed that mode for data range is 13 because it is
repeating in the series (Hopp, 2015).
Median: It is the mid value of data series which divides the number in two parts. With
the help of comparison of mean and median the data analysers can get the idea of distribution of
data series. All the steps which are followed while calculating it are as follows:
Formula: When data series is even then formula will be N/ 2. If data series is odd then
formula will be N+1 / 2.
= 10 / 2
= 5th observation
= 13
Range: The difference between highest and lowest value of data series is known as
range. In order to calculate it the data analysers are required to identify the lowest and highest
value first and then determine variation among them. Steps for its calculation are as follows:
Formula: Max – Min
= 24 – 6
= 18
Standard Deviation: It can be defined as the value which is mainly used for the purpose
of quantifying number of dispersion or variation of a set of information in numerical form
(Kleber, Florack and Chladek, 2016). Steps for its calculation are as follows:
Day
Wind
speed (x) x- mean (x-m)2
1 24 9.1 82.81
2 13 -1.9 3.61
3 6 -8.9 79.21
4 13 -1.9 3.61
5 13 -1.9 3.61
4
Document Page
6 17 2.1 4.41
7 11 -3.9 15.21
8 10 -4.9 24.01
9 23 8.1 65.61
10 19 4.1 16.81
Total 298.9
Formula: √ (variance)
Calculation of variance
Formula = { ∑ ( x – mean ) 2 / N }
= 298.9 / 10
= 29.89 (Variance)
Calculation of standard deviation
= √ 29.89
= 5.47 (Standard Deviation)
4. Calculation of 'm' and 'c' with the help of linear forecasting model
While forecasting future wind speed days are assumed as x and current wind speed is
assumed as y. All the calculations of the basis of linear forecasting model are as follows:
Day (x)
Wind
Speed (y) x 2 xy
1 24 1 24
2 13 4 26
3 6 9 18
4 13 16 52
5 13 25 65
6 17 36 102
7 11 49 77
8 10 64 80
5
tabler-icon-diamond-filled.svg

Paraphrase This Document

Need a fresh take? Get an instant paraphrase of this document with our AI Paraphraser
Document Page
9 23 81 207
10 19 100 190
∑x = 55 ∑y= 149 x2= 385 ∑xy= 841
With the help of above table the wind speed for future could be determined. The
workings are as follows:
1. Steps for calculating value of 'M':
Formula= N∑xy - ∑x∑y / N∑ X2 - (∑x)2
= 10 (841)- (55)(149)/ 10(385) – (55)2
= 8410 – 8195 / 3850 – 3025
= 215 / 825
= 0.26
2. Steps for calculating value of 'C':
Formula= ∑y- m ∑x/ N
= 149 – 0.26 (55)/ 10
= 149 – 14.3/ 10
= 134.7/10
= 13.47
3. Forecasting wind speed for day 14 and 21:
For day 14:
y = mx+c
= 0.26*14 + 13.47
= 17.11
It has been forecasted that on 14th day the wind speed will be 17.11 km/h.
For day 21:
y = mx+c
= 0.26*21 + 13.47
= 5.46 + 13.47
= 18.93
With the help of linear forecasting model it has been estimated that on 21st day the wind
speed will be 18.93 km/h.
6
Document Page
CONCLUSION
The above report concludes that data analysis is a process which is used by analysers for
the purpose of monitoring the set of numerical information in detail. For this purpose different
charts such as line, column could be used. Along with this, various elements such as mean,
mode, median, range and standard deviation are also calculated in data analysis.
7
chevron_up_icon
1 out of 9
circle_padding
hide_on_mobile
zoom_out_icon
logo.png

Your All-in-One AI-Powered Toolkit for Academic Success.

Available 24*7 on WhatsApp / Email

[object Object]