Comprehensive Data Analysis and Forecasting Project: London Wind Speed
VerifiedAdded on 2021/02/20
|8
|950
|225
Project
AI Summary
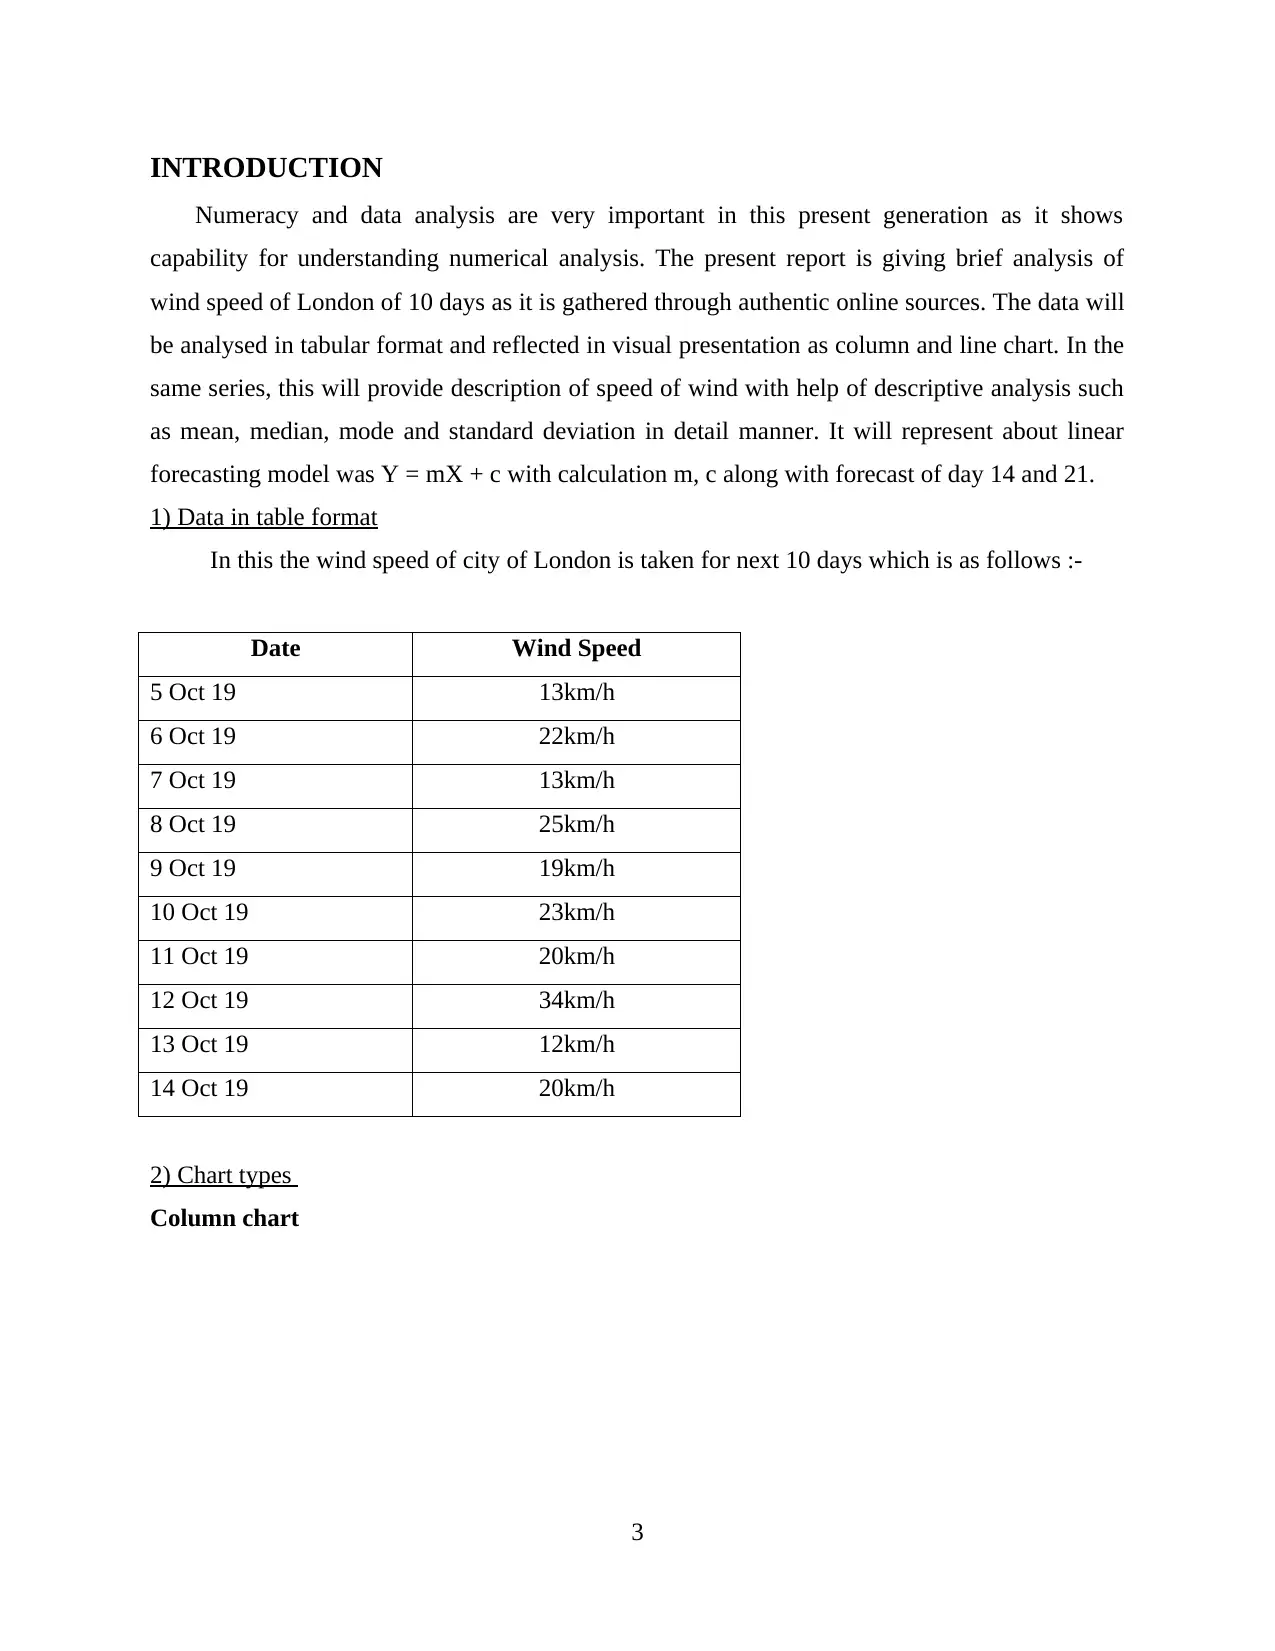
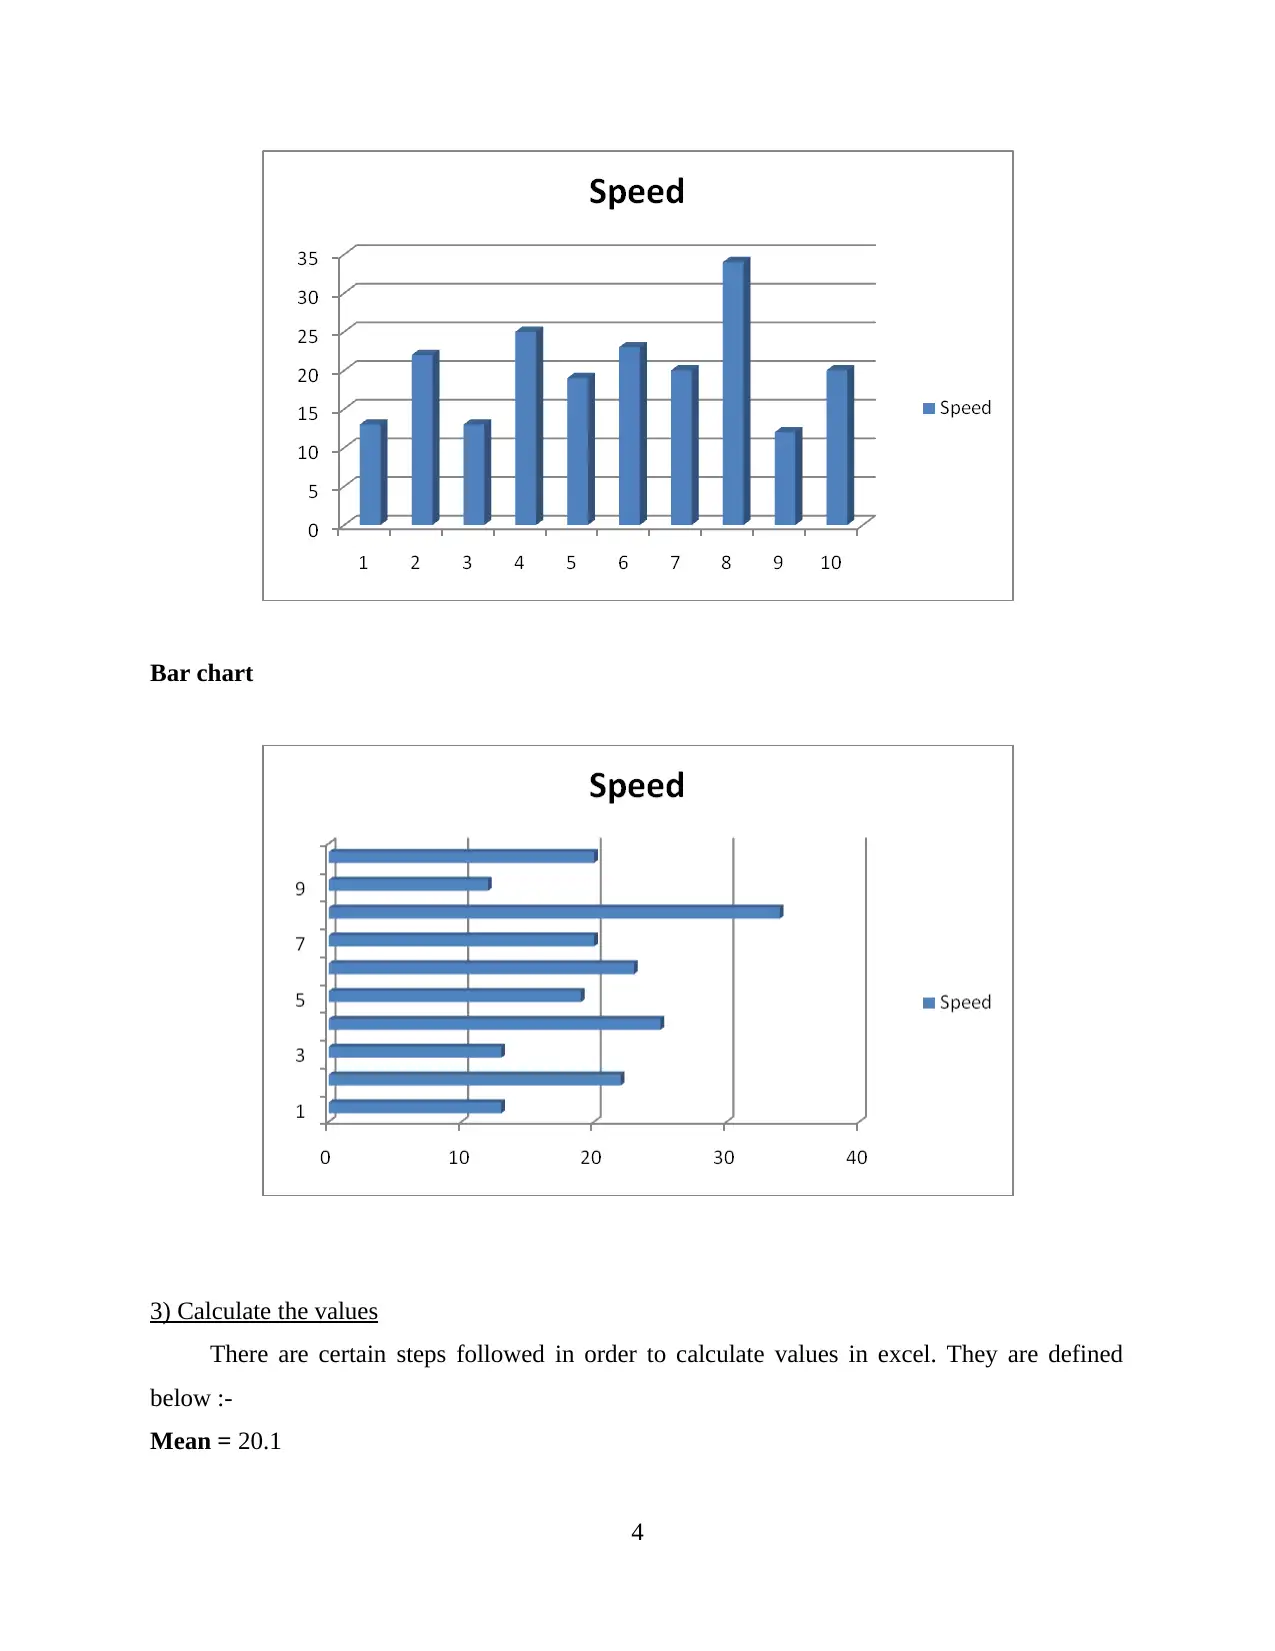
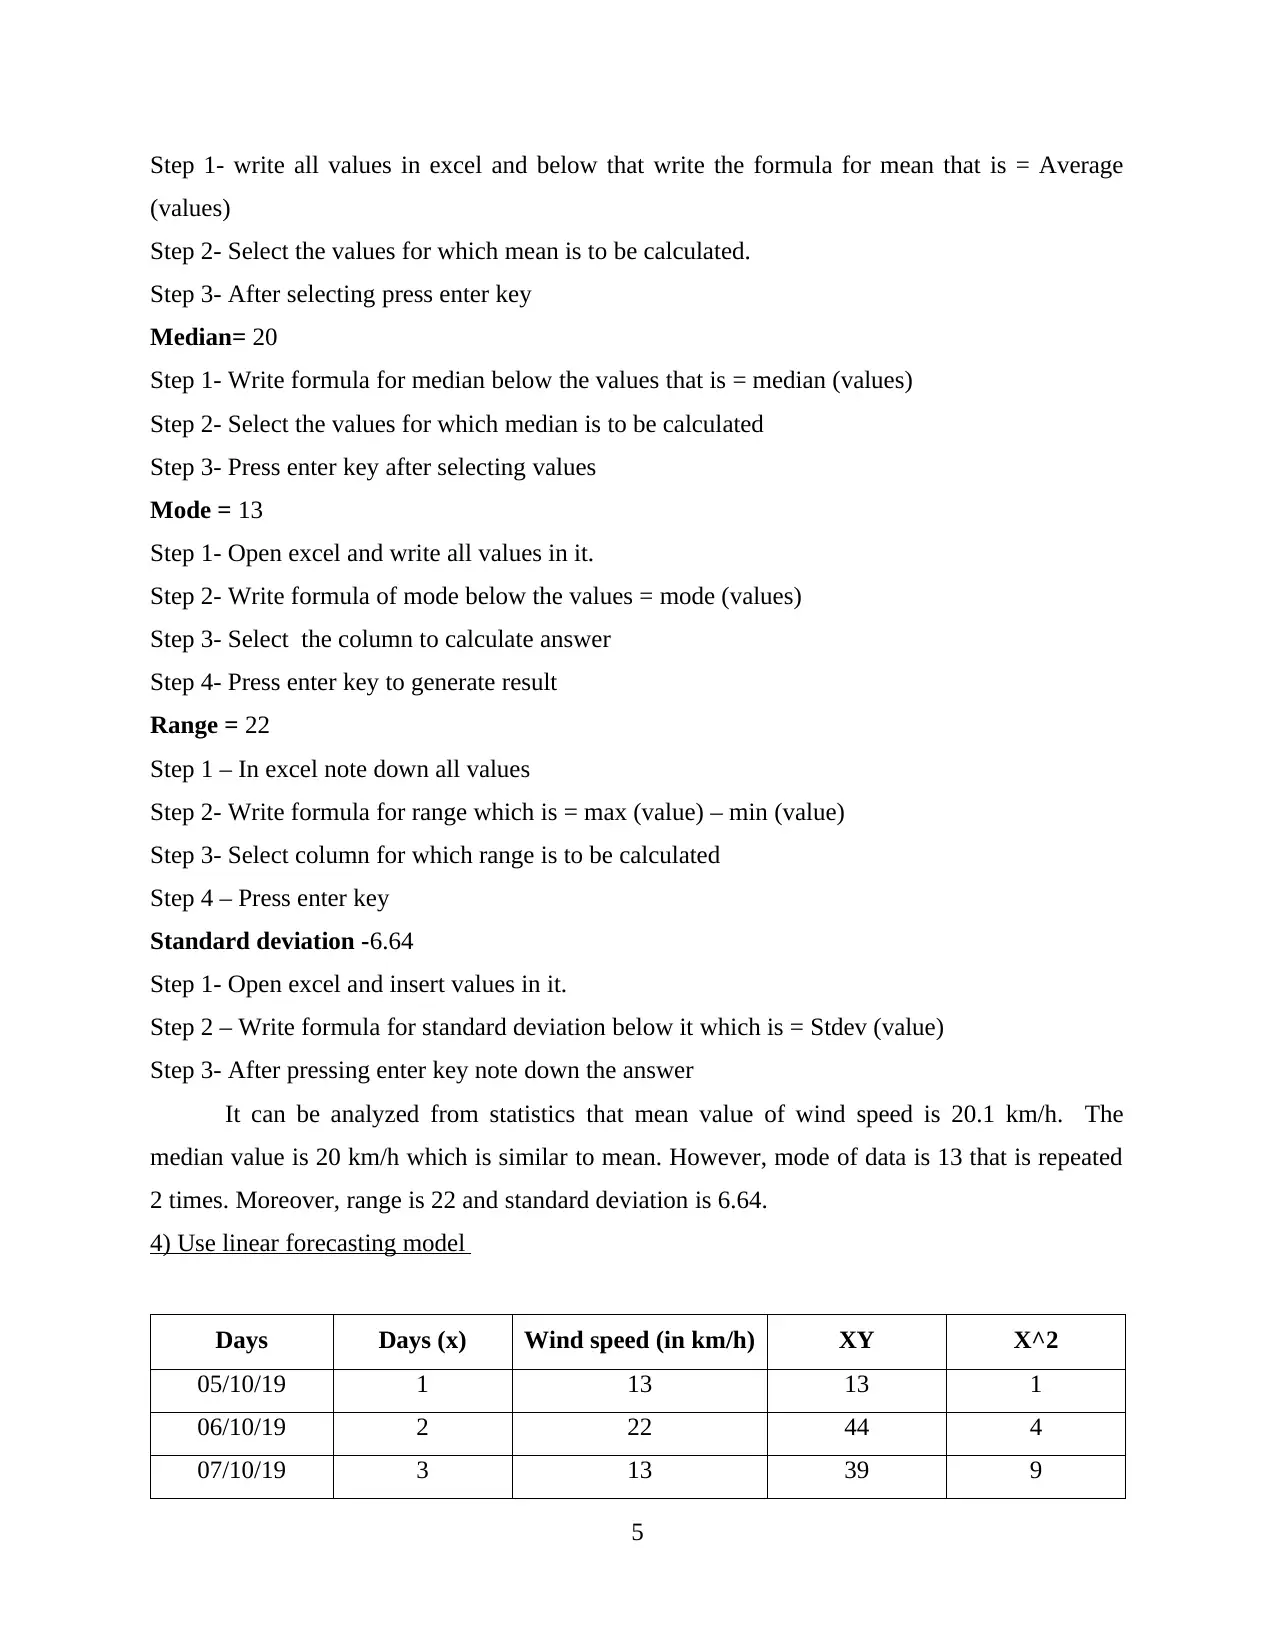
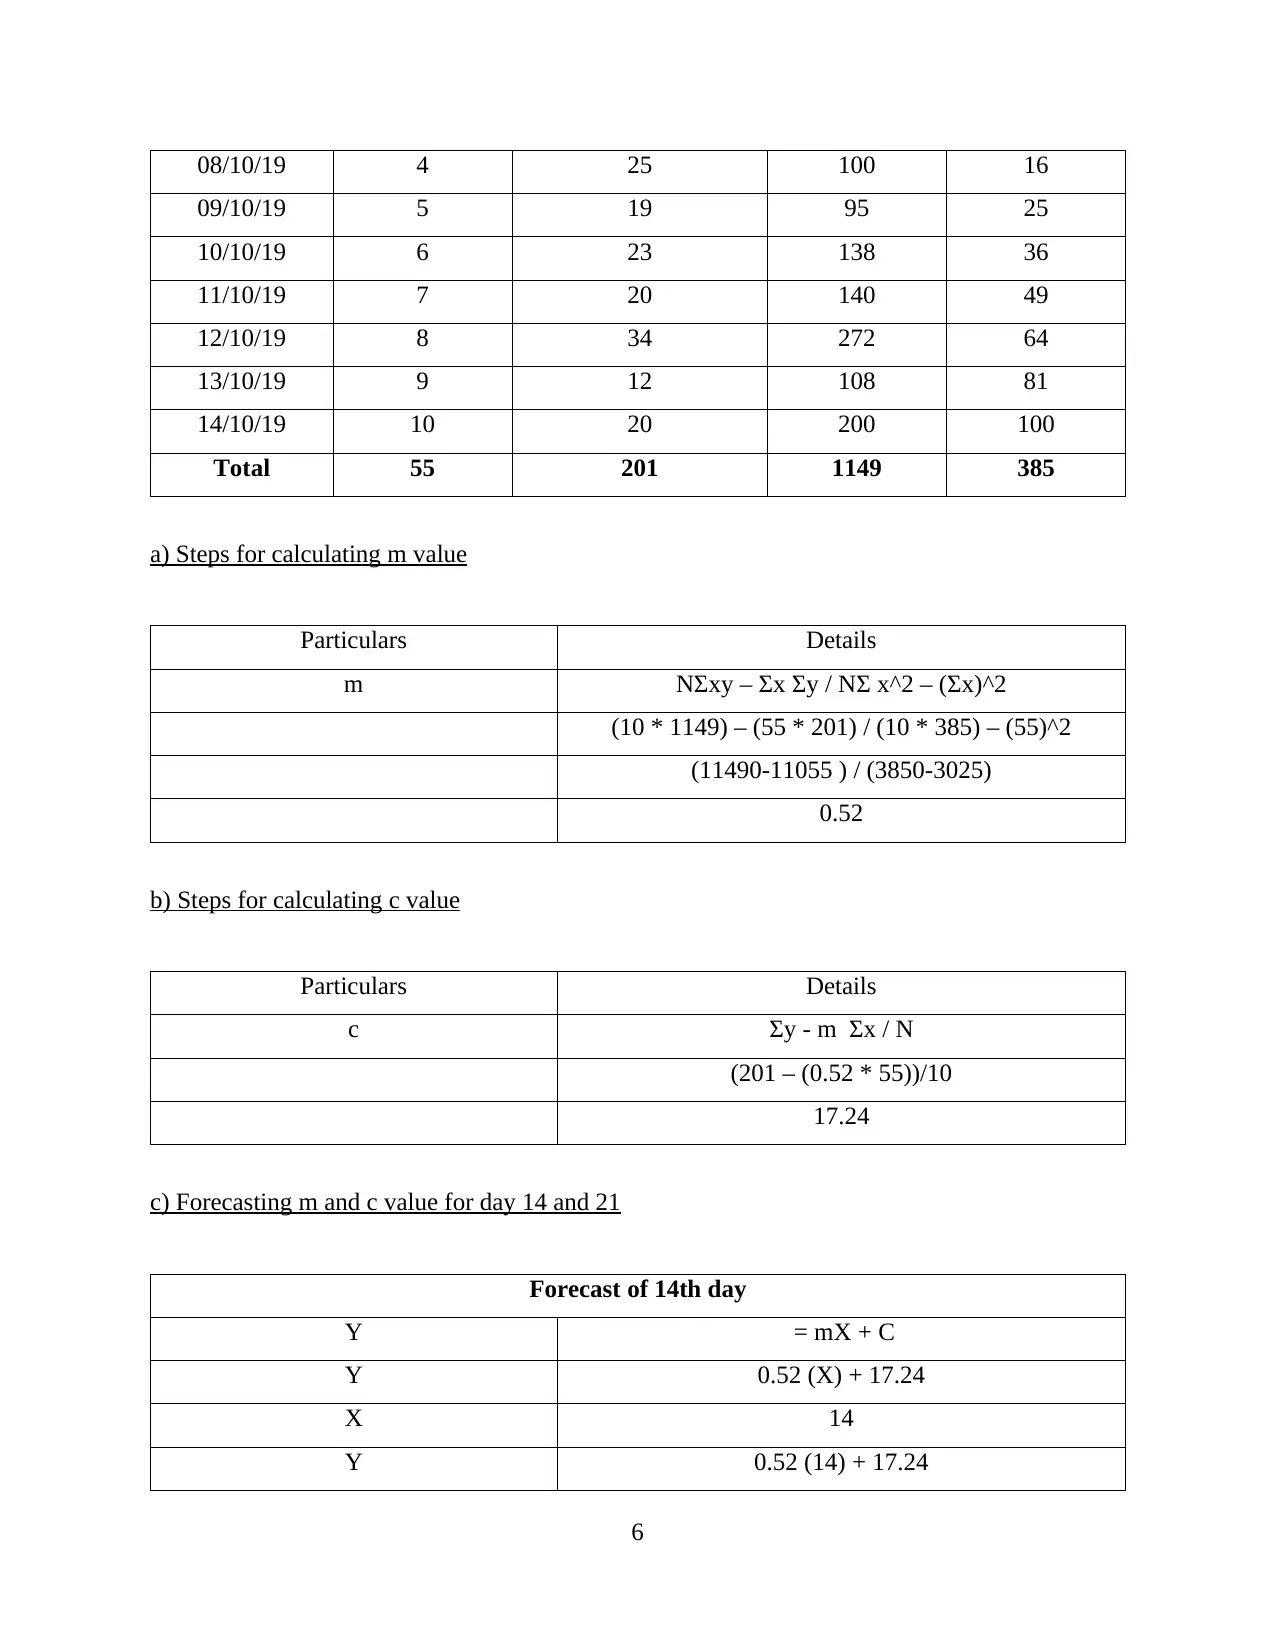
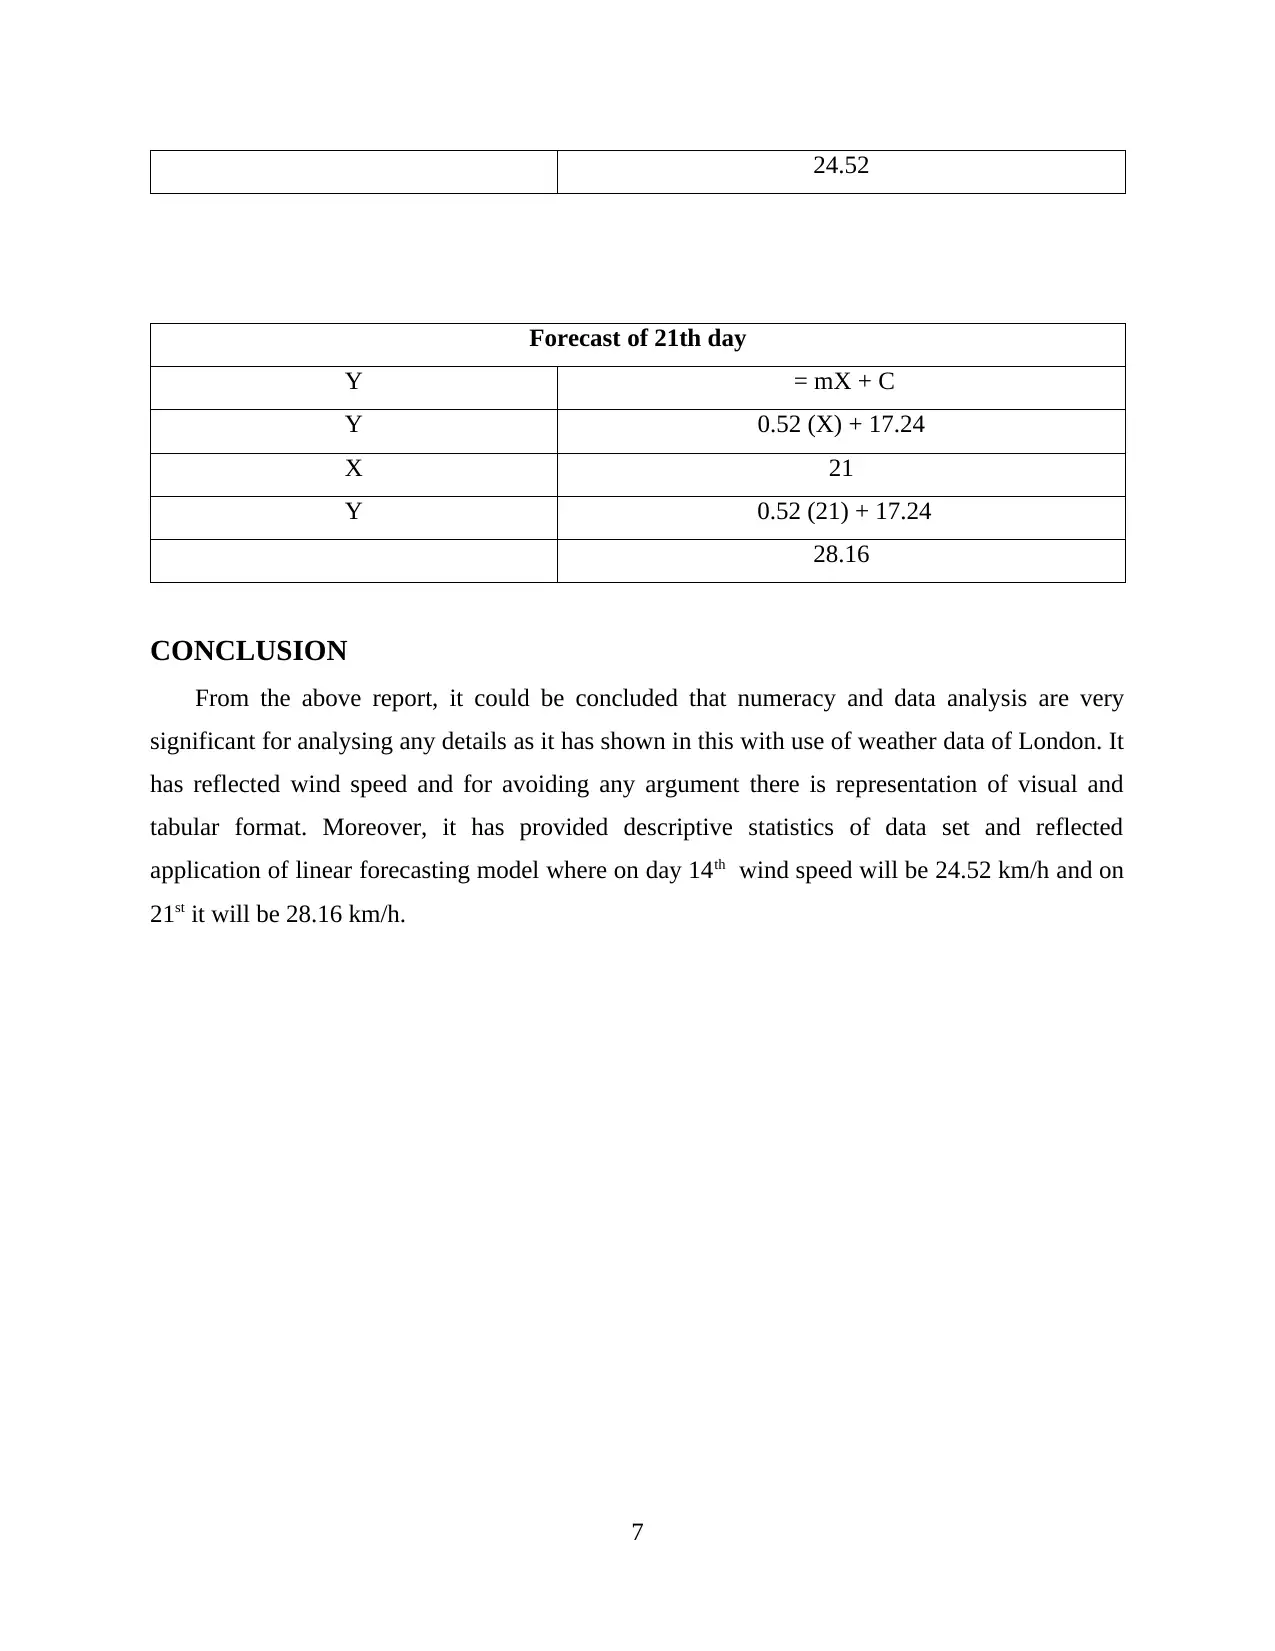
This project provides a detailed analysis of London's wind speed over a 10-day period in October 2019. The analysis begins with presenting the data in a tabular format, followed by visual representations using column and bar charts. Descriptive statistics, including mean, median, mode, range, and standard deviation, are calculated to provide insights into the data distribution. The project then applies a linear forecasting model (Y = mX + c) to predict wind speeds for day 14 and day 21, with detailed steps for calculating the 'm' and 'c' values. The conclusion summarizes the findings, highlighting the importance of data analysis and numeracy in understanding real-world phenomena, and the forecasting results. The project uses Excel for calculations and data visualization.

1 out of 8
Related Documents


Your All-in-One AI-Powered Toolkit for Academic Success.
+13062052269
info@desklib.com
Available 24*7 on WhatsApp / Email
![[object Object]](/_next/static/media/star-bottom.7253800d.svg)
Copyright © 2020–2026 A2Z Services. All Rights Reserved. Developed and managed by ZUCOL.