Data Analysis and Forecasting of London Wind Speed Report

Verified

Added on  2021/02/19

|11
|1195
|154
Report
AI Summary
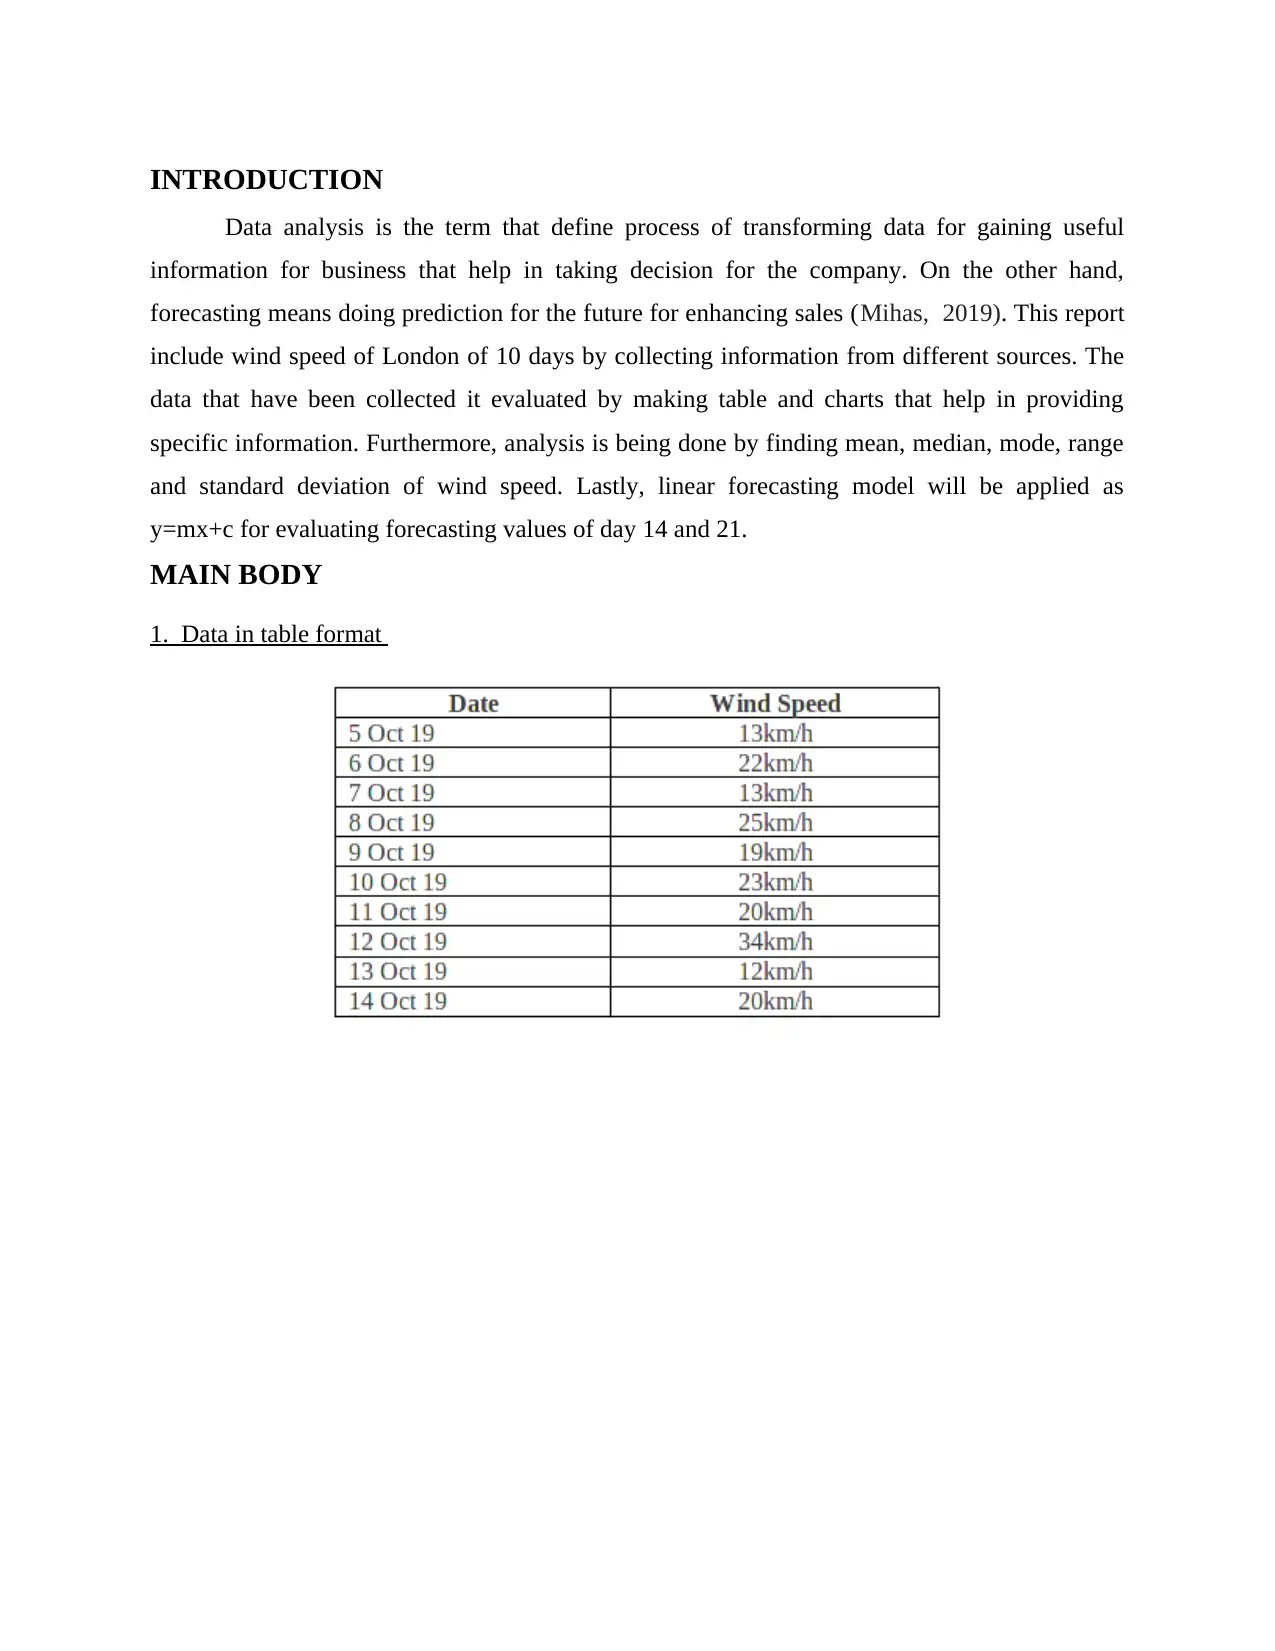
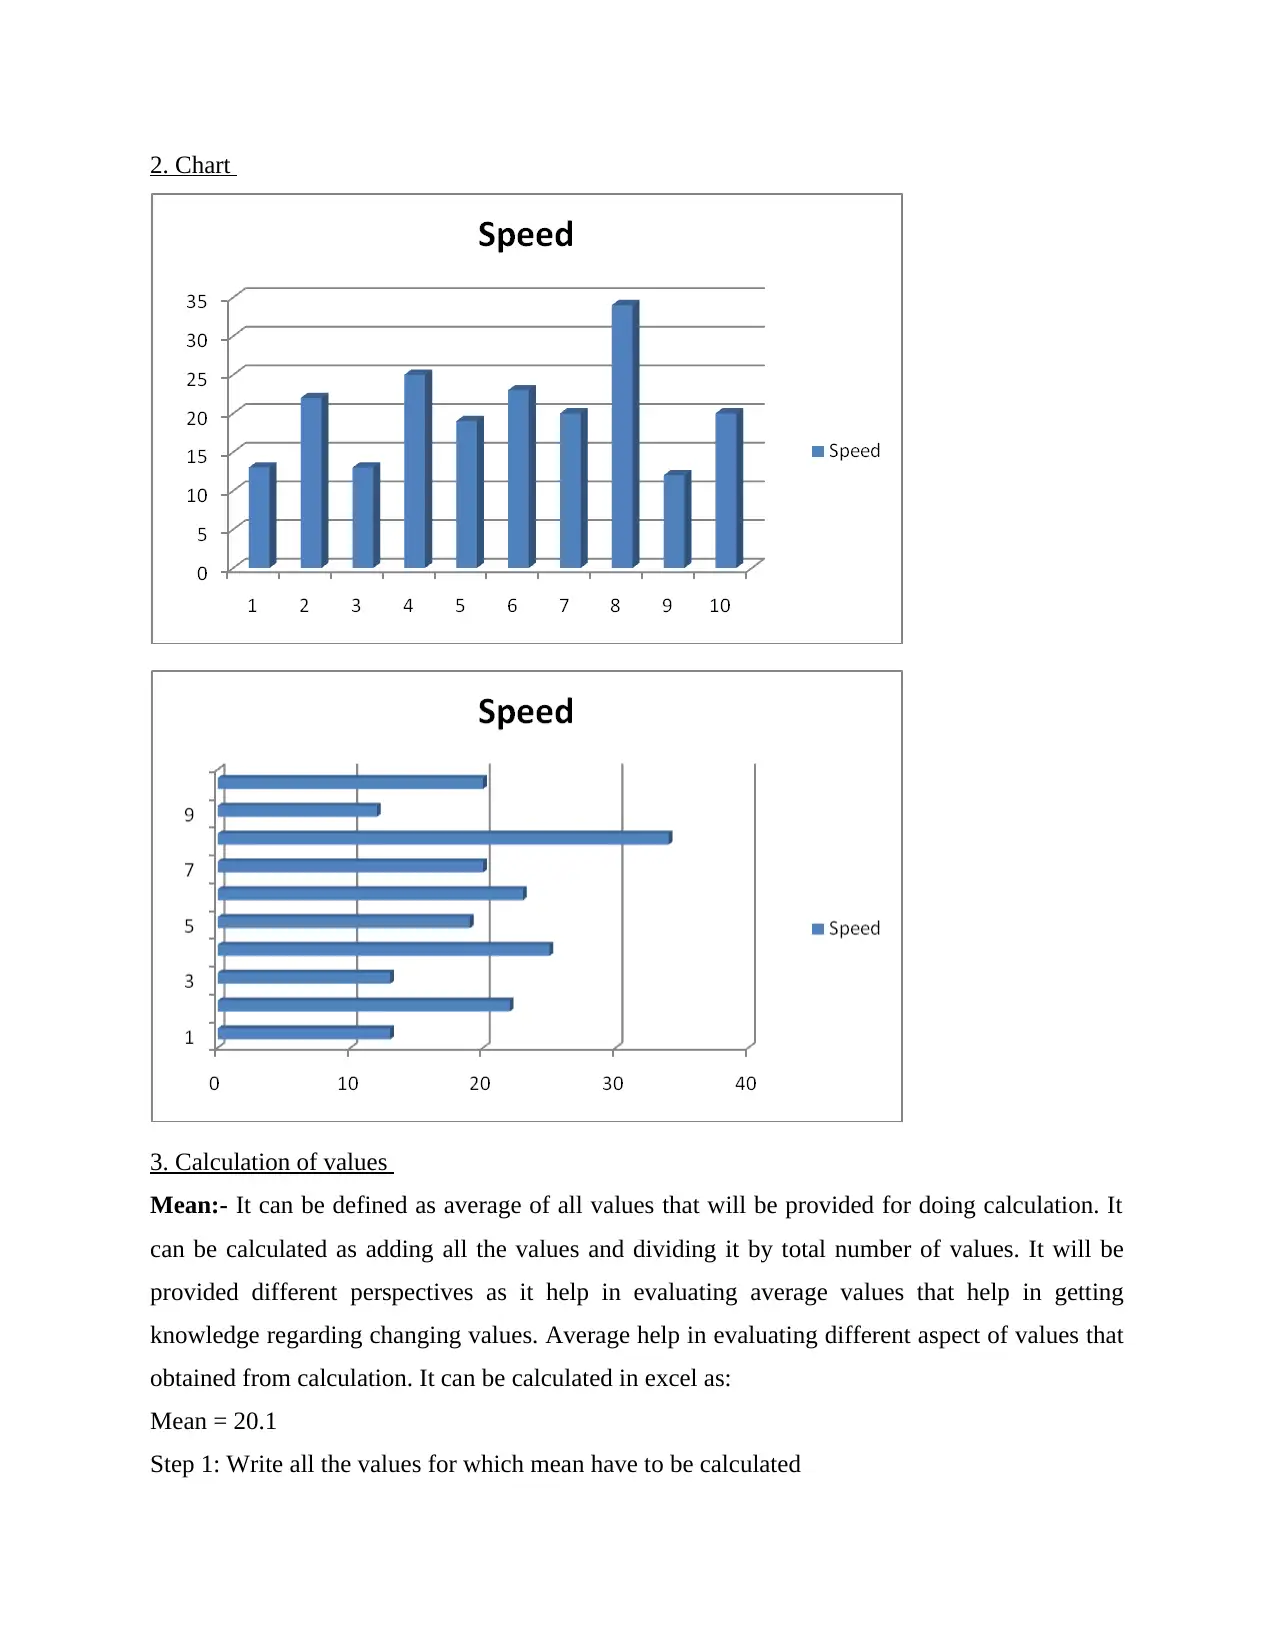
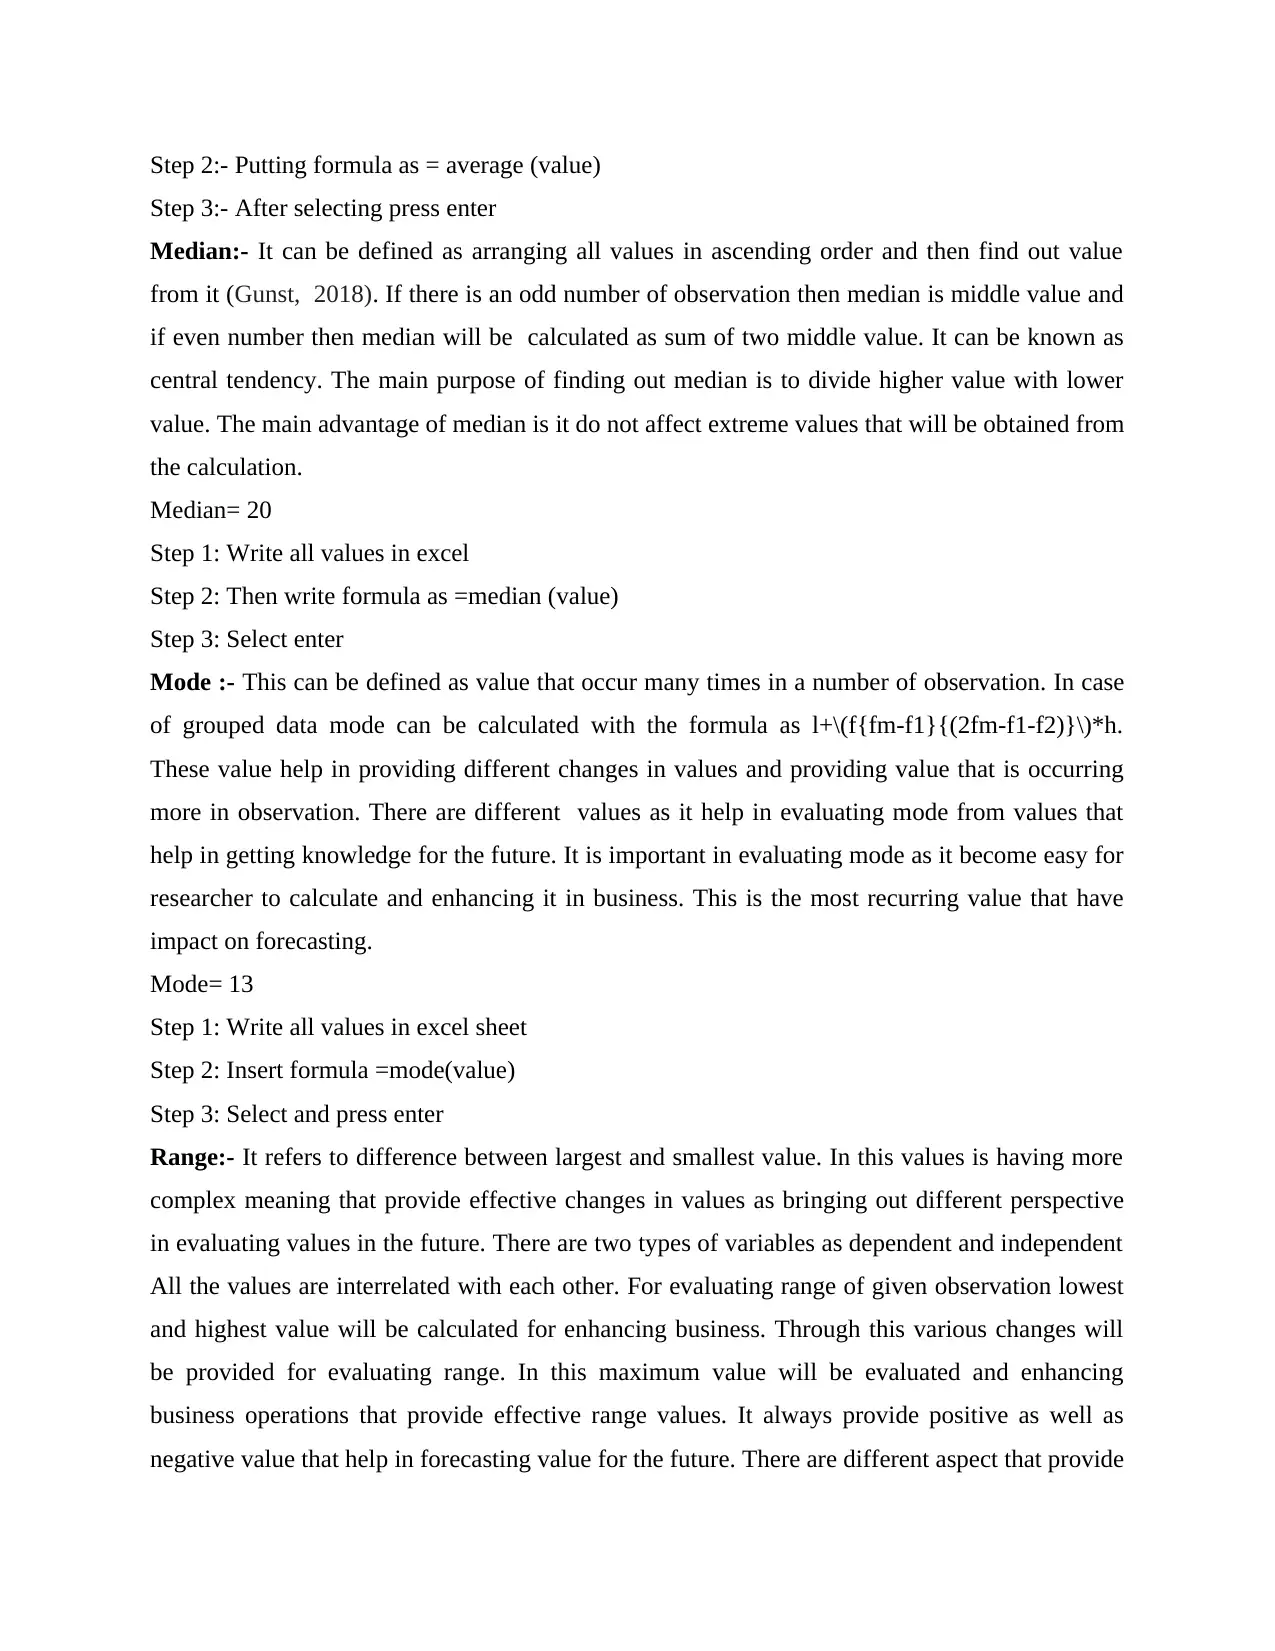
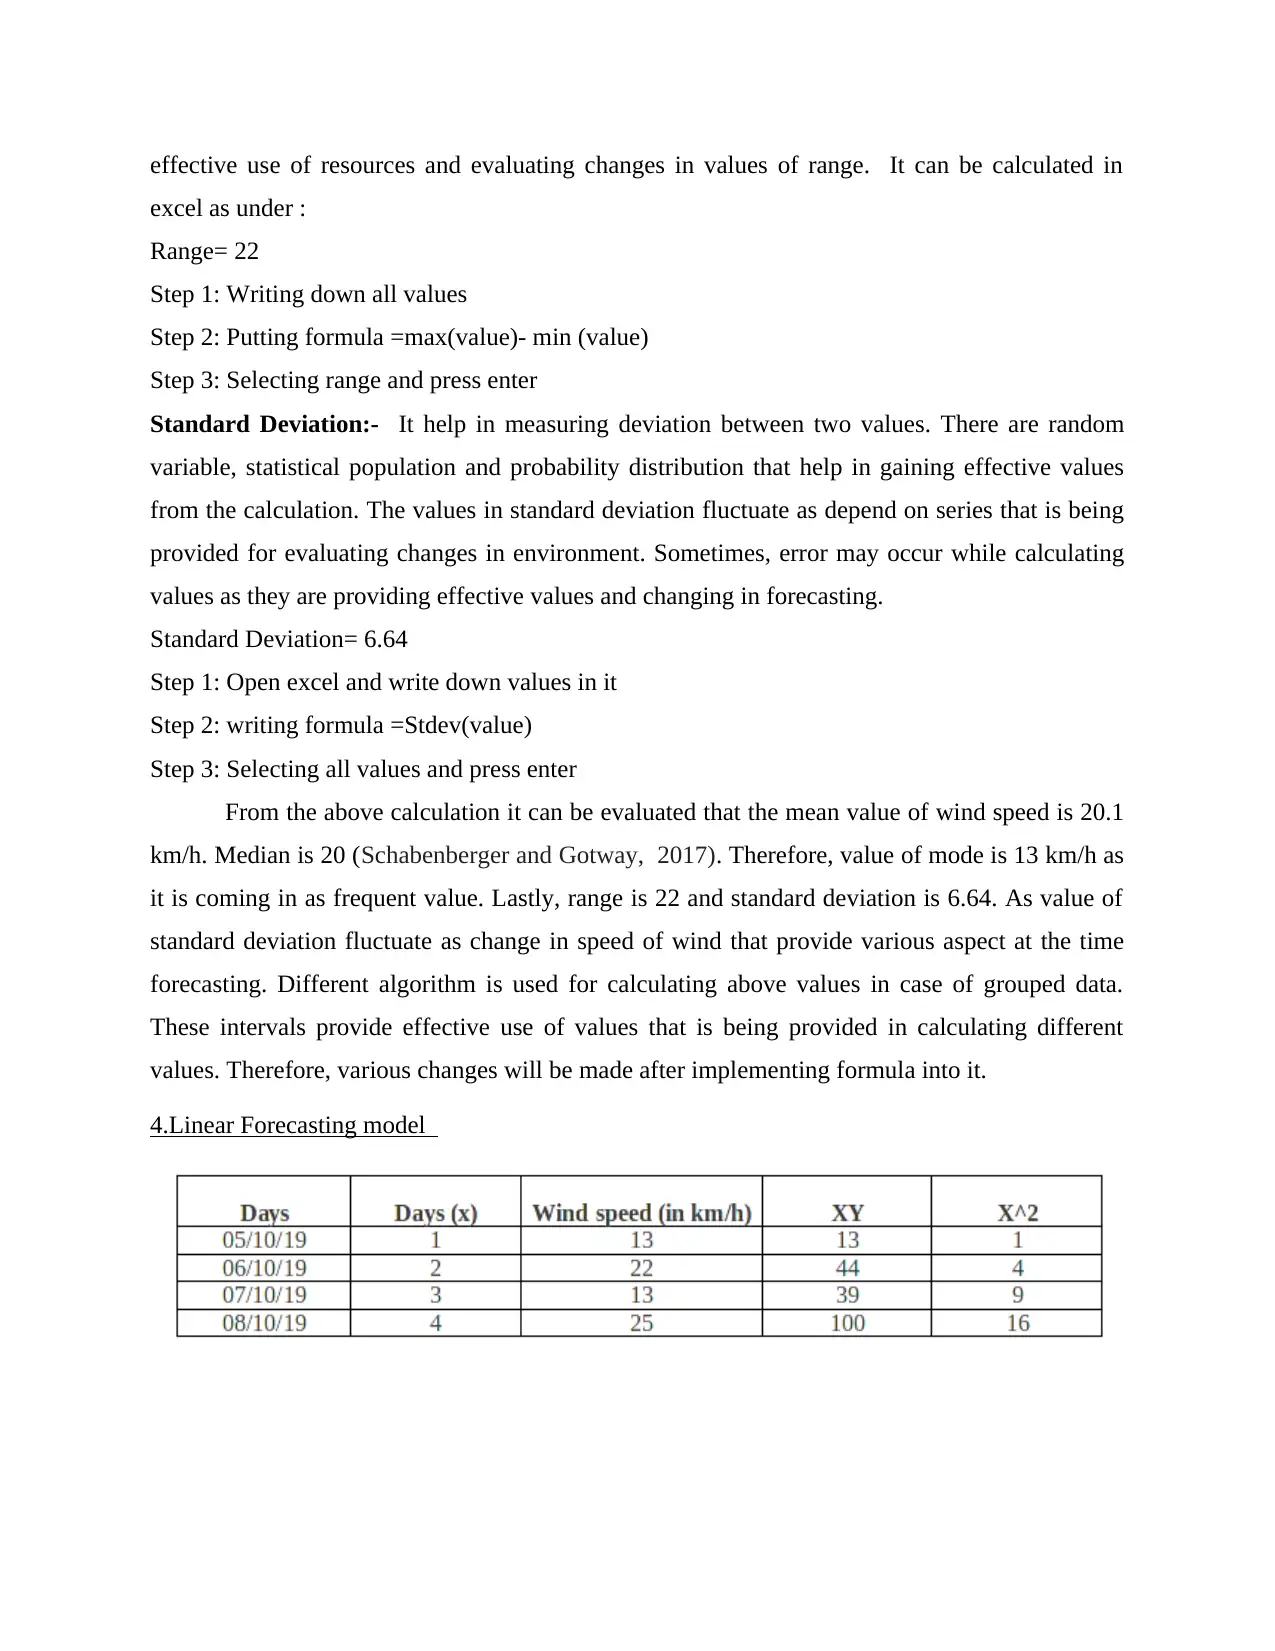
This report presents an analysis of London wind speed data collected over 10 days, employing data analysis and forecasting techniques. The analysis begins with data presentation in table and chart formats for clear visualization. Statistical calculations, including mean, median, mode, range, and standard deviation, are performed to derive insights from the data. Furthermore, the report utilizes a linear forecasting model (y=mx+c) to predict wind speed values for days 14 and 21. The methodology involves calculating the values of 'm' and 'c' in the linear equation, allowing for future predictions based on the established trends. The report concludes with a summary of findings, highlighting the application of data analysis tools and techniques for future predictions, which are essential for various business applications. This report provides a comprehensive overview of the data analysis process, from data collection and organization to the application of forecasting models.
Document Page
Data Analysis and Forecasting
tabler-icon-diamond-filled.svg

Paraphrase This Document

Need a fresh take? Get an instant paraphrase of this document with our AI Paraphraser
Document Page
Table of Contents
INTRODUCTION...........................................................................................................................3
1. Data in table format ...............................................................................................................3
2. Chart .......................................................................................................................................4
3. Calculation of values ..............................................................................................................4
4.Linear Forecasting model .......................................................................................................5
a)Calculation of value m ............................................................................................................5
b) Calculation of value c.............................................................................................................5
c) Forecasting value of c and m for day 14 and 21.....................................................................5
CONCLUSION................................................................................................................................6
REFERENCES................................................................................................................................6
Document Page
INTRODUCTION
Data analysis is the term that define process of transforming data for gaining useful
information for business that help in taking decision for the company. On the other hand,
forecasting means doing prediction for the future for enhancing sales (Mihas, 2019). This report
include wind speed of London of 10 days by collecting information from different sources. The
data that have been collected it evaluated by making table and charts that help in providing
specific information. Furthermore, analysis is being done by finding mean, median, mode, range
and standard deviation of wind speed. Lastly, linear forecasting model will be applied as
y=mx+c for evaluating forecasting values of day 14 and 21.
MAIN BODY
1. Data in table format
Document Page
2. Chart
3. Calculation of values
Mean:- It can be defined as average of all values that will be provided for doing calculation. It
can be calculated as adding all the values and dividing it by total number of values. It will be
provided different perspectives as it help in evaluating average values that help in getting
knowledge regarding changing values. Average help in evaluating different aspect of values that
obtained from calculation. It can be calculated in excel as:
Mean = 20.1
Step 1: Write all the values for which mean have to be calculated
tabler-icon-diamond-filled.svg

Paraphrase This Document

Need a fresh take? Get an instant paraphrase of this document with our AI Paraphraser
Document Page
Step 2:- Putting formula as = average (value)
Step 3:- After selecting press enter
Median:- It can be defined as arranging all values in ascending order and then find out value
from it (Gunst, 2018). If there is an odd number of observation then median is middle value and
if even number then median will be calculated as sum of two middle value. It can be known as
central tendency. The main purpose of finding out median is to divide higher value with lower
value. The main advantage of median is it do not affect extreme values that will be obtained from
the calculation.
Median= 20
Step 1: Write all values in excel
Step 2: Then write formula as =median (value)
Step 3: Select enter
Mode :- This can be defined as value that occur many times in a number of observation. In case
of grouped data mode can be calculated with the formula as l+\(f{fm-f1}{(2fm-f1-f2)}\)*h.
These value help in providing different changes in values and providing value that is occurring
more in observation. There are different values as it help in evaluating mode from values that
help in getting knowledge for the future. It is important in evaluating mode as it become easy for
researcher to calculate and enhancing it in business. This is the most recurring value that have
impact on forecasting.
Mode= 13
Step 1: Write all values in excel sheet
Step 2: Insert formula =mode(value)
Step 3: Select and press enter
Range:- It refers to difference between largest and smallest value. In this values is having more
complex meaning that provide effective changes in values as bringing out different perspective
in evaluating values in the future. There are two types of variables as dependent and independent
All the values are interrelated with each other. For evaluating range of given observation lowest
and highest value will be calculated for enhancing business. Through this various changes will
be provided for evaluating range. In this maximum value will be evaluated and enhancing
business operations that provide effective range values. It always provide positive as well as
negative value that help in forecasting value for the future. There are different aspect that provide
Document Page
effective use of resources and evaluating changes in values of range. It can be calculated in
excel as under :
Range= 22
Step 1: Writing down all values
Step 2: Putting formula =max(value)- min (value)
Step 3: Selecting range and press enter
Standard Deviation:- It help in measuring deviation between two values. There are random
variable, statistical population and probability distribution that help in gaining effective values
from the calculation. The values in standard deviation fluctuate as depend on series that is being
provided for evaluating changes in environment. Sometimes, error may occur while calculating
values as they are providing effective values and changing in forecasting.
Standard Deviation= 6.64
Step 1: Open excel and write down values in it
Step 2: writing formula =Stdev(value)
Step 3: Selecting all values and press enter
From the above calculation it can be evaluated that the mean value of wind speed is 20.1
km/h. Median is 20 (Schabenberger and Gotway, 2017). Therefore, value of mode is 13 km/h as
it is coming in as frequent value. Lastly, range is 22 and standard deviation is 6.64. As value of
standard deviation fluctuate as change in speed of wind that provide various aspect at the time
forecasting. Different algorithm is used for calculating above values in case of grouped data.
These intervals provide effective use of values that is being provided in calculating different
values. Therefore, various changes will be made after implementing formula into it.
4.Linear Forecasting model
Document Page
a)Calculation of value m
b) Calculation of value c
c) Forecasting value of c and m for day 14 and 21
tabler-icon-diamond-filled.svg

Paraphrase This Document

Need a fresh take? Get an instant paraphrase of this document with our AI Paraphraser
Document Page
CONCLUSION
From the above study it can be summarised that forecasting help in doing prediction for
the future. For analysing data different tools and techniques will be used that help in providing
desired results. As data analysis provide details that are recorded while forecasting weather in
London. Different values will be obtained by calculating mean, median, mode, range etc. It help
in evaluating values from linear forecasting model.
Document Page
REFERENCES
Books and Journal
Gunst, R.F., 2018. Regression analysis and its application: a data-oriented approach.
Routledge.
Mihas, P., 2019. Qualitative data analysis. In Oxford Research Encyclopedia of Education.
Schabenberger, O. and Gotway, C.A., 2017. Statistical methods for spatial data analysis.
Chapman and Hall/CRC.
Document Page
tabler-icon-diamond-filled.svg

Paraphrase This Document

Need a fresh take? Get an instant paraphrase of this document with our AI Paraphraser
Document Page
chevron_up_icon
1 out of 11
circle_padding
hide_on_mobile
zoom_out_icon
[object Object]