Wind Speed Analysis in London: Descriptive Stats and Forecasting Model

Verified

Added on  2023/06/11

|11
|1430
|311
Homework Assignment
AI Summary
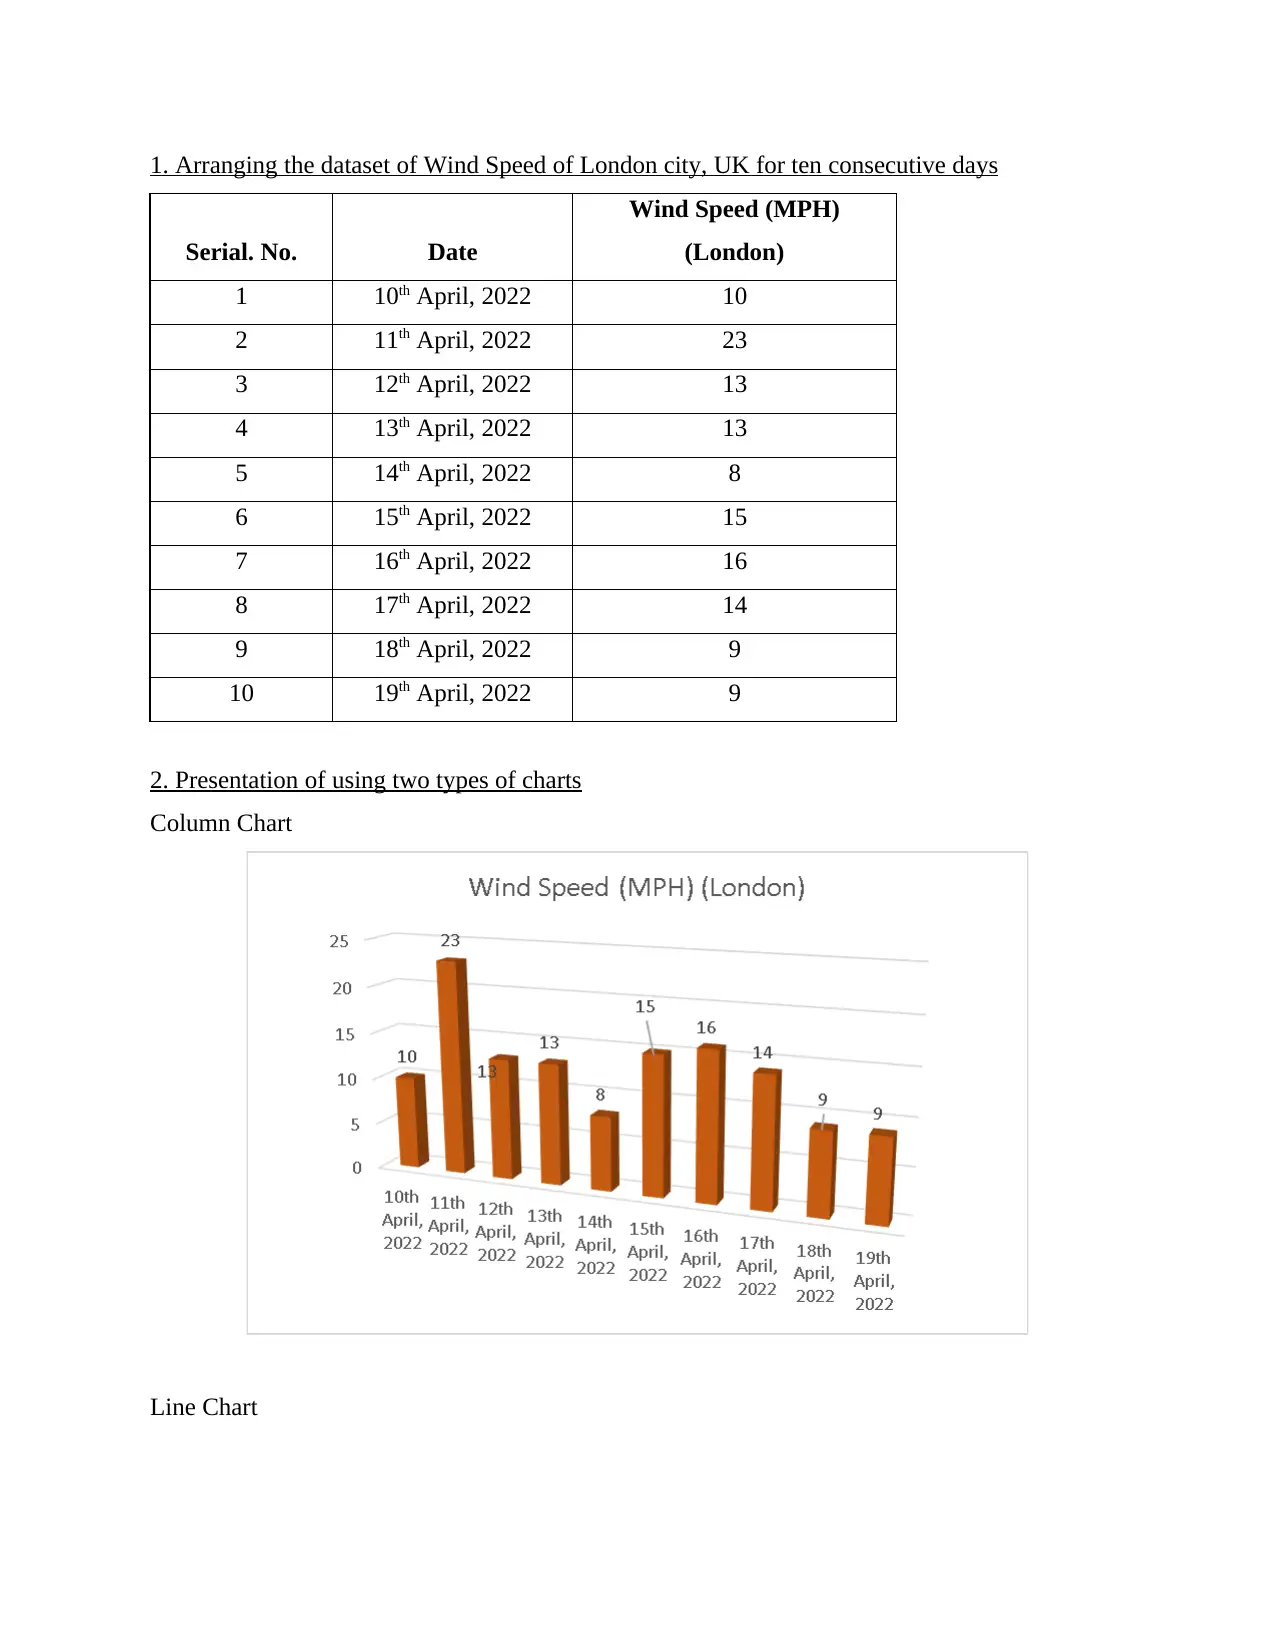
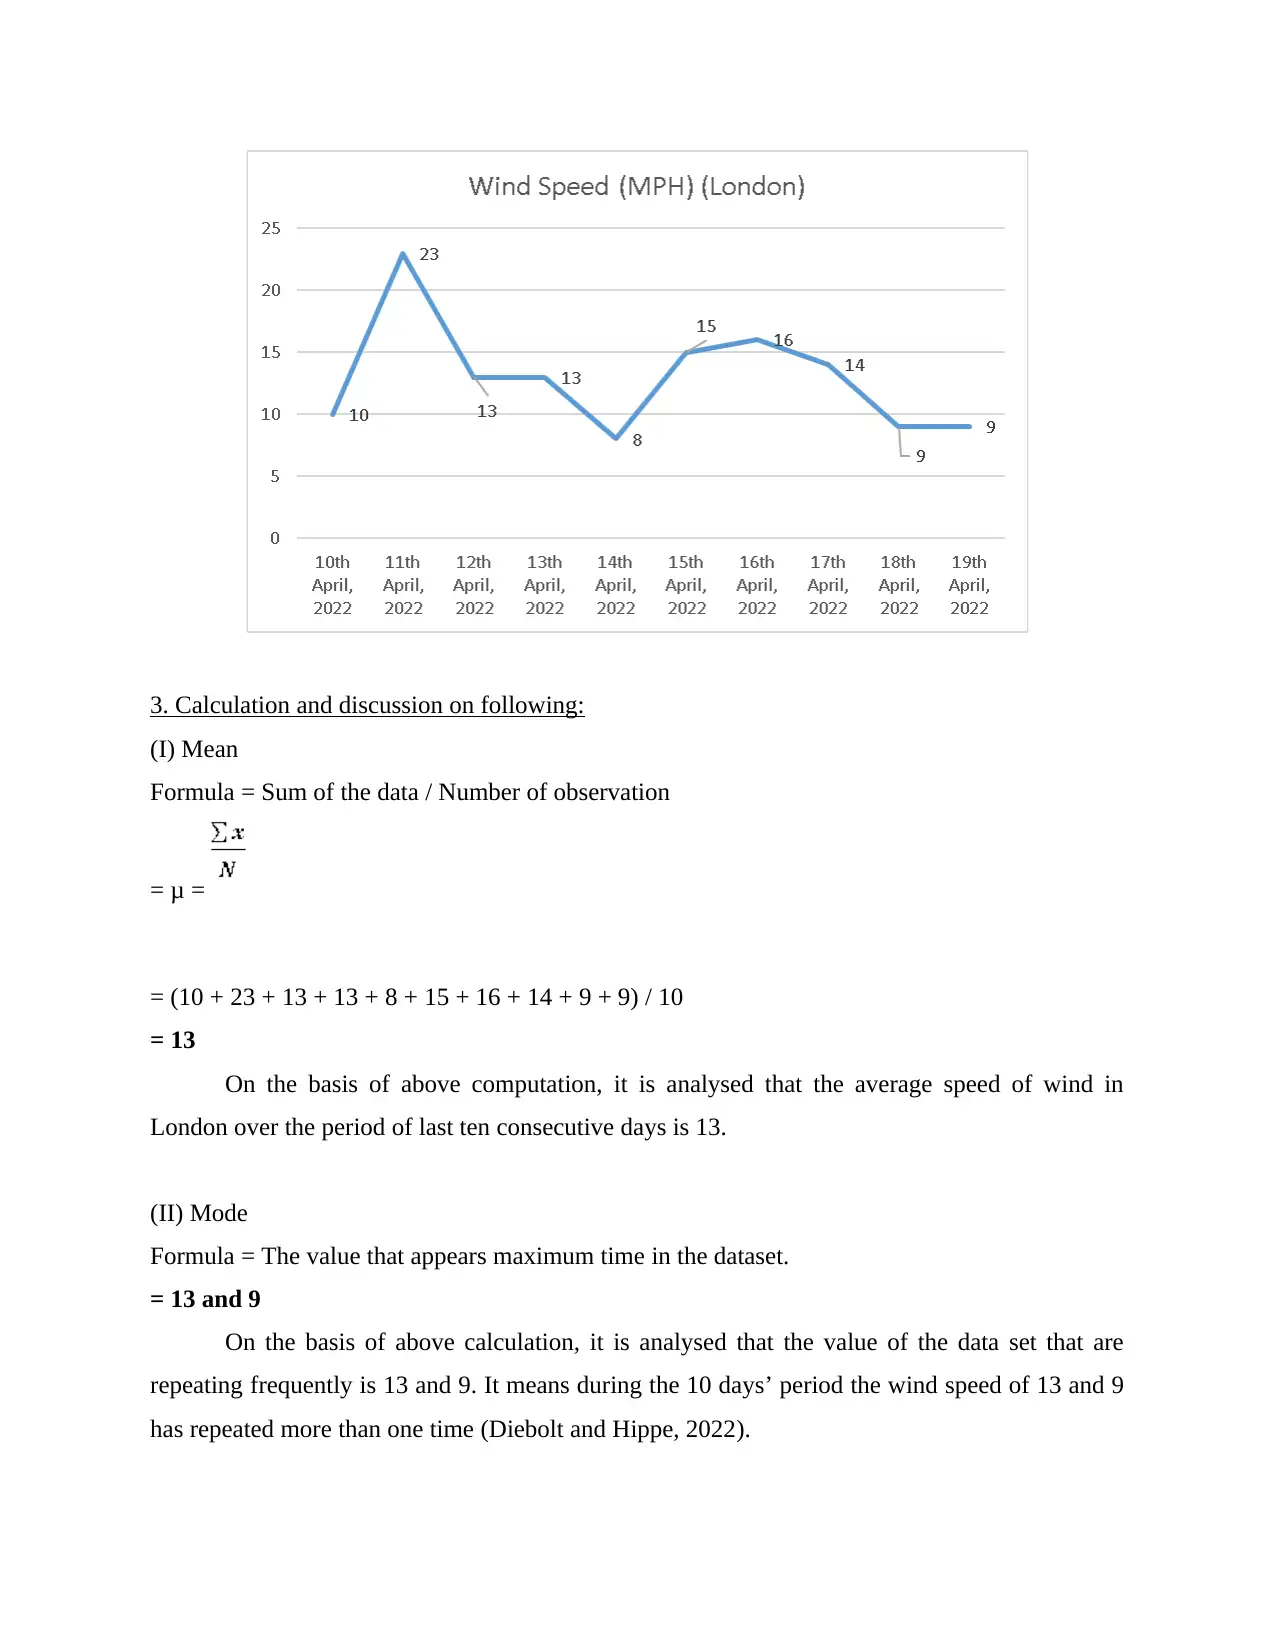
This assignment focuses on analyzing wind speed data collected in London, UK, over ten consecutive days. It involves arranging the dataset, presenting the data using column and line charts, and calculating descriptive statistics such as mean, mode, median, range, and standard deviation. The assignment also includes the application of a linear forecasting model to estimate future wind speeds, specifically for the 11th and 13th days. The calculations and results are discussed in detail, providing insights into the average wind speed, data distribution, and potential future trends based on the linear model. The assignment concludes with references to relevant books and journals.
tabler-icon-diamond-filled.svg

Contribute Materials

Your contribution can guide someone’s learning journey. Share your documents today.
Document Page
NUMERACY AND DATA
ANALYSIS
tabler-icon-diamond-filled.svg

Secure Best Marks with AI Grader

Need help grading? Try our AI Grader for instant feedback on your assignments.
Document Page
Table of Contents
1. Arranging the dataset of Wind Speed of London city, UK for ten consecutive days..............3
2. Presentation of using two types of charts................................................................................3
3. Calculation and discussion on following:................................................................................4
4. Calculation and discussion of following:................................................................................7
REFERENCES................................................................................................................................1
Document Page
1. Arranging the dataset of Wind Speed of London city, UK for ten consecutive days
Serial. No. Date
Wind Speed (MPH)
(London)
1 10th April, 2022 10
2 11th April, 2022 23
3 12th April, 2022 13
4 13th April, 2022 13
5 14th April, 2022 8
6 15th April, 2022 15
7 16th April, 2022 16
8 17th April, 2022 14
9 18th April, 2022 9
10 19th April, 2022 9
2. Presentation of using two types of charts
Column Chart
Line Chart
Document Page
3. Calculation and discussion on following:
(I) Mean
Formula = Sum of the data / Number of observation
= μ =
= (10 + 23 + 13 + 13 + 8 + 15 + 16 + 14 + 9 + 9) / 10
= 13
On the basis of above computation, it is analysed that the average speed of wind in
London over the period of last ten consecutive days is 13.
(II) Mode
Formula = The value that appears maximum time in the dataset.
= 13 and 9
On the basis of above calculation, it is analysed that the value of the data set that are
repeating frequently is 13 and 9. It means during the 10 days’ period the wind speed of 13 and 9
has repeated more than one time (Diebolt and Hippe, 2022).
tabler-icon-diamond-filled.svg

Secure Best Marks with AI Grader

Need help grading? Try our AI Grader for instant feedback on your assignments.
Document Page
(III) Median
Formula (in case when more than one value appeared in mid of dataset) = Sum of mid value /
number of term
= (8 + 15) / 2
= 11.5
After analysing the above calculation, it is identified that the mid value of the data set is
11.5 which occur in mid of the whole dataset. In case of more than one value the formula of sum
of mid value divided by number of term.
(IV) Range
Formula = Upper value – Lower Value
= 23 – 8
= 15
After analysing the range result of descriptive statistic, it is identified that the difference
between the lower and higher level value of the data set is 15 (Sulak and et.al., 2020). It means
the higher value of wind speed is 15 and lower value of wind speed is 8 and the difference of
higher and lower wind speed is 15.
(V) Standard deviation
Formula = σ =
Date Wind Speed (MPH)
(London) X (X- Mean) (X-Mean)^2
10th April, 2022 10 -3 9
Document Page
11th April, 2022 23 10 100
12th April, 2022 13 0 0
13th April, 2022 13 0 0
14th April, 2022 8 -5 25
15th April, 2022 15 2 4
16th April, 2022 16 3 9
17th April, 2022 14 1 1
18th April, 2022 9 -4 16
19th April, 2022 9 -4 16
Mean 13 180
σ = 180 / 10 = 4.2426
On the basis of above computation of standard deviation, it is identified that the 4.2426
times the value in the series of data is deviating from the average or mean of the data series. The
standard deviation is basically a statistic that helps in measuring the dispersion of a dataset
relative to its mean and basically calculated as a square root of the variance. A low standard
deviation that the value of dataset is close to its mean while on the other hand, the high standard
deviation means value of dataset is far away from the average or mean (Fidrayani, Syafrida and
Document Page
Melodyana, 2020). After analysing the above result, it is identified that the standard deviation of
current dataset is 4.2426 which is low. It means the value is close to the means of wind speed.
4. Calculation and discussion of following:
Linear forecasting model: Y = mx + c
Linear forecasting model is basically used to estimate the value of wind speed of London
of future dates. It is used for forecasting where y is a dependent variable, m is a slope, x is an
independent variable and c is intercept.
Serial.
No.
X Date
Wind Speed
(MPH) (London)
Y
xy X2
1
10th April,
2022 10
10 1
2
11th April,
2022 23
46 4
3
12th April,
2022 13
39 9
4
13th April,
2022 13
52 16
5
14th April,
2022 8
40 25
6
15th April,
2022 15
90 36
7
16th April,
2022 16
112 49
8
17th April,
2022 14
112 64
9
18th April,
2022 9
81 81
10
19th April,
2022 9
90 100
55 130 672 385
tabler-icon-diamond-filled.svg

Paraphrase This Document

Need a fresh take? Get an instant paraphrase of this document with our AI Paraphraser
Document Page
(I) Calculation of m value
Formula =
m = (10 * 672) – (55 * 130) / (10 * 385) – (55)2
m = 6720 – 7150 / 3850 – 3025
m = -430 / 825
m = -0.5212
On the basis of above result, it is identified that the slope of linear forecasting model is -
0.5212 i.e., negatively slope.
(II) Calculation of c value
Formula =
c = 130 – (-0.5212 * 55) / 10
c = 130 – (-28.666) / 10
c = 158.666/ 10
c = 15.8666
On the basis of above result, the intercept value of linear forecasting model is 15.8666
which is computed using formula mentioned above. Both slope and intercept value plays vital
role in forecasting or estimating future value of the dataset (Dierendonck and et.al., 2021).
(III) Forecasting the wind speed for Day 11 and Day 13
Formula = Y = mx + c
Expected wind speed on 11th day = Y = mx + c
Here, m = -0.5212
X = 11
Document Page
c = 15.8666
Y = (-0.5212 * 11) + 15.8666
= 10.1334 MPH
Expected wind speed on 13th day = Y = mx + c
Here, m = -0.5212
X = 13
c = 15.8666
Y = (-0.5212 * 13) + 15.8666
= 9.091 MPH
On the basis of linear forecasting model, the wind speed of 11th and 13th day has been
computed. The above result indicate that the wind speed of London on 11th day i.e., 20th April
2022 will be 10.1334 MPH. While on the other hand, it is also estimated that the wind speed of
London on 13th day i.e., 22th April 2022 will be 9.091 MPH (Sirota, Theodoropoulou and
Juanchich, 2021).
Document Page
tabler-icon-diamond-filled.svg

Secure Best Marks with AI Grader

Need help grading? Try our AI Grader for instant feedback on your assignments.
Document Page
REFERENCES
Books and journals
Diebolt, C. and Hippe, R., 2022. Spatial Clustering of Numeracy and Literacy. In Human Capital
and Regional Development in Europe (pp. 35-55). Springer, Cham.
Fidrayani, F., Syafrida, R. and Melodyana, P. A., 2020. Increased Numeracy Skills of Children
with Snakes and Ladders Game. Journal of Early Childhood Education (JECE), 2(1),
pp.62-72.
Dierendonck, C. and et.al., 2021. Investigating the dimensionality of early numeracy using the
bifactor exploratory structural equation modeling framework. Frontiers in
psychology. 12. p.2195.
Sirota, M., Theodoropoulou, A. and Juanchich, M., 2021. Disfluent fonts do not help people to
solve math and non-math problems regardless of their numeracy. Thinking &
Reasoning. 27(1). pp.142-159.
Sulak, T. N. and et.al., 2020. The relationships between numeracy scores and soft skills in
employed and unemployed Americans. New Horizons in Adult Education and Human
Resource Development. 32(2). pp.19-39.
1
chevron_up_icon
1 out of 11
circle_padding
hide_on_mobile
zoom_out_icon
logo.png

Your All-in-One AI-Powered Toolkit for Academic Success.

Available 24*7 on WhatsApp / Email

[object Object]