Data Analysis and Wind Speed Forecasting Report - London City

Verified

Added on  2023/06/10

|10
|1292
|273
Report
AI Summary
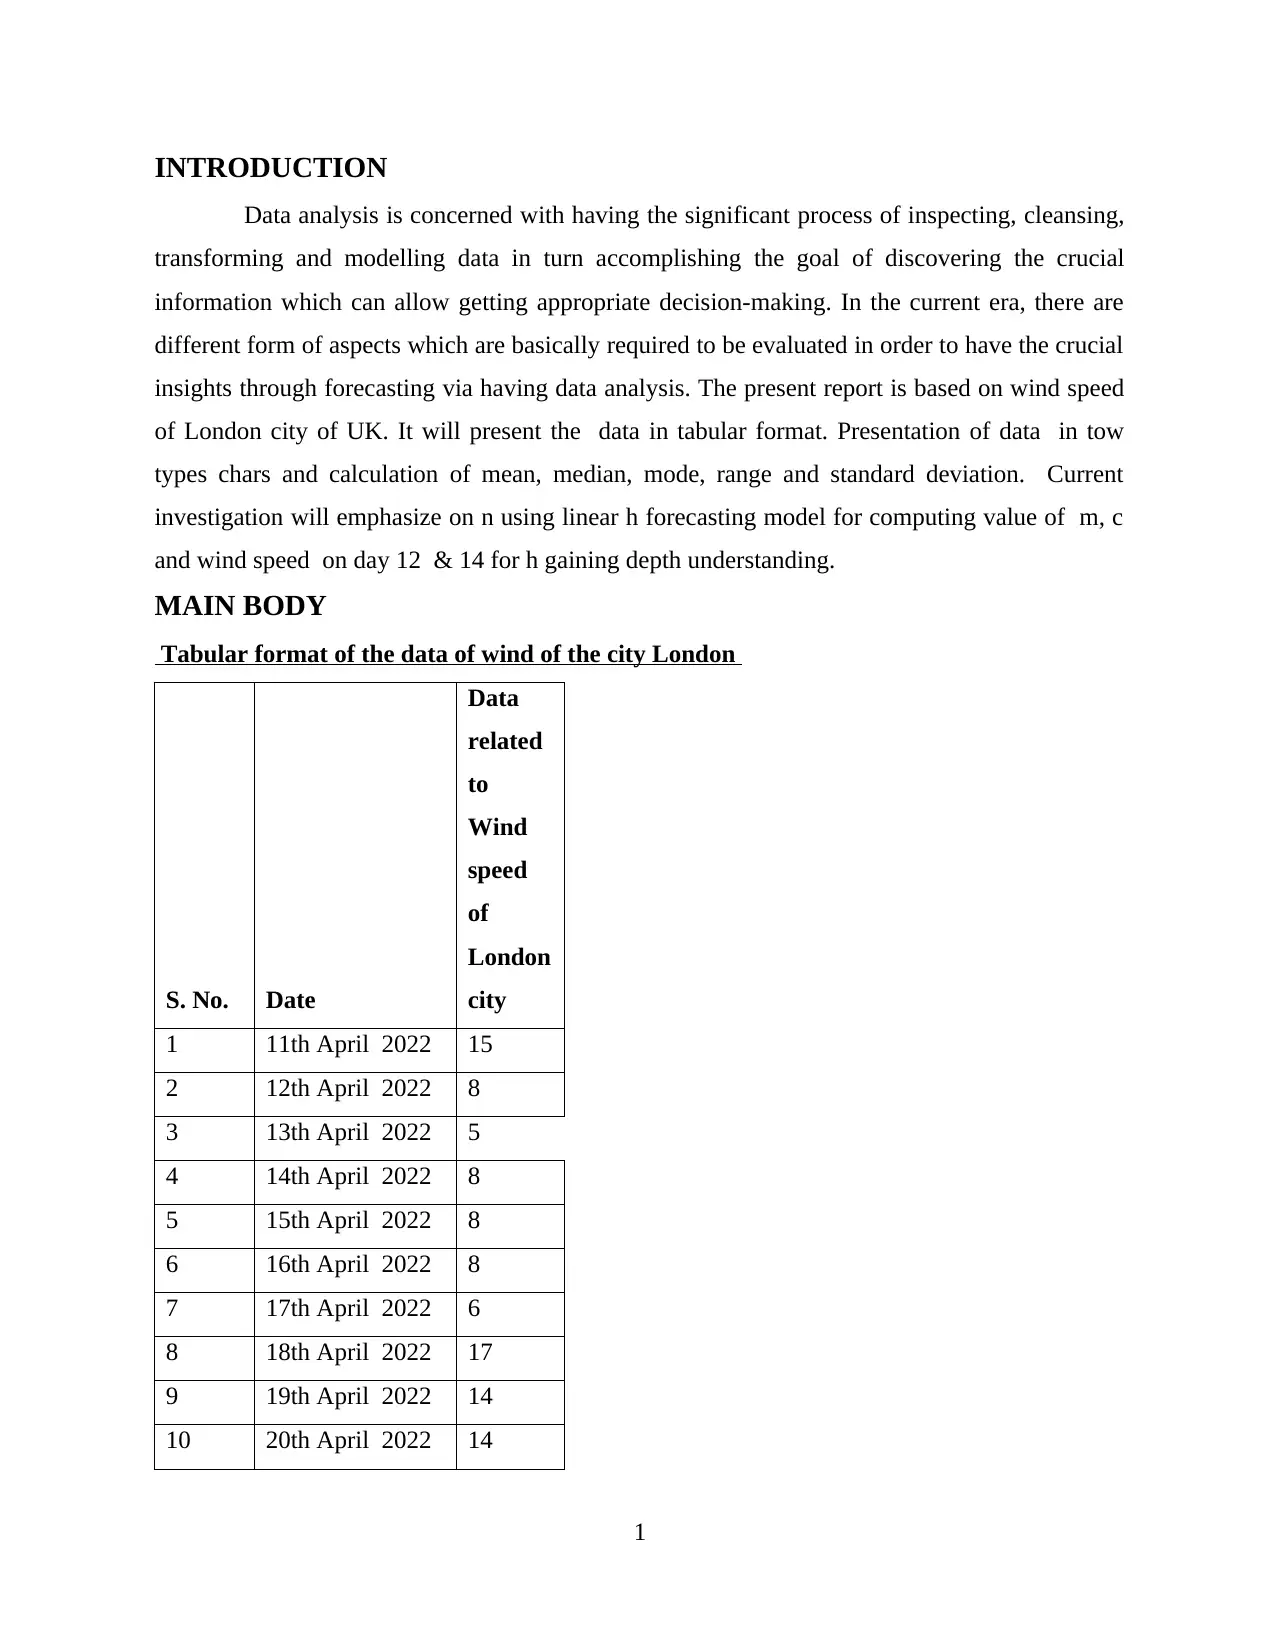
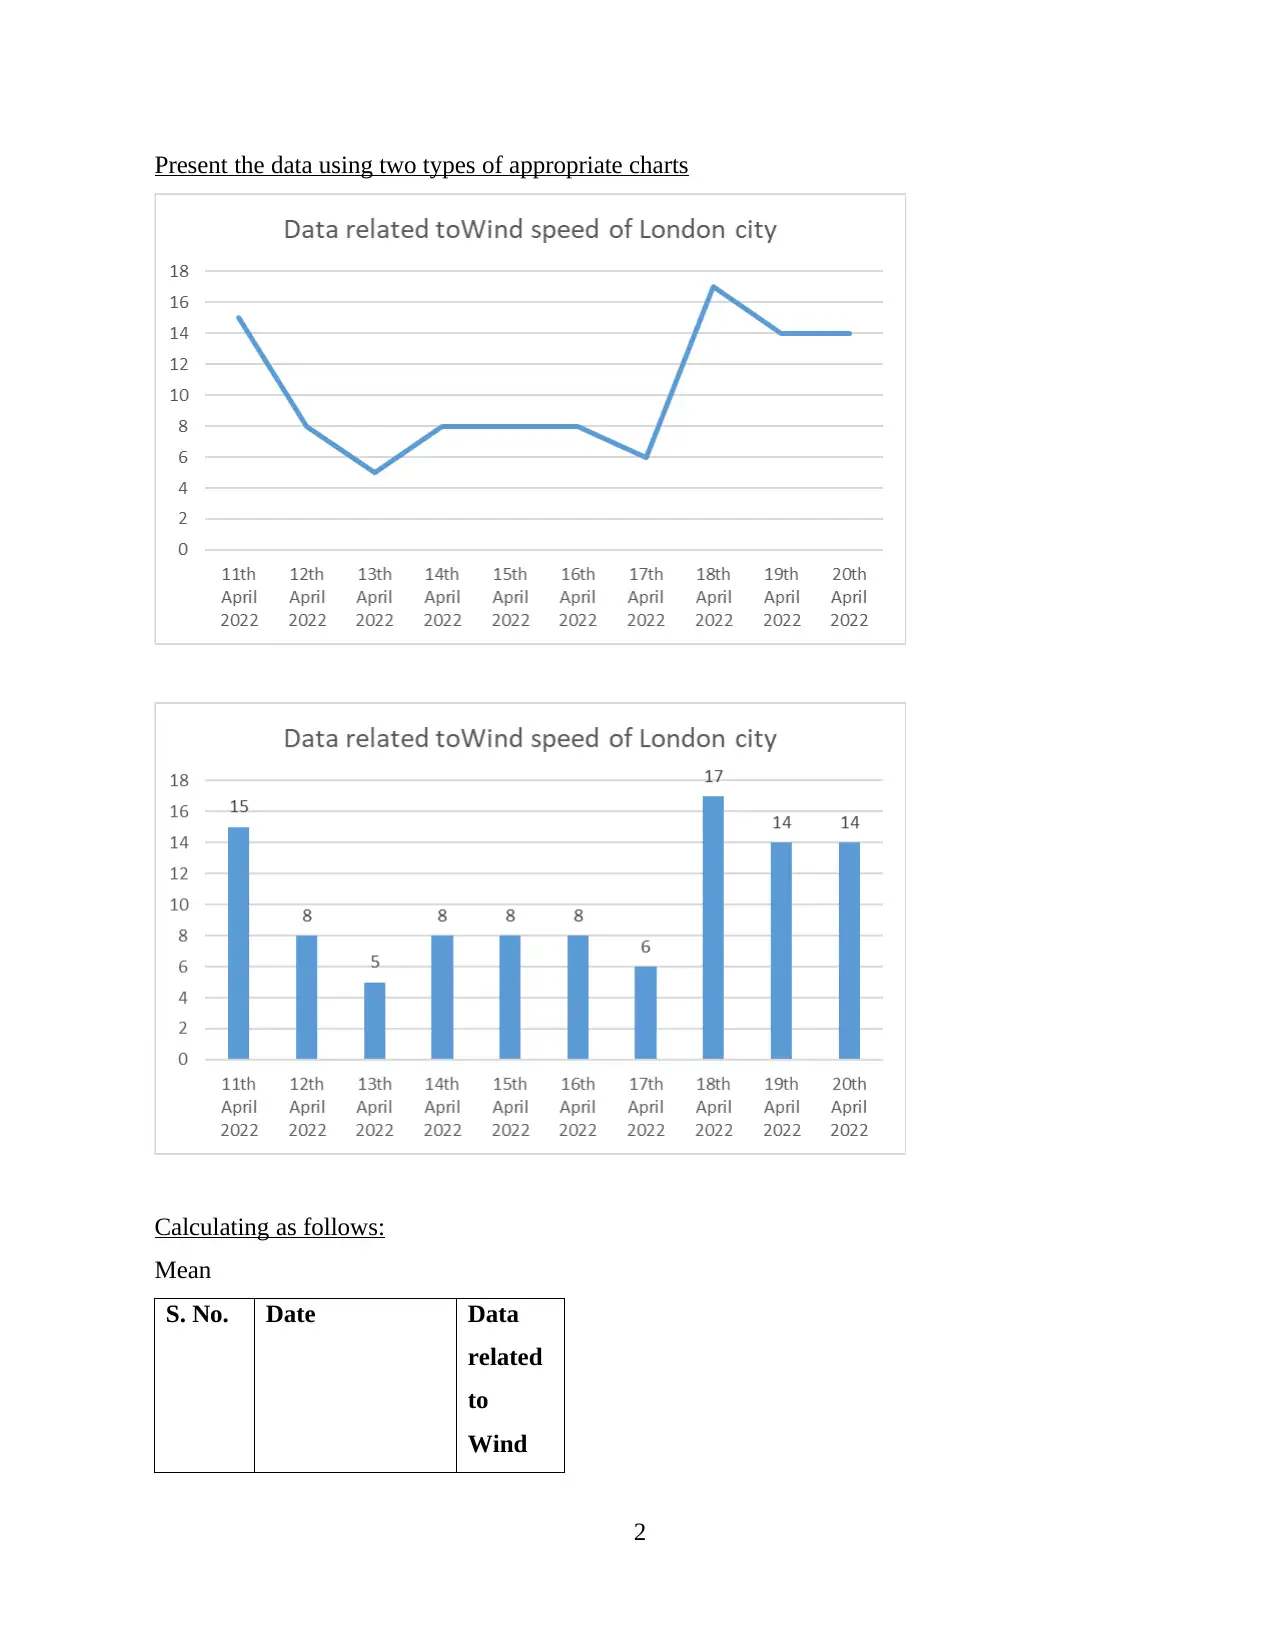
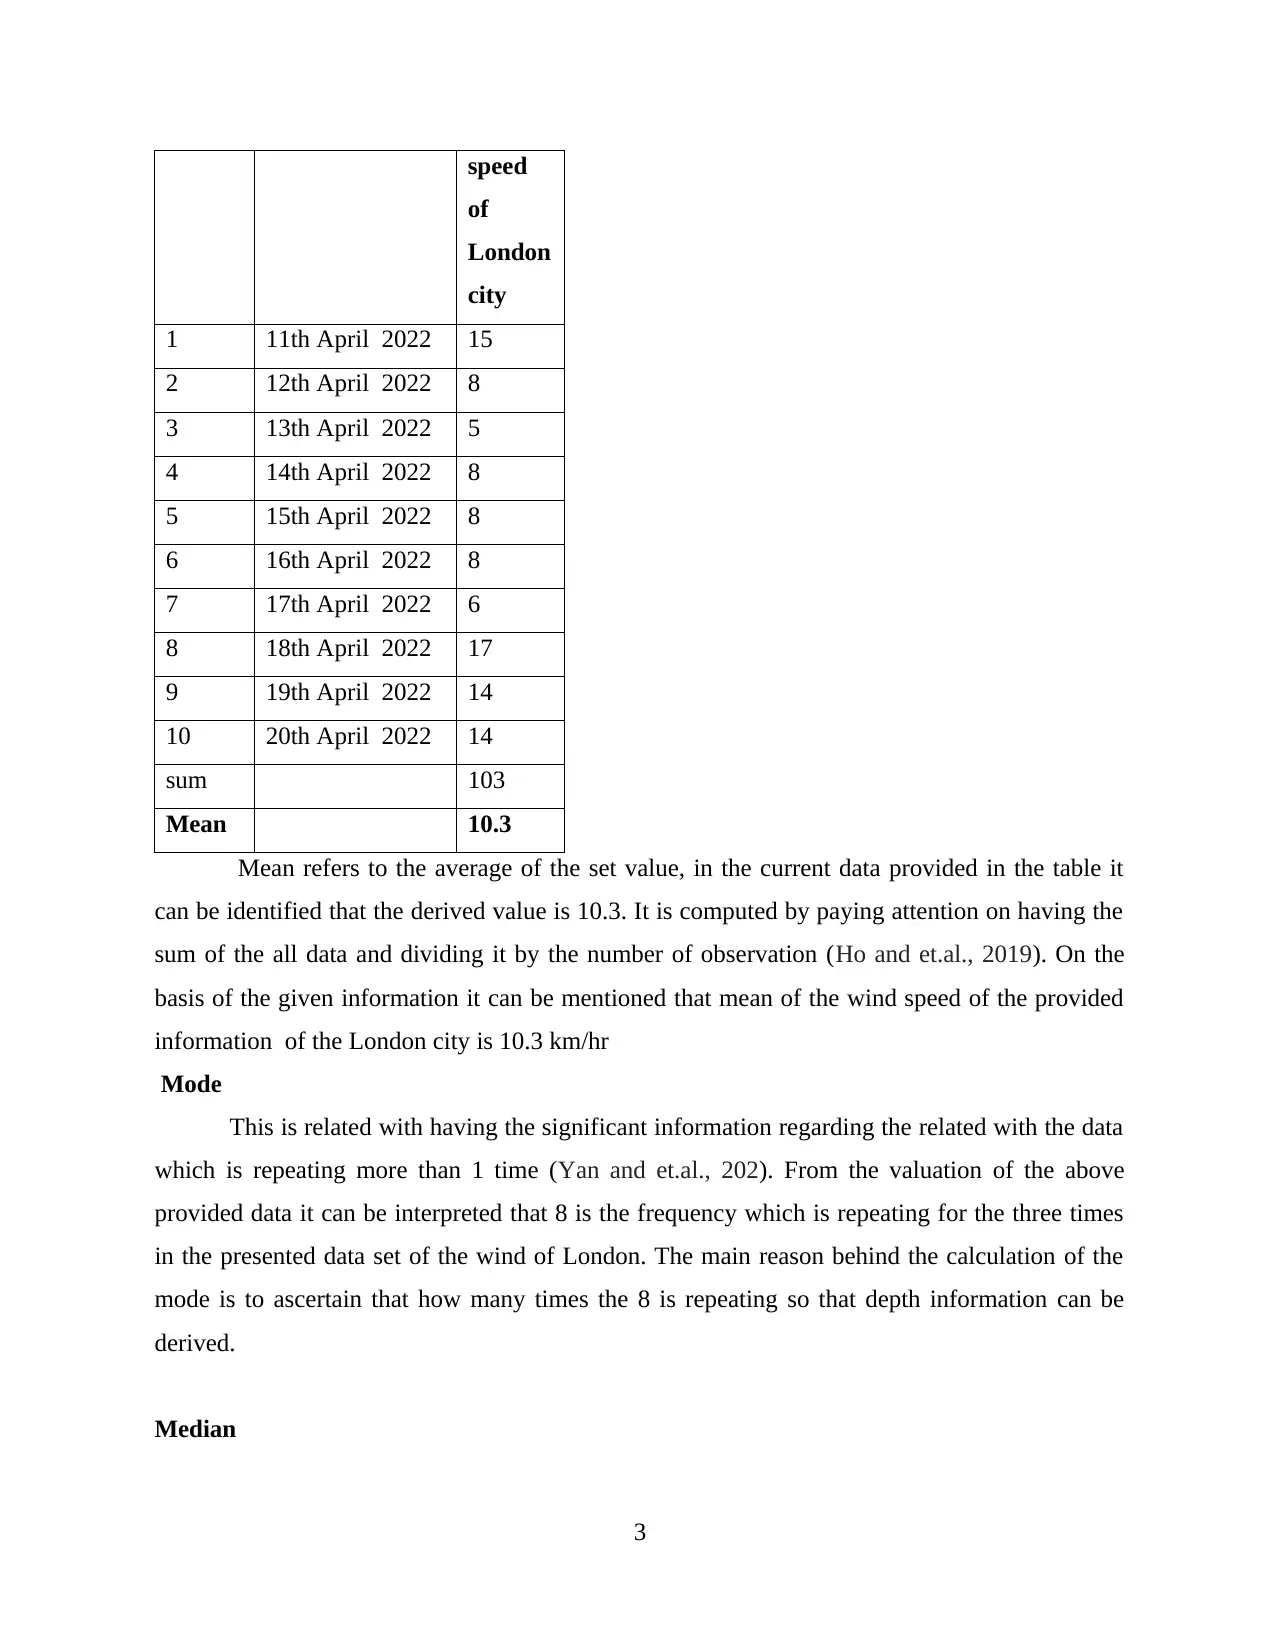
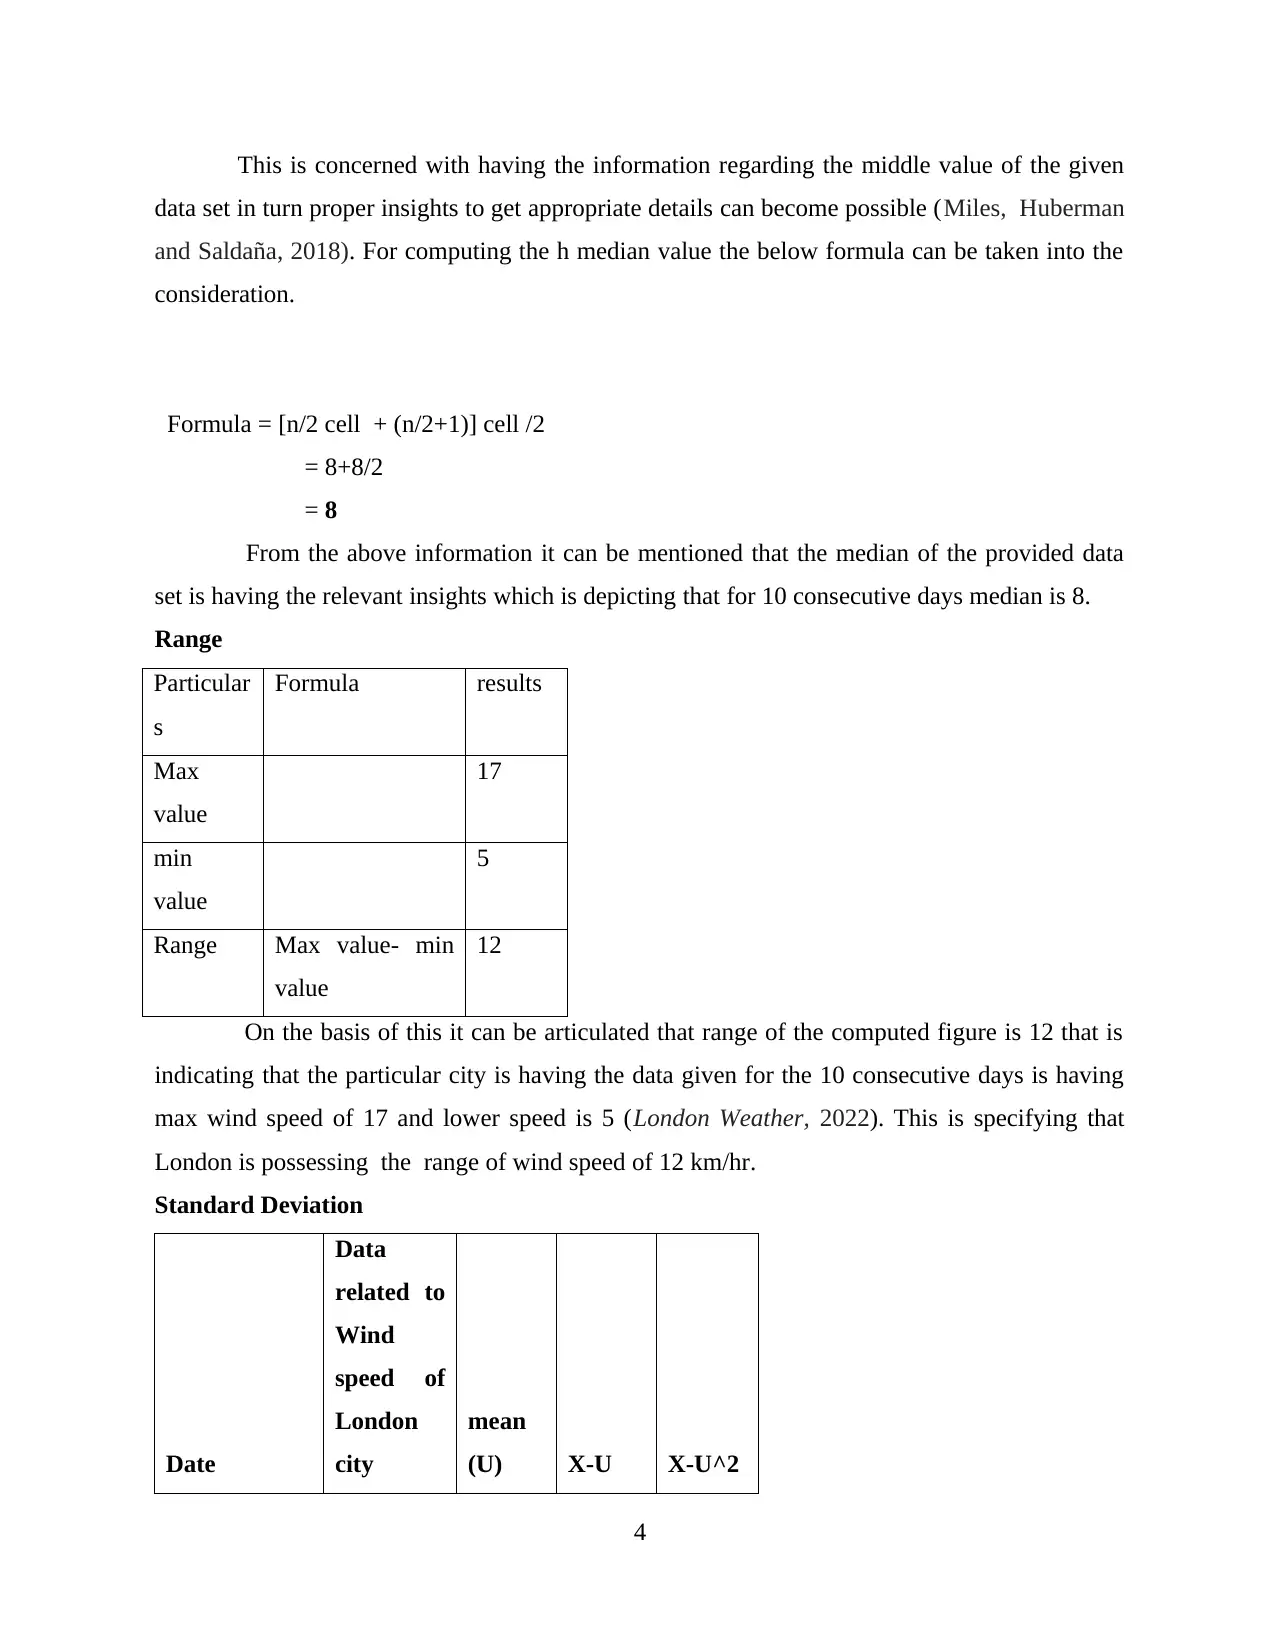
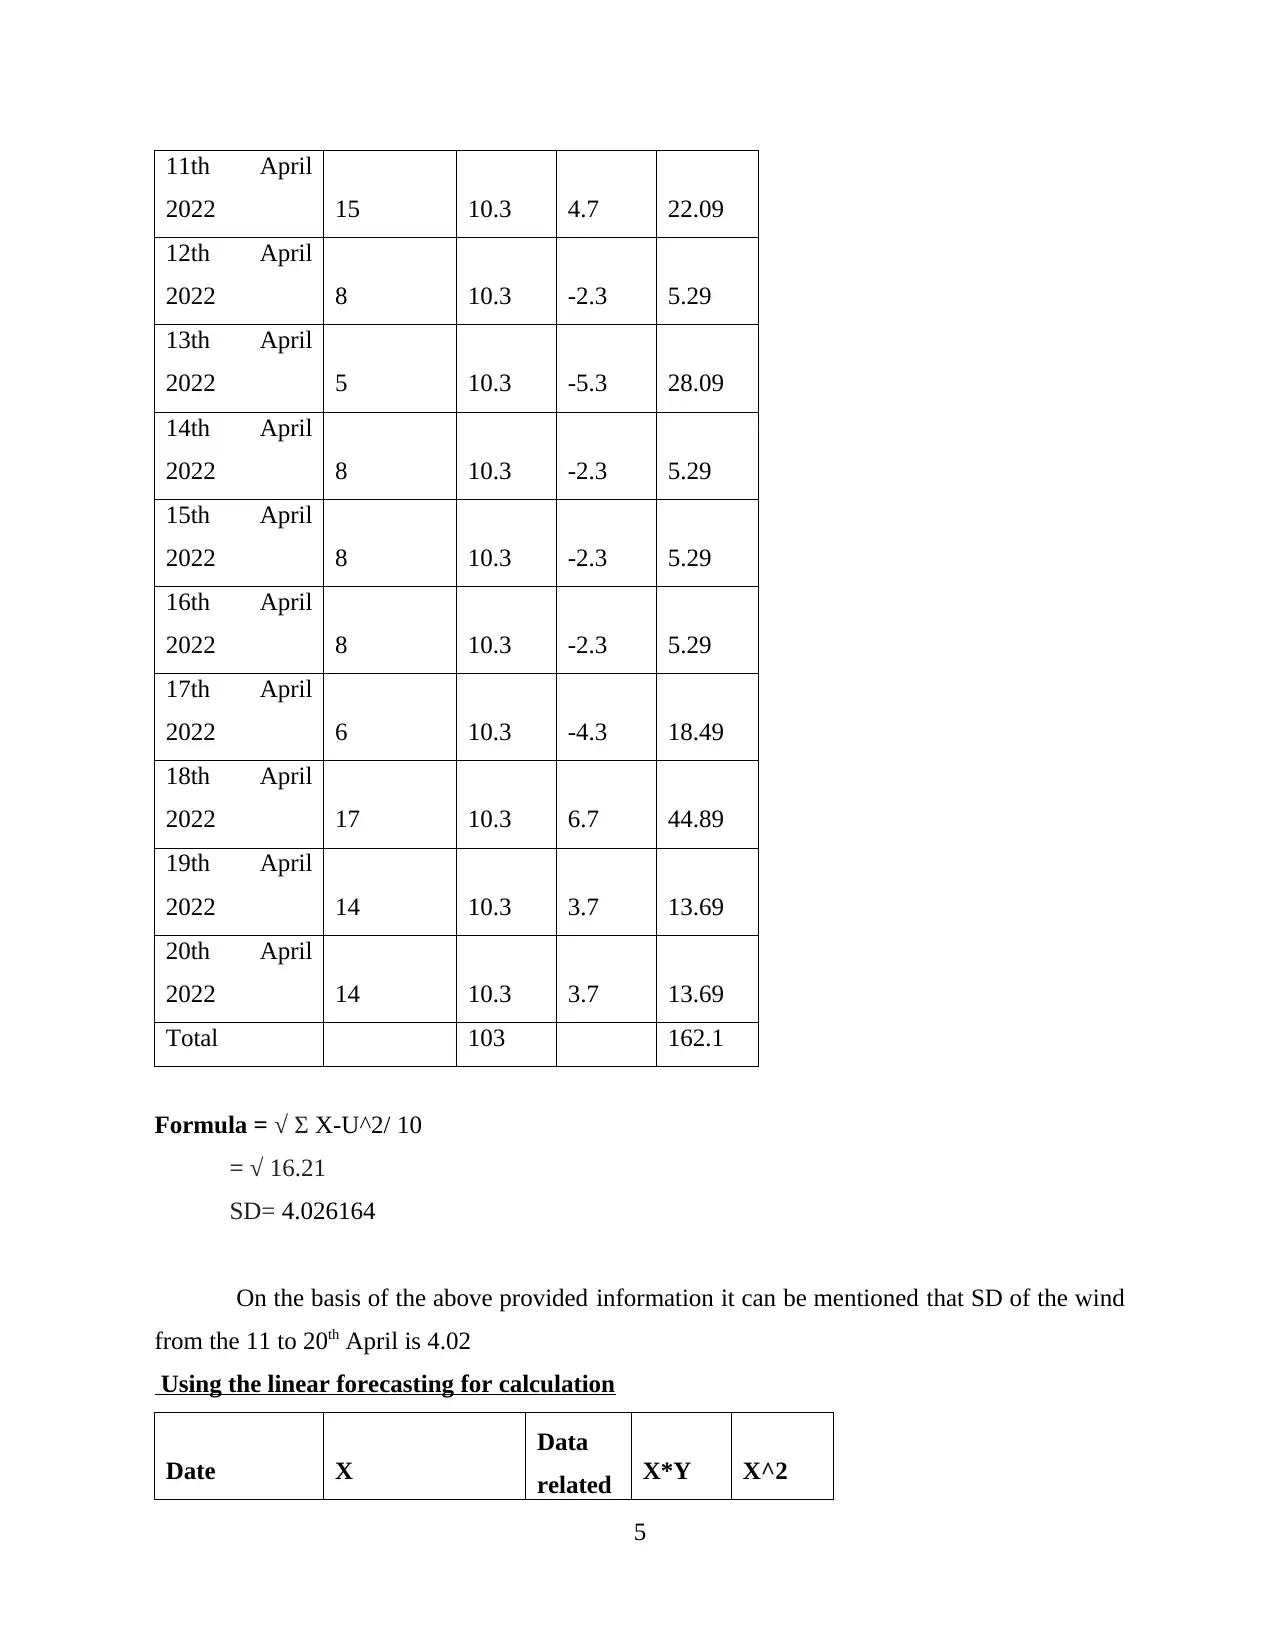
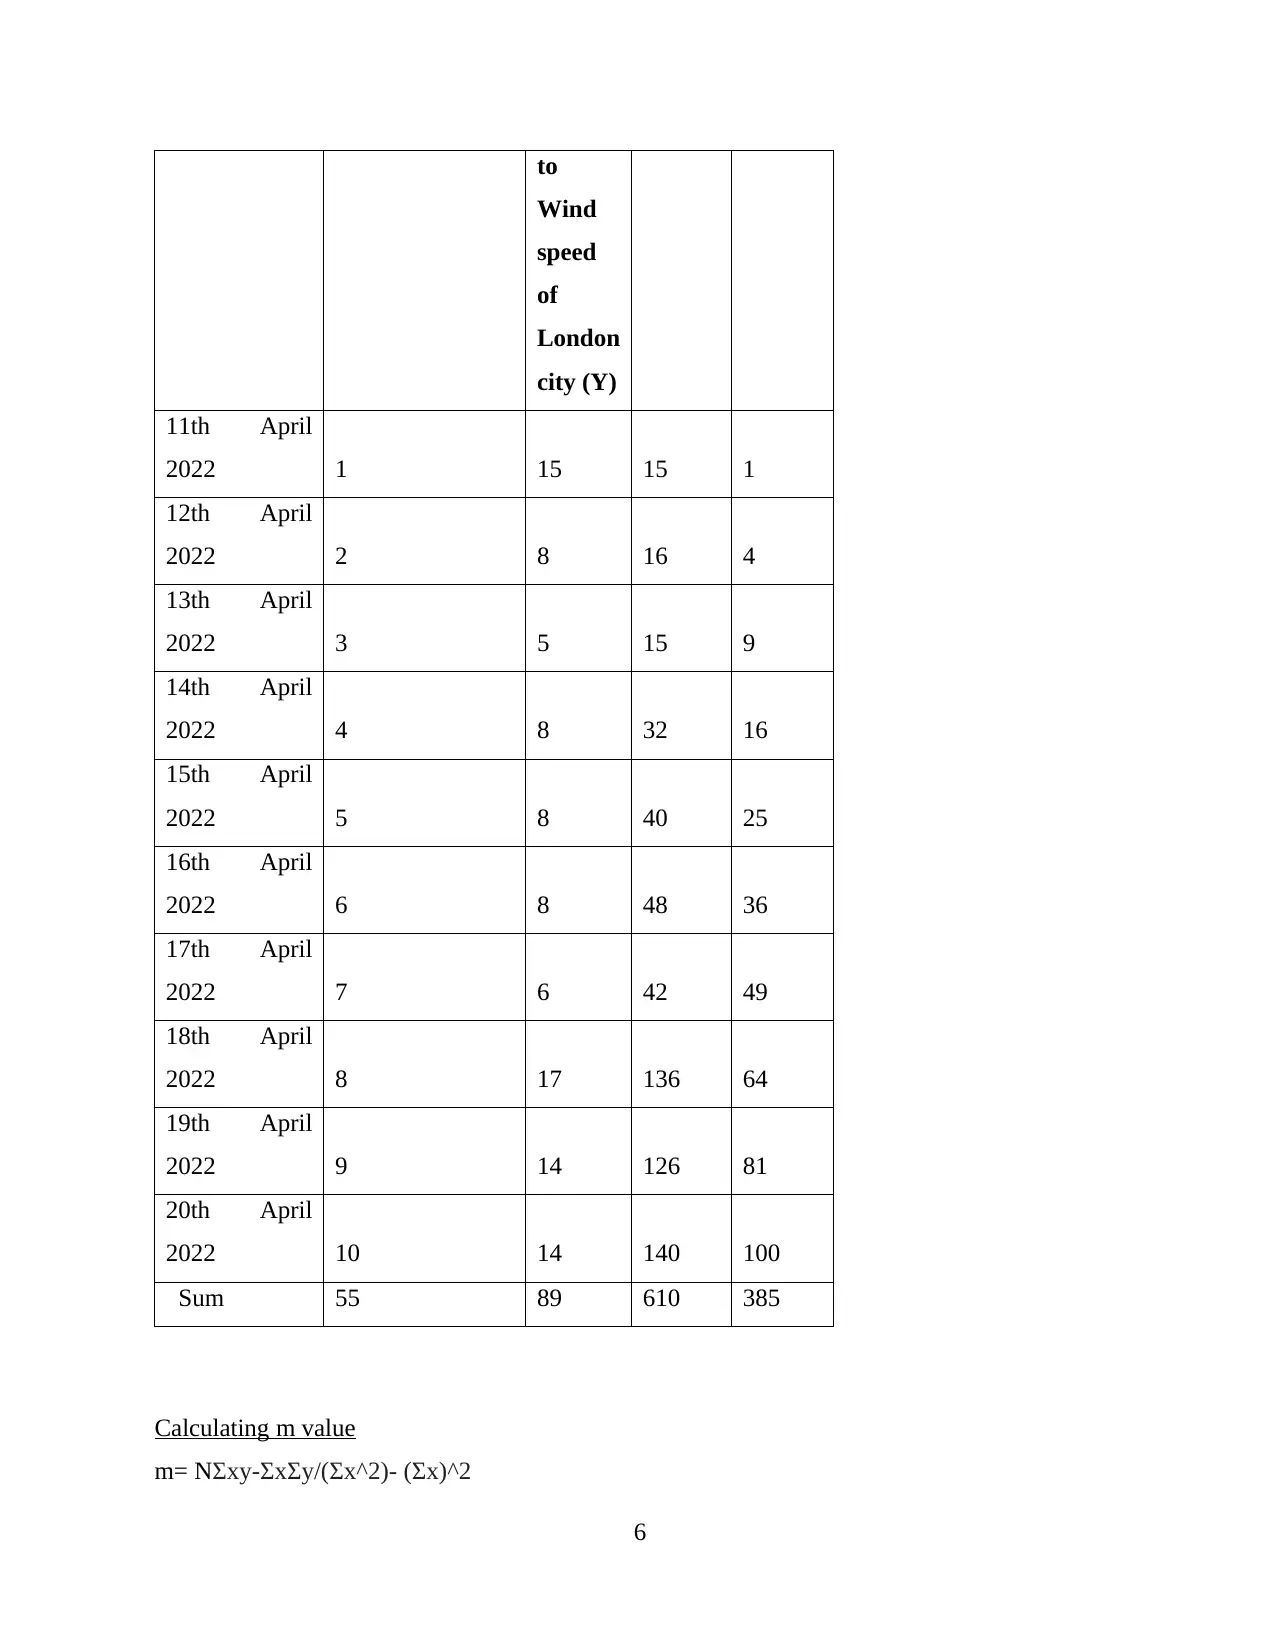
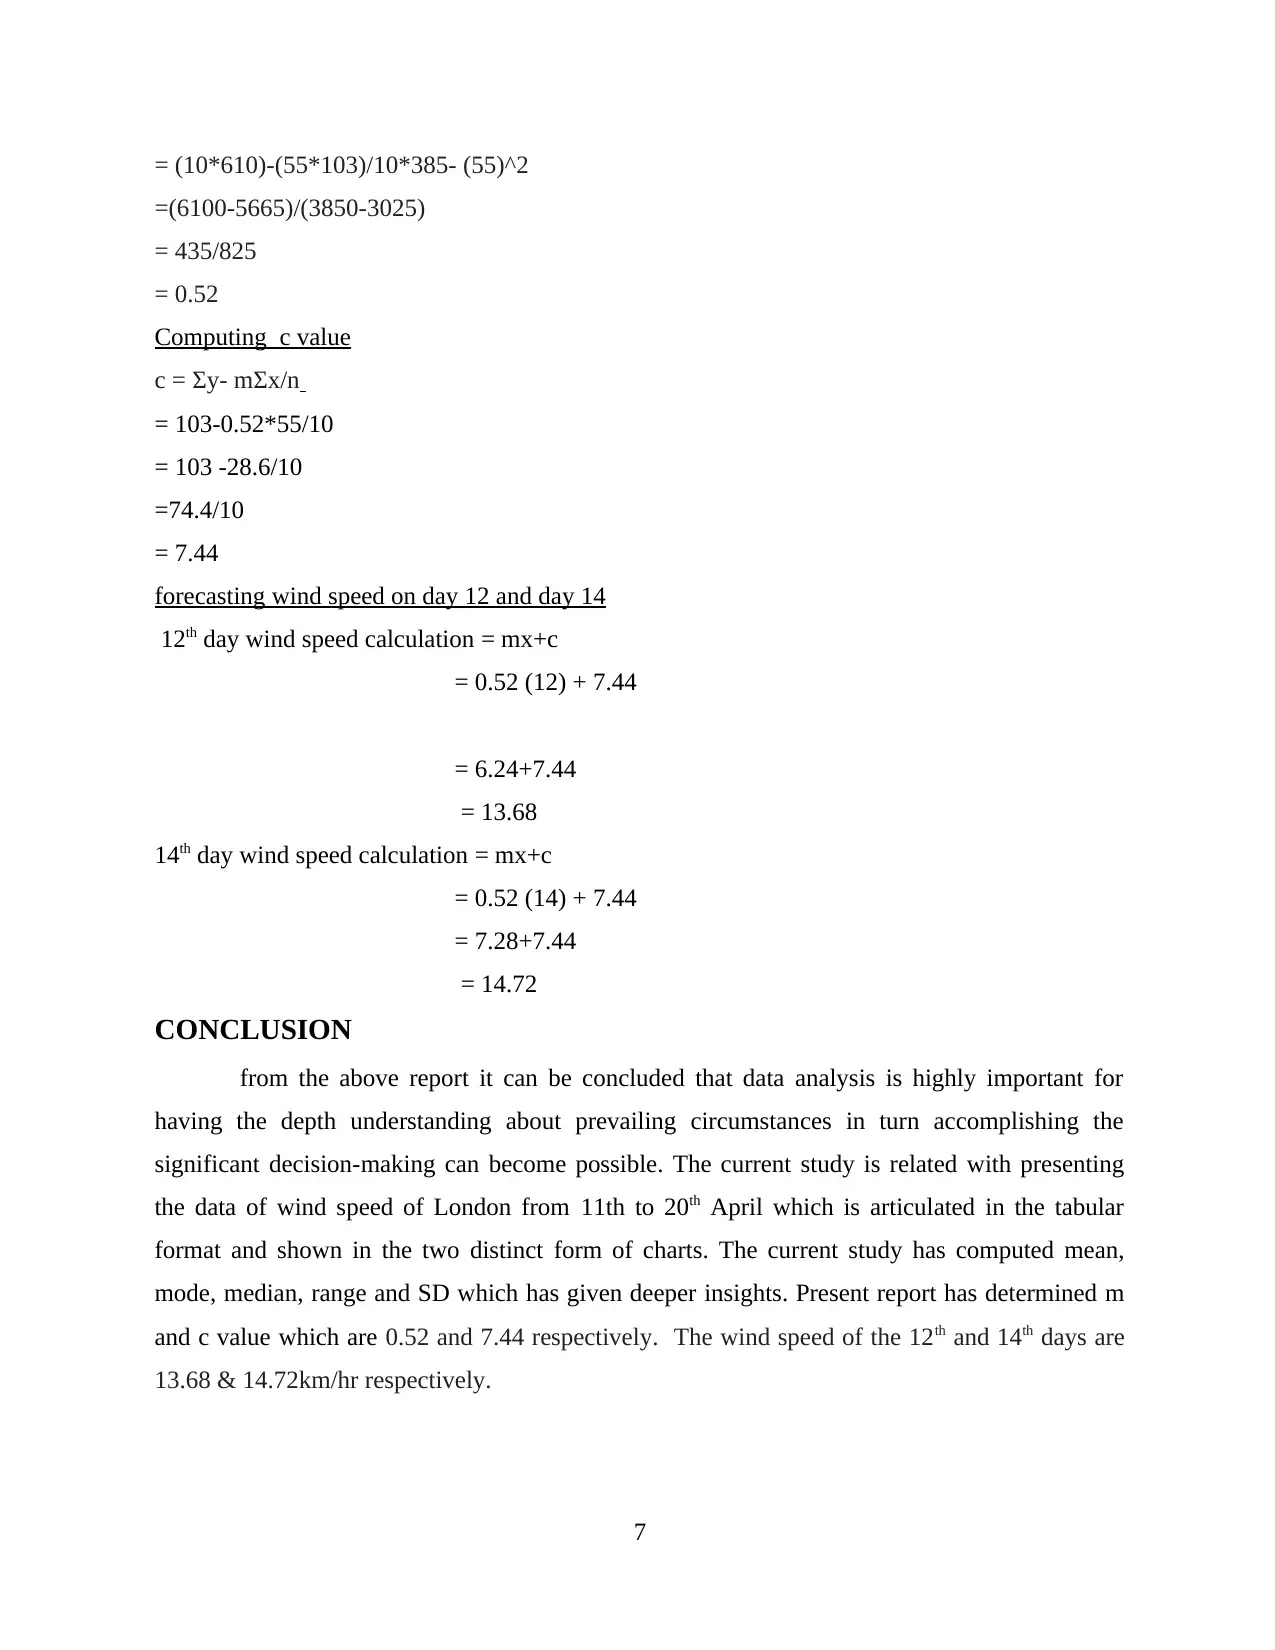
This report provides a comprehensive analysis of wind speed data for London, covering the period from April 11th to April 20th. The data is presented in tabular format and visualized using appropriate charts. Key statistical measures, including mean, mode, median, range, and standard deviation, are calculated to provide insights into the wind speed patterns. Furthermore, a linear forecasting model is applied to estimate the 'm' and 'c' values, and to predict the wind speed on the 12th and 14th days of the period, resulting in forecasts of 13.68 km/hr and 14.72 km/hr, respectively. The analysis highlights the importance of data analysis in understanding environmental factors and supporting informed decision-making. Desklib offers access to a wide range of solved assignments and study resources for students.
tabler-icon-diamond-filled.svg

Contribute Materials

Your contribution can guide someone’s learning journey. Share your documents today.
Document Page
Data Analysis and
Forecasting
tabler-icon-diamond-filled.svg

Secure Best Marks with AI Grader

Need help grading? Try our AI Grader for instant feedback on your assignments.
Document Page
TABLE OF CONTENTS
INTRODUCTION ..........................................................................................................................1
MAIN BODY...................................................................................................................................1
Tabular format of the data of wind of the city London .............................................................1
Present the data using two types of appropriate charts...............................................................2
Calculating as follows:................................................................................................................2
Using the linear forecasting for calculation...............................................................................5
CONCLUSION ...............................................................................................................................6
REFERENCES................................................................................................................................8
Document Page
INTRODUCTION
Data analysis is concerned with having the significant process of inspecting, cleansing,
transforming and modelling data in turn accomplishing the goal of discovering the crucial
information which can allow getting appropriate decision-making. In the current era, there are
different form of aspects which are basically required to be evaluated in order to have the crucial
insights through forecasting via having data analysis. The present report is based on wind speed
of London city of UK. It will present the data in tabular format. Presentation of data in tow
types chars and calculation of mean, median, mode, range and standard deviation. Current
investigation will emphasize on n using linear h forecasting model for computing value of m, c
and wind speed on day 12 & 14 for h gaining depth understanding.
MAIN BODY
Tabular format of the data of wind of the city London
S. No. Date
Data
related
to
Wind
speed
of
London
city
1 11th April 2022 15
2 12th April 2022 8
3 13th April 2022 5
4 14th April 2022 8
5 15th April 2022 8
6 16th April 2022 8
7 17th April 2022 6
8 18th April 2022 17
9 19th April 2022 14
10 20th April 2022 14
1
Document Page
Present the data using two types of appropriate charts
Calculating as follows:
Mean
S. No. Date Data
related
to
Wind
2
tabler-icon-diamond-filled.svg

Secure Best Marks with AI Grader

Need help grading? Try our AI Grader for instant feedback on your assignments.
Document Page
speed
of
London
city
1 11th April 2022 15
2 12th April 2022 8
3 13th April 2022 5
4 14th April 2022 8
5 15th April 2022 8
6 16th April 2022 8
7 17th April 2022 6
8 18th April 2022 17
9 19th April 2022 14
10 20th April 2022 14
sum 103
Mean 10.3
Mean refers to the average of the set value, in the current data provided in the table it
can be identified that the derived value is 10.3. It is computed by paying attention on having the
sum of the all data and dividing it by the number of observation (Ho and et.al., 2019). On the
basis of the given information it can be mentioned that mean of the wind speed of the provided
information of the London city is 10.3 km/hr
Mode
This is related with having the significant information regarding the related with the data
which is repeating more than 1 time (Yan and et.al., 202). From the valuation of the above
provided data it can be interpreted that 8 is the frequency which is repeating for the three times
in the presented data set of the wind of London. The main reason behind the calculation of the
mode is to ascertain that how many times the 8 is repeating so that depth information can be
derived.
Median
3
Document Page
This is concerned with having the information regarding the middle value of the given
data set in turn proper insights to get appropriate details can become possible (Miles, Huberman
and Saldaña, 2018). For computing the h median value the below formula can be taken into the
consideration.
Formula = [n/2 cell + (n/2+1)] cell /2
= 8+8/2
= 8
From the above information it can be mentioned that the median of the provided data
set is having the relevant insights which is depicting that for 10 consecutive days median is 8.
Range
Particular
s
Formula results
Max
value
17
min
value
5
Range Max value- min
value
12
On the basis of this it can be articulated that range of the computed figure is 12 that is
indicating that the particular city is having the data given for the 10 consecutive days is having
max wind speed of 17 and lower speed is 5 (London Weather, 2022). This is specifying that
London is possessing the range of wind speed of 12 km/hr.
Standard Deviation
Date
Data
related to
Wind
speed of
London
city
mean
(U) X-U X-U^2
4
Document Page
11th April
2022 15 10.3 4.7 22.09
12th April
2022 8 10.3 -2.3 5.29
13th April
2022 5 10.3 -5.3 28.09
14th April
2022 8 10.3 -2.3 5.29
15th April
2022 8 10.3 -2.3 5.29
16th April
2022 8 10.3 -2.3 5.29
17th April
2022 6 10.3 -4.3 18.49
18th April
2022 17 10.3 6.7 44.89
19th April
2022 14 10.3 3.7 13.69
20th April
2022 14 10.3 3.7 13.69
Total 103 162.1
Formula = Σ X-U^2/ 10
= 16.21
SD= 4.026164
On the basis of the above provided information it can be mentioned that SD of the wind
from the 11 to 20th April is 4.02
Using the linear forecasting for calculation
Date X
Data
related X*Y X^2
5
tabler-icon-diamond-filled.svg

Paraphrase This Document

Need a fresh take? Get an instant paraphrase of this document with our AI Paraphraser
Document Page
to
Wind
speed
of
London
city (Y)
11th April
2022 1 15 15 1
12th April
2022 2 8 16 4
13th April
2022 3 5 15 9
14th April
2022 4 8 32 16
15th April
2022 5 8 40 25
16th April
2022 6 8 48 36
17th April
2022 7 6 42 49
18th April
2022 8 17 136 64
19th April
2022 9 14 126 81
20th April
2022 10 14 140 100
Sum 55 89 610 385
Calculating m value
m= NΣxy-ΣxΣy/(Σx^2)- (Σx)^2
6
Document Page
= (10*610)-(55*103)/10*385- (55)^2
=(6100-5665)/(3850-3025)
= 435/825
= 0.52
Computing c value
c = Σy- mΣx/n
= 103-0.52*55/10
= 103 -28.6/10
=74.4/10
= 7.44
forecasting wind speed on day 12 and day 14
12th day wind speed calculation = mx+c
= 0.52 (12) + 7.44
= 6.24+7.44
= 13.68
14th day wind speed calculation = mx+c
= 0.52 (14) + 7.44
= 7.28+7.44
= 14.72
CONCLUSION
from the above report it can be concluded that data analysis is highly important for
having the depth understanding about prevailing circumstances in turn accomplishing the
significant decision-making can become possible. The current study is related with presenting
the data of wind speed of London from 11th to 20th April which is articulated in the tabular
format and shown in the two distinct form of charts. The current study has computed mean,
mode, median, range and SD which has given deeper insights. Present report has determined m
and c value which are 0.52 and 7.44 respectively. The wind speed of the 12th and 14th days are
13.68 & 14.72km/hr respectively.
7
Document Page
REFERENCES
Books and Journals
Ho, J. and et.al., 2019. Moving beyond P values: data analysis with estimation graphics. Nature
methods. 16(7). pp.565-566.
Miles, M.B., Huberman, A.M. and Saldaña, J., 2018. Qualitative data analysis: A methods
sourcebook. Sage publications.
Yan, F. and et.al., 2020. From reads to insight: a hitchhiker’s guide to ATAC-seq data
analysis. Genome biology. 21(1). pp.1-16.
Online
London Weather. 2022. [Online]. Available through :
<https://www.worldweatheronline.com/london-weather-history/city-of-london-greater-
london/gb.aspx>
8
chevron_up_icon
1 out of 10
circle_padding
hide_on_mobile
zoom_out_icon
logo.png

Your All-in-One AI-Powered Toolkit for Academic Success.

Available 24*7 on WhatsApp / Email

[object Object]