Financial Performance Evaluation: Lookers Plc vs. Pendragon Plc
VerifiedAdded on 2023/01/06
|14
|2883
|28
Report
AI Summary
This report provides a financial analysis of Lookers Plc, comparing its performance with Pendragon Plc. It begins with an executive summary highlighting Lookers' 2018 financial results, including revenue, profit, and ROCE, and a discussion of strategic developments. The report then delves into external factors using PEST analysis, examining political, economic, social, and technological influences on Lookers. Internal factors are assessed through a SWOT analysis, identifying strengths, weaknesses, opportunities, and threats. The core of the analysis involves ratio analysis, including profitability ratios (ROCE, gross profit, net profit), efficiency ratios (asset turnover, working capital turnover), liquidity ratios (current ratio, quick ratio), and shareholder ratios (earnings per share). The report interprets these ratios, comparing Lookers Plc's performance to Pendragon's, and drawing conclusions about Lookers' financial health and operational efficiency.

Financial Strength
1
1
Paraphrase This Document
Need a fresh take? Get an instant paraphrase of this document with our AI Paraphraser
EXECUTIVE SUMMARY
Lookers Plc. announced their new strategy for 2019 to embark the competitive advantages
against the automotive market.
In 2018, Lookers Plc.’s profit before tax is £67.3m, slightly decreased 1.6% YoY (2017:
£68.4m), revenue increased to £4.9bn (2017: £4.7bn). Their used car volume growth offsets
margin pressure
and continued strong growth in aftersales division. Furthermore, Lookers had adjusted earnings
per share to 14.68p from 14.57p in 2017, final dividend increased by 5% per share
(Lookersplc.com., 2019). Taken together with its strong financial performance and position,
shows Lookers is a competitive company in the market. In 2018, Looker’s ROCE is 11.2%,
recorded 1.72% points down compare with 2017, the fall was caused by cost inflation in
property, salaries and investment to improve dealerships, but it is still an impressive return
compared with Pendragon’s ROCE at
-2.1% in 2018.
Looker’s business has significant transformation and developments in recent years. To align with
their business strategy, they closed two underperforming businesses, the Vauxhall dealerships at
Warrington and Yardley in March 2018. In October 2018, they also closed Hyundai and Nissan
business in Motherwell to reduce cost. Besides, they acquired a Ford dealership in July 2018
which complements the larger representation of Ford in Essex and acquired the Jennings Group
for a gross payment of £10.1m. Because of the acquisitions, it incurs reorganization costs of
2
these changes. It has been earnings neutral this year and the group expected a modest
contribution to earnings in 2019 (About Lookersplc, 2019)
Introduction
Lookers Plc. are looking for a new Operations Director, as a recruitment specialist, this report
aims to provide information and analysis to the client who interested with this position.
This report provides recent market position and financial strengths of Lookers Plc, in order to
compare Looker’s performance with that of Pendragon whether to be a good career and financial
move to this senior management position of Lookers Plc. The package would include stock
option, and this would also be a key factor to consider the total package. The CORE Strategic
Financial Analysis Model would apply for elaborate key ratios to compare Lookers Plc and
Pendragon Plc.
External Context
PEST analysis is political factors, economic factors, social factors, technological factors.
Following is a detailed PEST analysis of Lookers plc:
Political factors: Lookers plc is a wide retail company operating in more than dozen
countries, therefore, it is important to study effect of various political factors on company
and its operations. Example of political facrtors affecting company are political stability,
risk of military invasion, level of corruption, bureaucracy, legal framework for contract
enforcement, pricing resulations, etc.
Economic factors: These relates to economic factors like infaltion rate, savings rate,
foreign excgange rates, etc. Lookers plc is affected by various economic factors such as
type of economic system, market structure, operational level of financial markets,
competetive advantage, etc.
Social factors: A company is operating within a society, therefore, there are various
social and cultural factors that effect the culture as well as operations of an organisation.
In case of Lookers plc, example of social factors are demographic and skill level of
people, hierarchy of power structure of society, and various other demographic features.
Technological factors: In dynamically changing business environment, one thing is
constant and that is continuously updating technology level. Therefore, it becomes
necessary to study effect of this change on an organisation. Technological factors that are
3
⊘ This is a preview!⊘
Do you want full access?
Subscribe today to unlock all pages.
Trusted by 1+ million students worldwide
affecting Lookers plc are recent technological upgradation adopted by competetiors,
impacrt of technology on product offered, rate of technology diffusion, etc.
Internal Context
SWOT analysis refers to study about strength, weakness, thretas and opprtunities posed to
organisation. In case of Lookers plc, following results are drawn from SWOT analysis:
Strengths: It has a very strong point of strong distribution network, solid and reliable
base of supplier, possess stromg product portfolio, early adoption of upgraded
technologies.
Weakness: One of the biggest weakness og company is that they invest more in the
channel, i.e. unnnecessary holding of inventory. As compared to their competitors, they
are inevsting very less in research and development department.
Opportunities: There is a chance of cutting their cost of production as there is a
forecasting of decline in transportation cost. This is a great opportunity of boosting
company’s profitability. There is a hidden opportunity in face of permission of fre trade
market. This opportunity can be exploited to enter in a new market and hence, increase
their profitability.
Threats: There is threat to organisation of decline in productivity due to shortage of
labour. It can also be subject to risk of currency fluctuations as the company is operating
in numerous separate countries. Emerging trend of online business is a serious threat
posed to business as it is putting a serious impact on consumer behaviour.
Ratio analysis is done to measure and interpret results drawn in financial statements. This
analysis tool provide an assistance to managers to draw appropriate strategies for
organisation.
Profitability ratios: Under this category of ratios, analysis is done over the profits earned by
company at different points, for instance, gross profit ratio, net profit ratio (Chandra, 2020).
Under it, different kinds of ratios are computed and some of them are explained below :
Return on Capital employed: EBIT/Capital employed
(amount in $, in million except ratio)
4
Paraphrase This Document
Need a fresh take? Get an instant paraphrase of this document with our AI Paraphraser
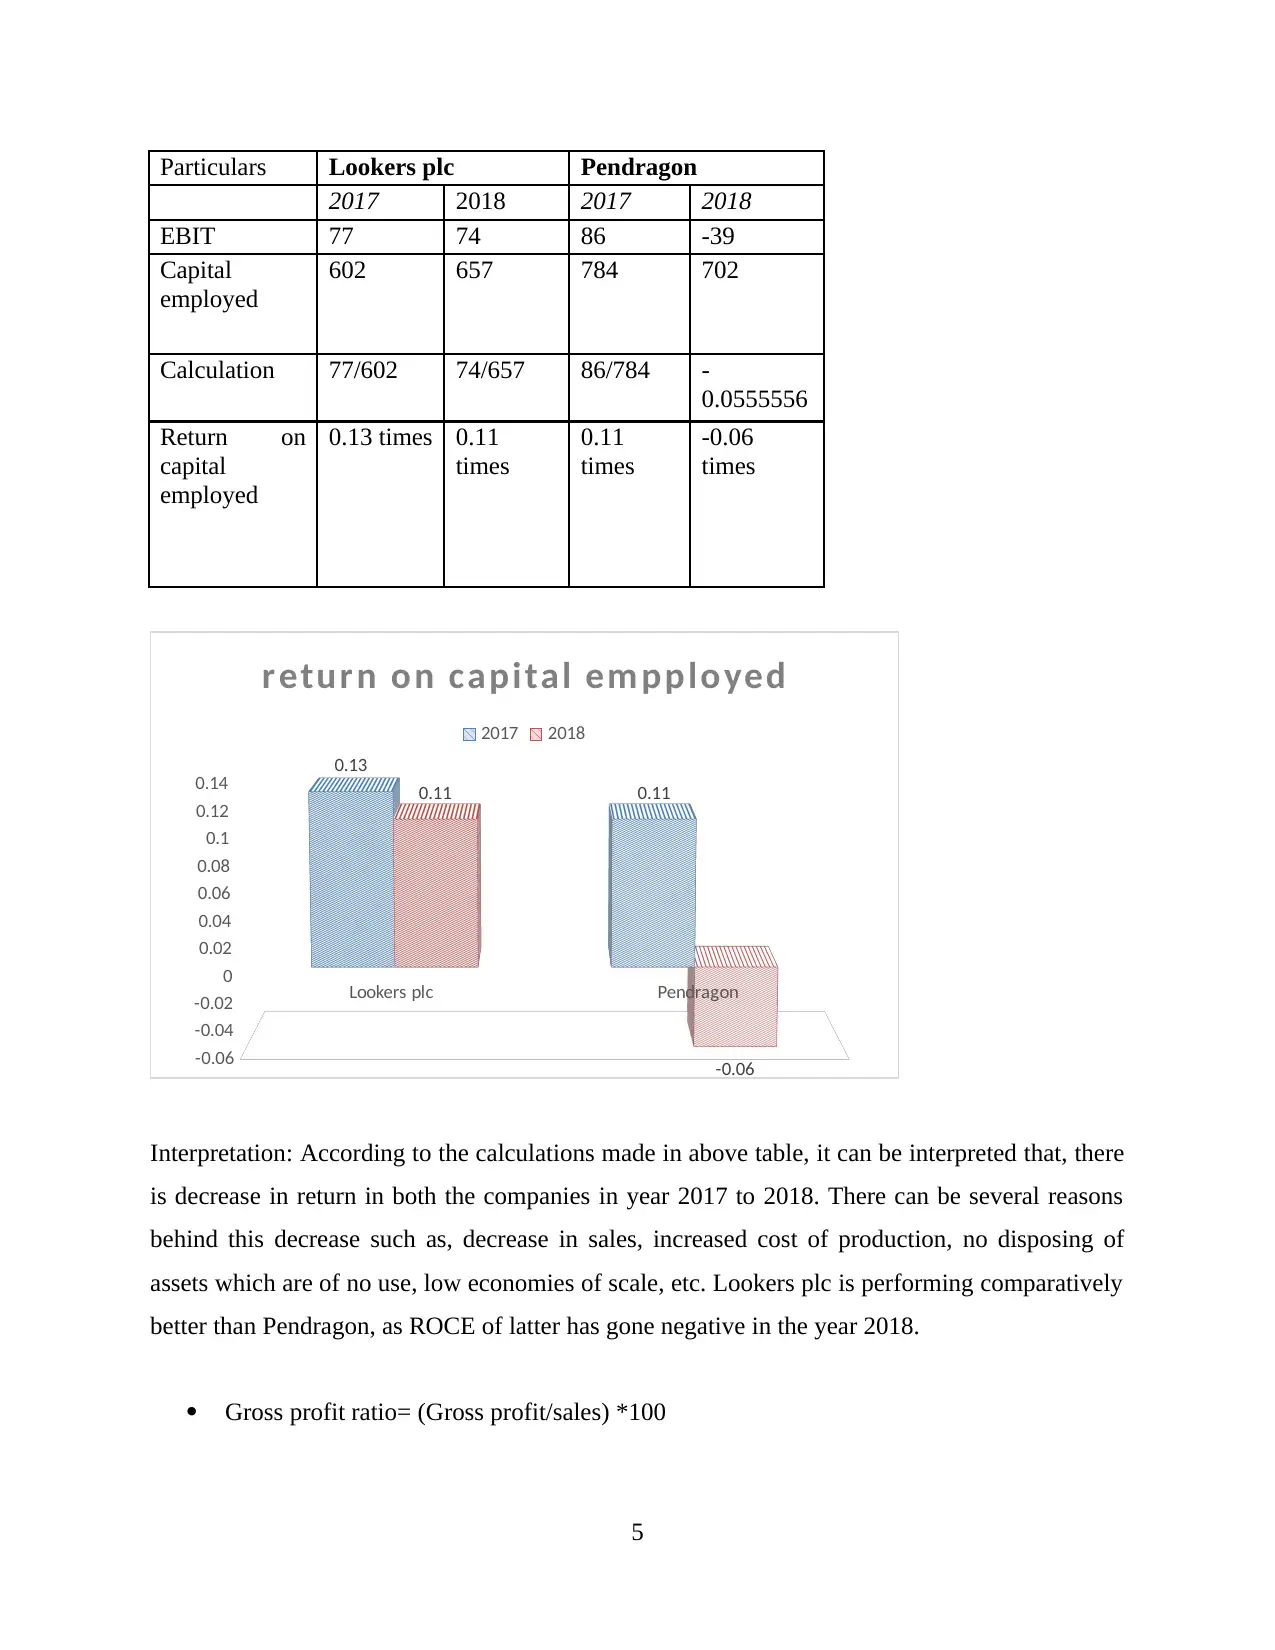
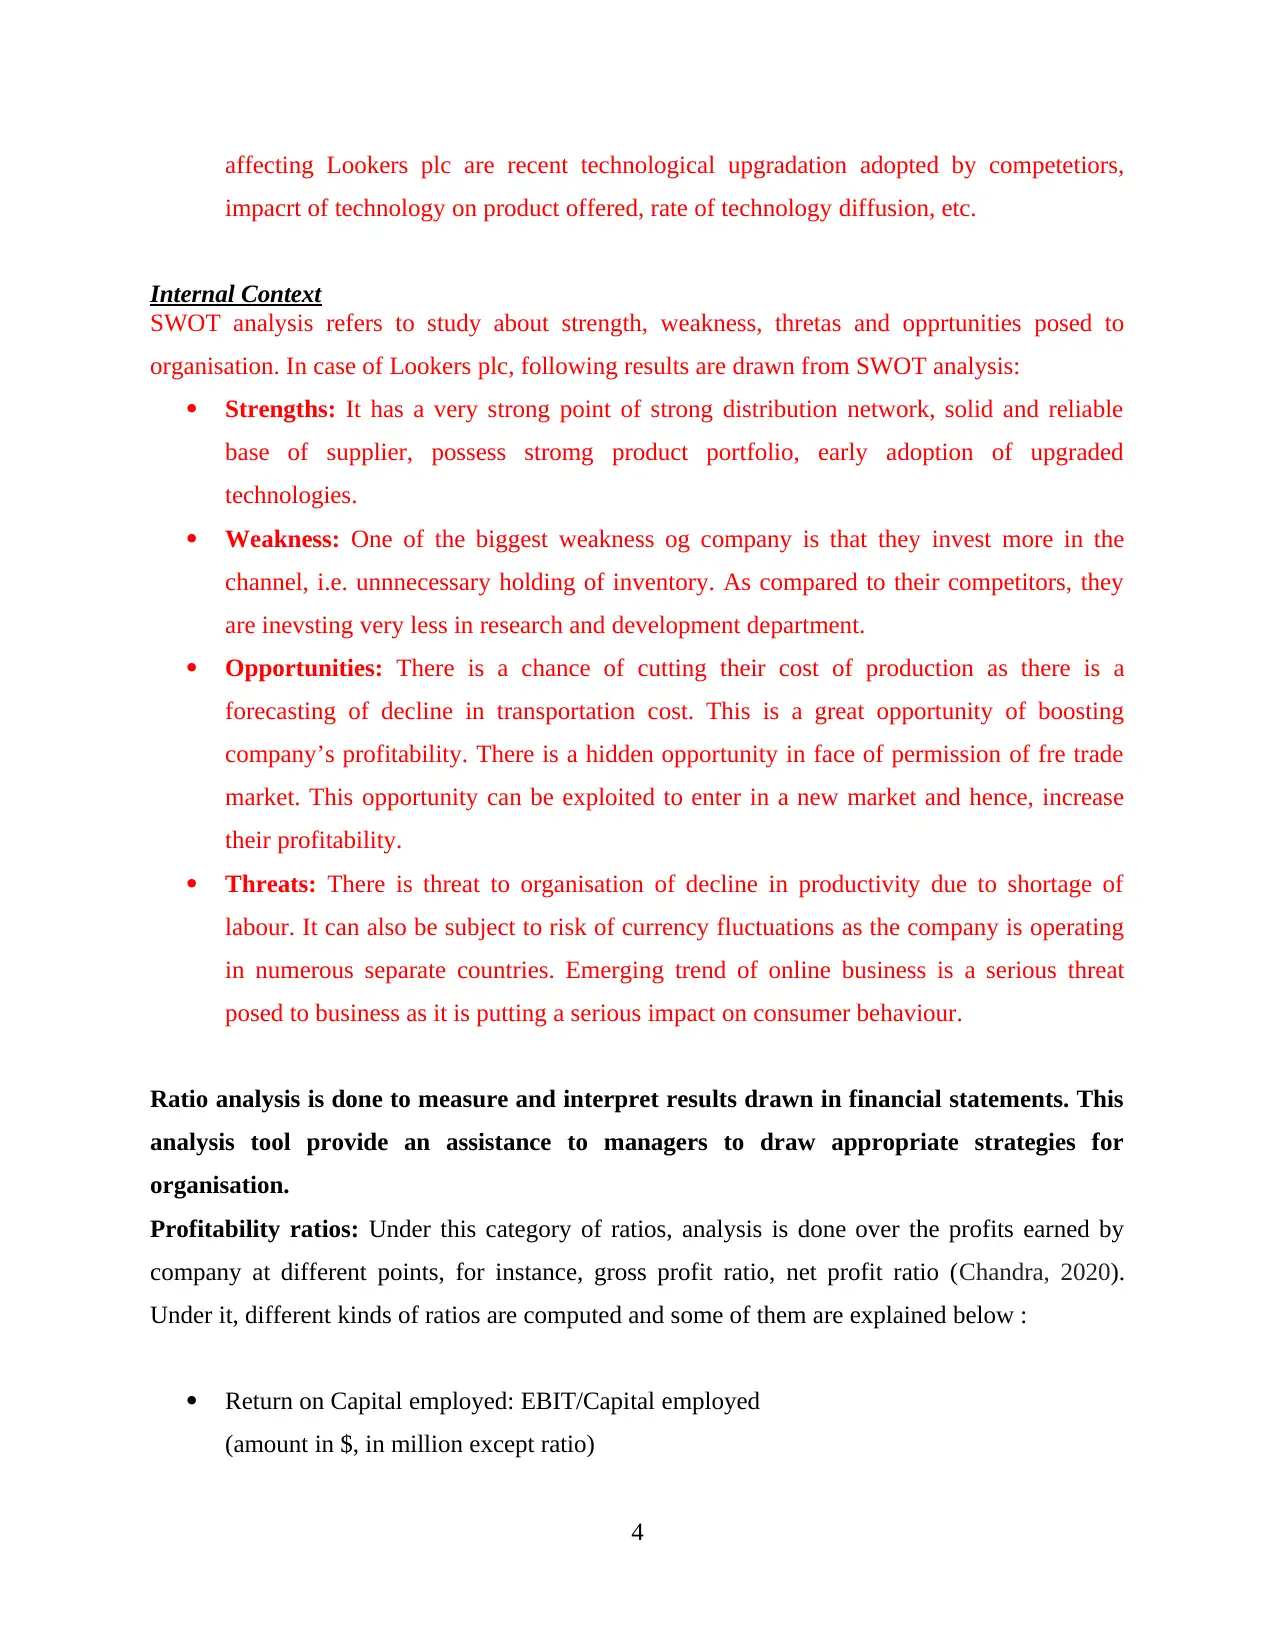
Particulars Lookers plc Pendragon
2017 2018 2017 2018
EBIT 77 74 86 -39
Capital
employed
602 657 784 702
Calculation 77/602 74/657 86/784 -
0.0555556
Return on
capital
employed
0.13 times 0.11
times
0.11
times
-0.06
times
Lookers plc Pendragon
-0.06
-0.04
-0.02
0
0.02
0.04
0.06
0.08
0.1
0.12
0.14 0.13
0.110.11
-0.06
return on capital em pployed
2017 2018
Interpretation: According to the calculations made in above table, it can be interpreted that, there
is decrease in return in both the companies in year 2017 to 2018. There can be several reasons
behind this decrease such as, decrease in sales, increased cost of production, no disposing of
assets which are of no use, low economies of scale, etc. Lookers plc is performing comparatively
better than Pendragon, as ROCE of latter has gone negative in the year 2018.
Gross profit ratio= (Gross profit/sales) *100
5
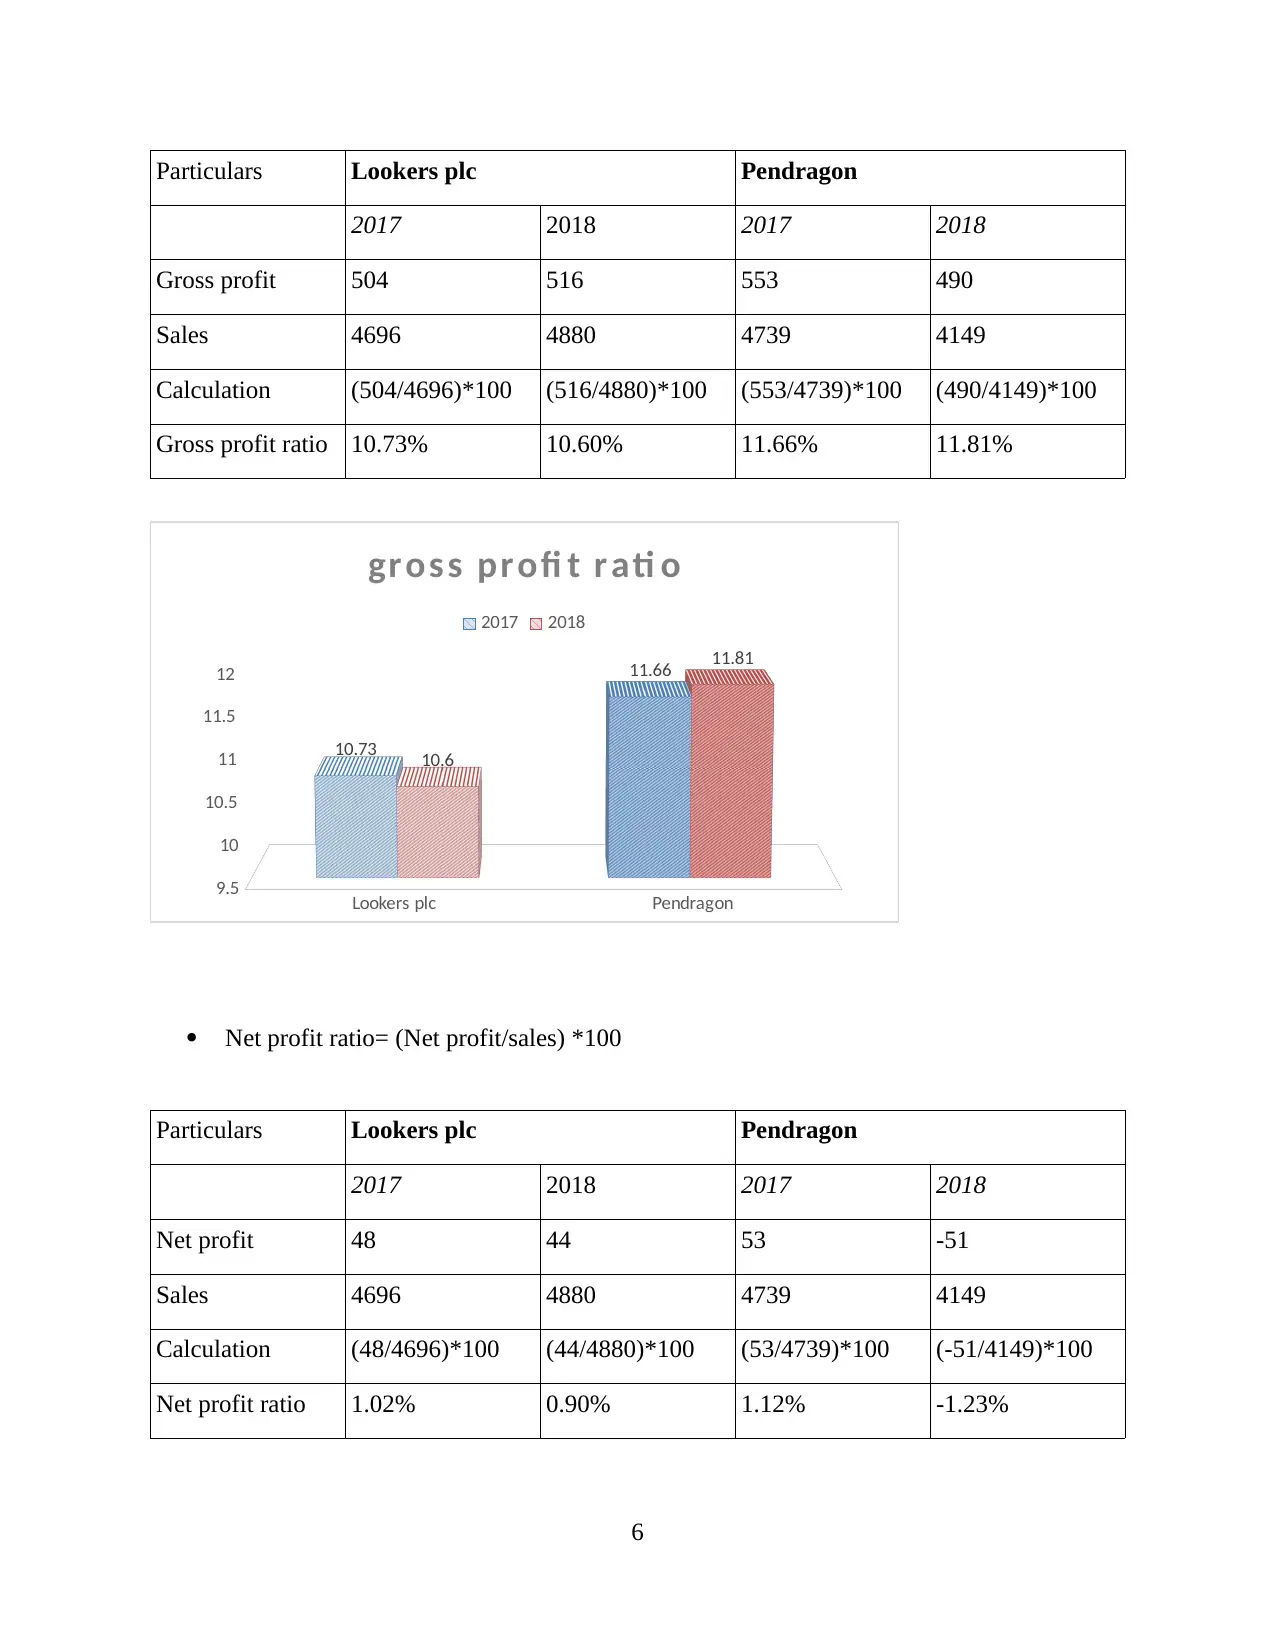
Particulars Lookers plc Pendragon
2017 2018 2017 2018
Gross profit 504 516 553 490
Sales 4696 4880 4739 4149
Calculation (504/4696)*100 (516/4880)*100 (553/4739)*100 (490/4149)*100
Gross profit ratio 10.73% 10.60% 11.66% 11.81%
Lookers plc Pendragon
9.5
10
10.5
11
11.5
12
10.73
11.66
10.6
11.81
gross profi t r ati o
2017 2018
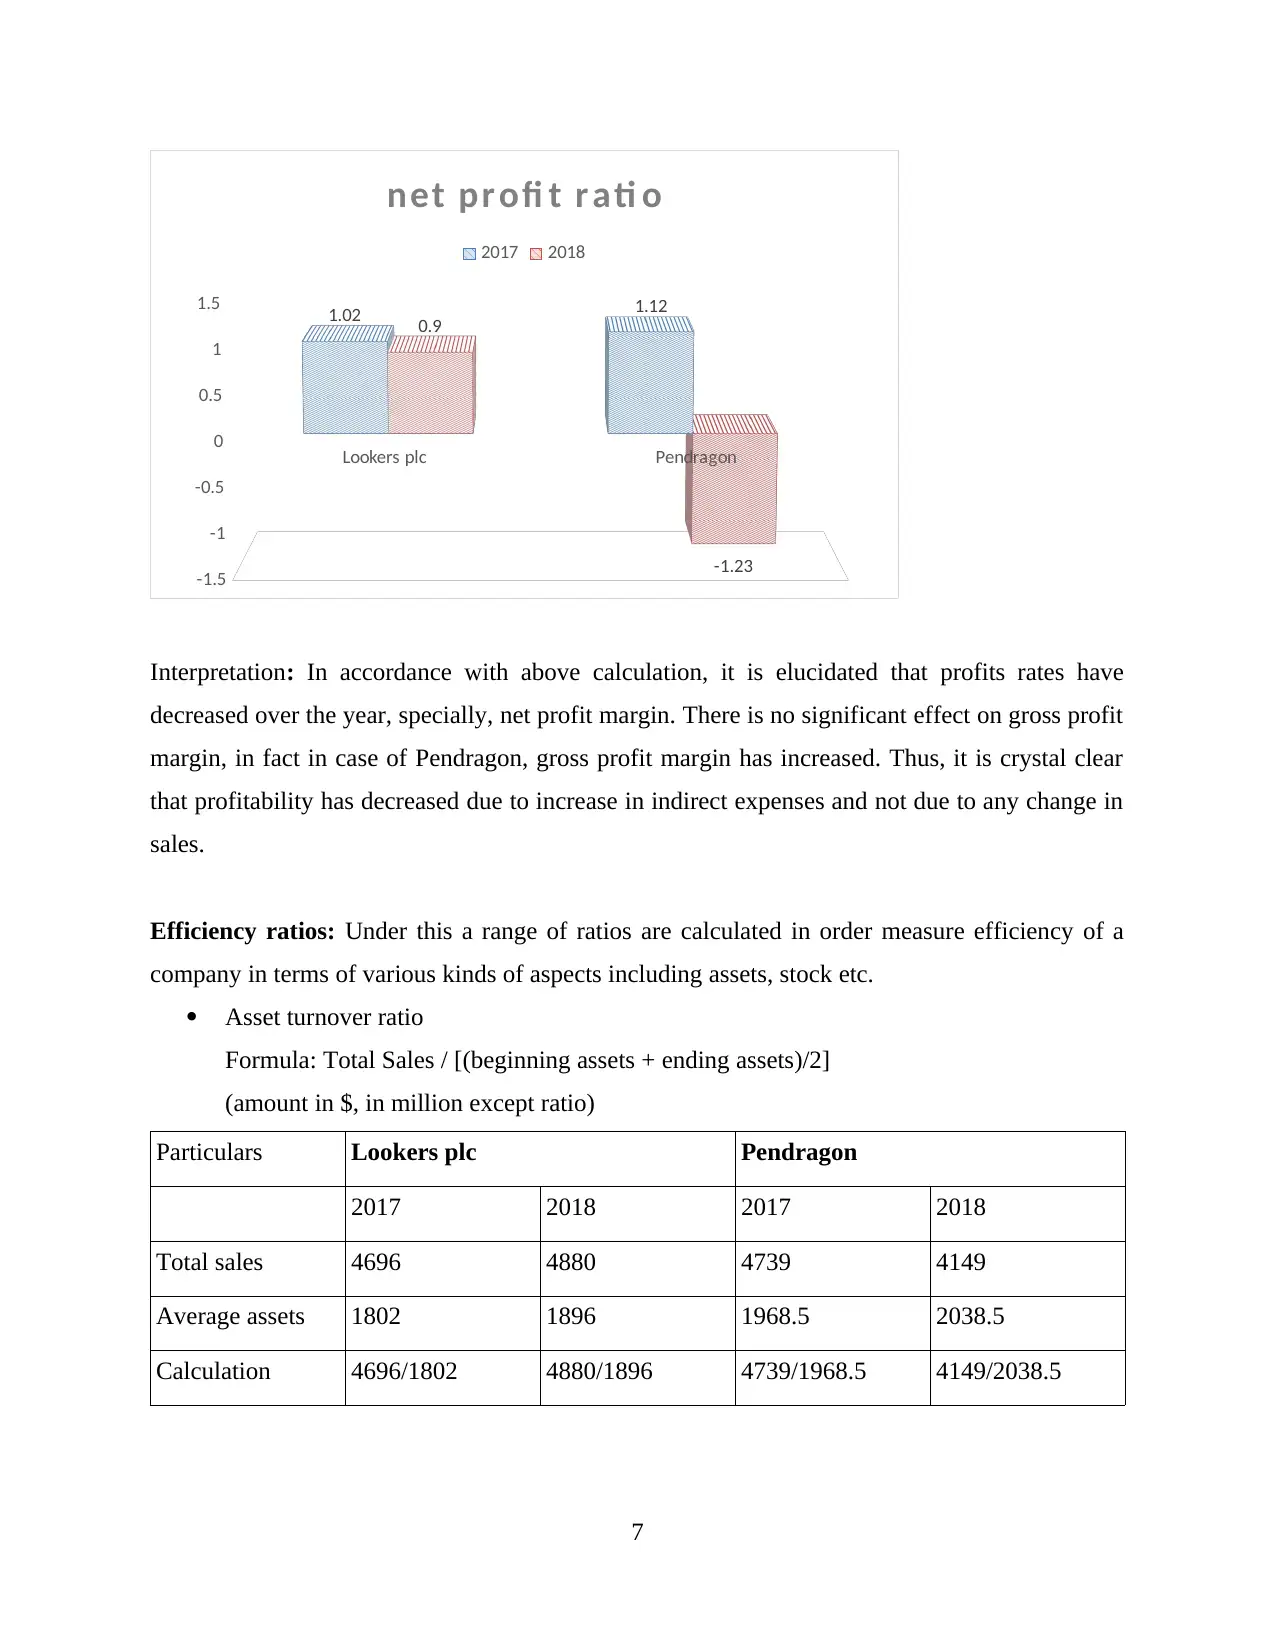
Net profit ratio= (Net profit/sales) *100
Particulars Lookers plc Pendragon
2017 2018 2017 2018
Net profit 48 44 53 -51
Sales 4696 4880 4739 4149
Calculation (48/4696)*100 (44/4880)*100 (53/4739)*100 (-51/4149)*100
Net profit ratio 1.02% 0.90% 1.12% -1.23%
6
2017 2018 2017 2018
Gross profit 504 516 553 490
Sales 4696 4880 4739 4149
Calculation (504/4696)*100 (516/4880)*100 (553/4739)*100 (490/4149)*100
Gross profit ratio 10.73% 10.60% 11.66% 11.81%
Lookers plc Pendragon
9.5
10
10.5
11
11.5
12
10.73
11.66
10.6
11.81
gross profi t r ati o
2017 2018
Net profit ratio= (Net profit/sales) *100
Particulars Lookers plc Pendragon
2017 2018 2017 2018
Net profit 48 44 53 -51
Sales 4696 4880 4739 4149
Calculation (48/4696)*100 (44/4880)*100 (53/4739)*100 (-51/4149)*100
Net profit ratio 1.02% 0.90% 1.12% -1.23%
6
⊘ This is a preview!⊘
Do you want full access?
Subscribe today to unlock all pages.
Trusted by 1+ million students worldwide
Lookers plc Pendragon
-1.5
-1
-0.5
0
0.5
1
1.5 1.02 1.12
0.9
-1.23
net pr ofi t r ati o
2017 2018
Interpretation: In accordance with above calculation, it is elucidated that profits rates have
decreased over the year, specially, net profit margin. There is no significant effect on gross profit
margin, in fact in case of Pendragon, gross profit margin has increased. Thus, it is crystal clear
that profitability has decreased due to increase in indirect expenses and not due to any change in
sales.
Efficiency ratios: Under this a range of ratios are calculated in order measure efficiency of a
company in terms of various kinds of aspects including assets, stock etc.
Asset turnover ratio
Formula: Total Sales / [(beginning assets + ending assets)/2]
(amount in $, in million except ratio)
Particulars Lookers plc Pendragon
2017 2018 2017 2018
Total sales 4696 4880 4739 4149
Average assets 1802 1896 1968.5 2038.5
Calculation 4696/1802 4880/1896 4739/1968.5 4149/2038.5
7
Paraphrase This Document
Need a fresh take? Get an instant paraphrase of this document with our AI Paraphraser
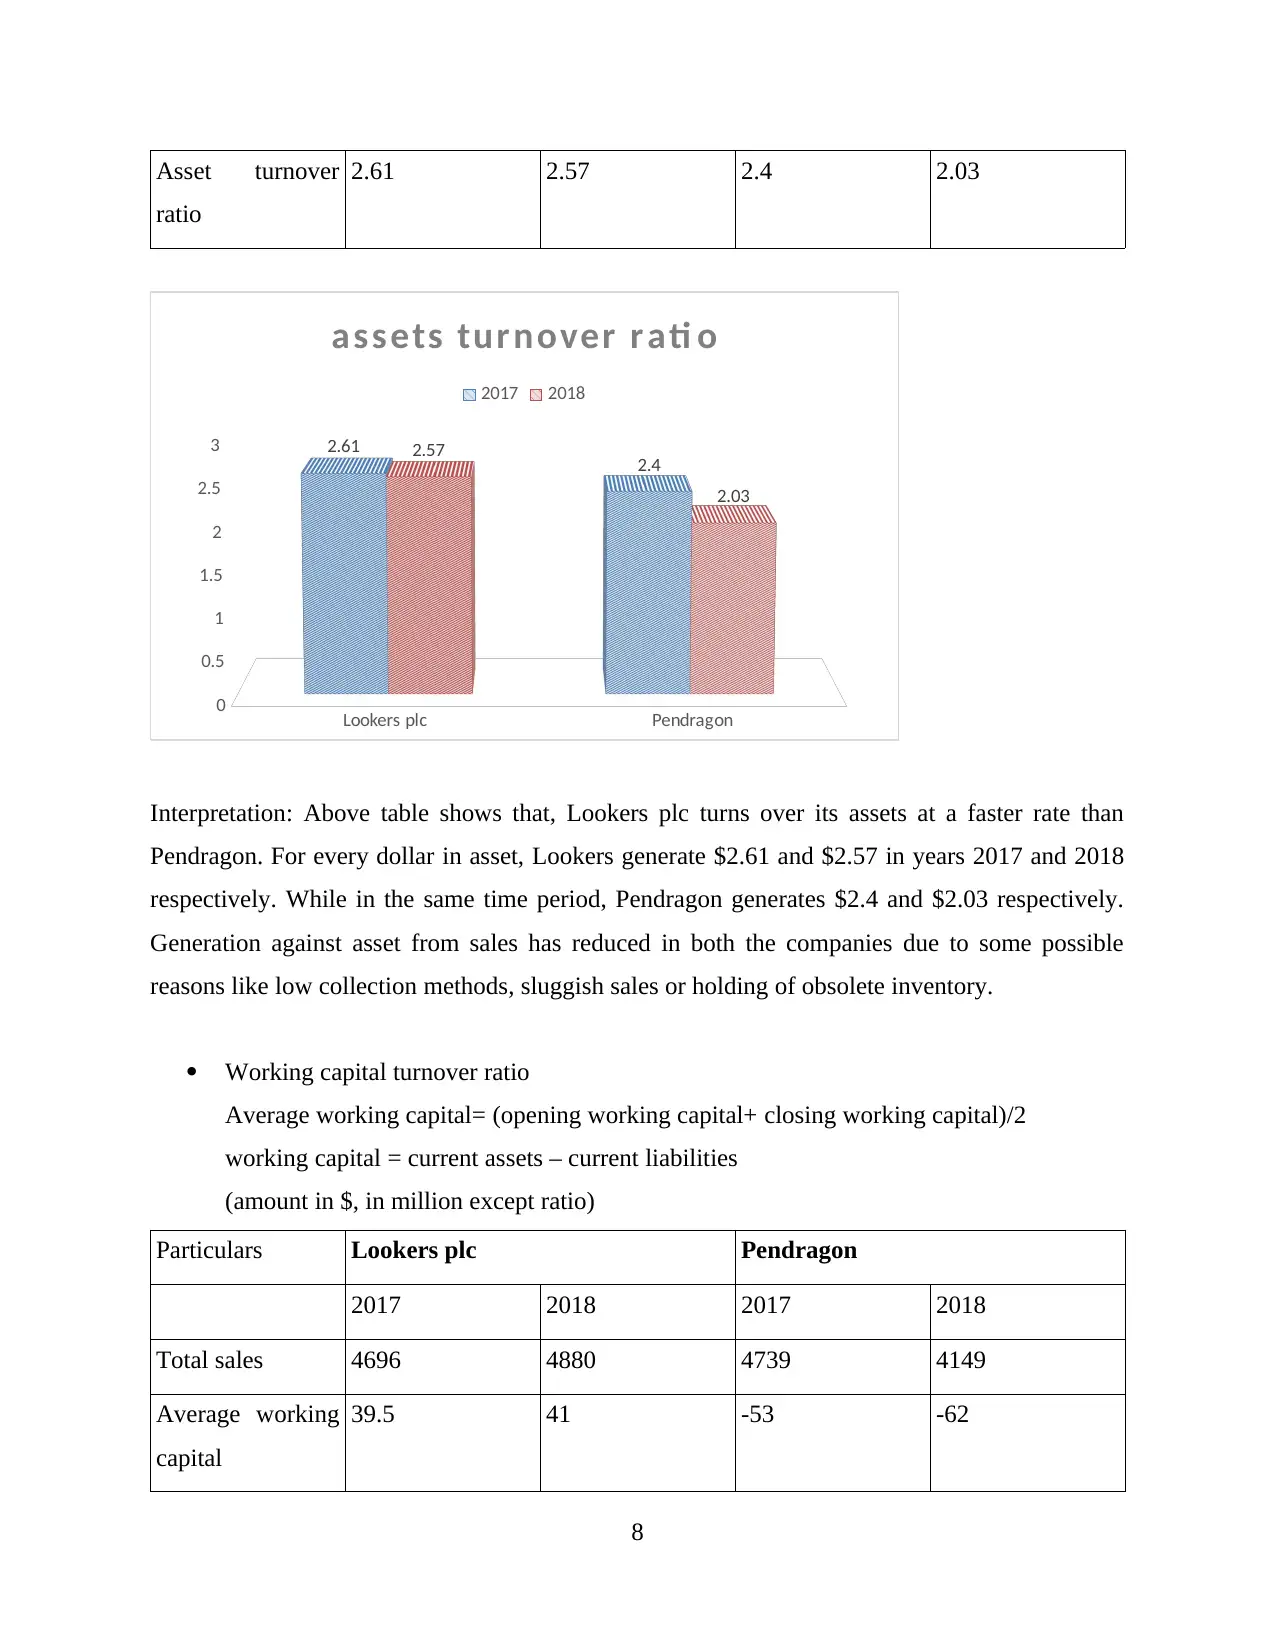
Asset turnover
ratio
2.61 2.57 2.4 2.03
Lookers plc Pendragon
0
0.5
1
1.5
2
2.5
3 2.61 2.4
2.57
2.03
assets turnover rati o
2017 2018
Interpretation: Above table shows that, Lookers plc turns over its assets at a faster rate than
Pendragon. For every dollar in asset, Lookers generate $2.61 and $2.57 in years 2017 and 2018
respectively. While in the same time period, Pendragon generates $2.4 and $2.03 respectively.
Generation against asset from sales has reduced in both the companies due to some possible
reasons like low collection methods, sluggish sales or holding of obsolete inventory.
Working capital turnover ratio
Average working capital= (opening working capital+ closing working capital)/2
working capital = current assets – current liabilities
(amount in $, in million except ratio)
Particulars Lookers plc Pendragon
2017 2018 2017 2018
Total sales 4696 4880 4739 4149
Average working
capital
39.5 41 -53 -62
8
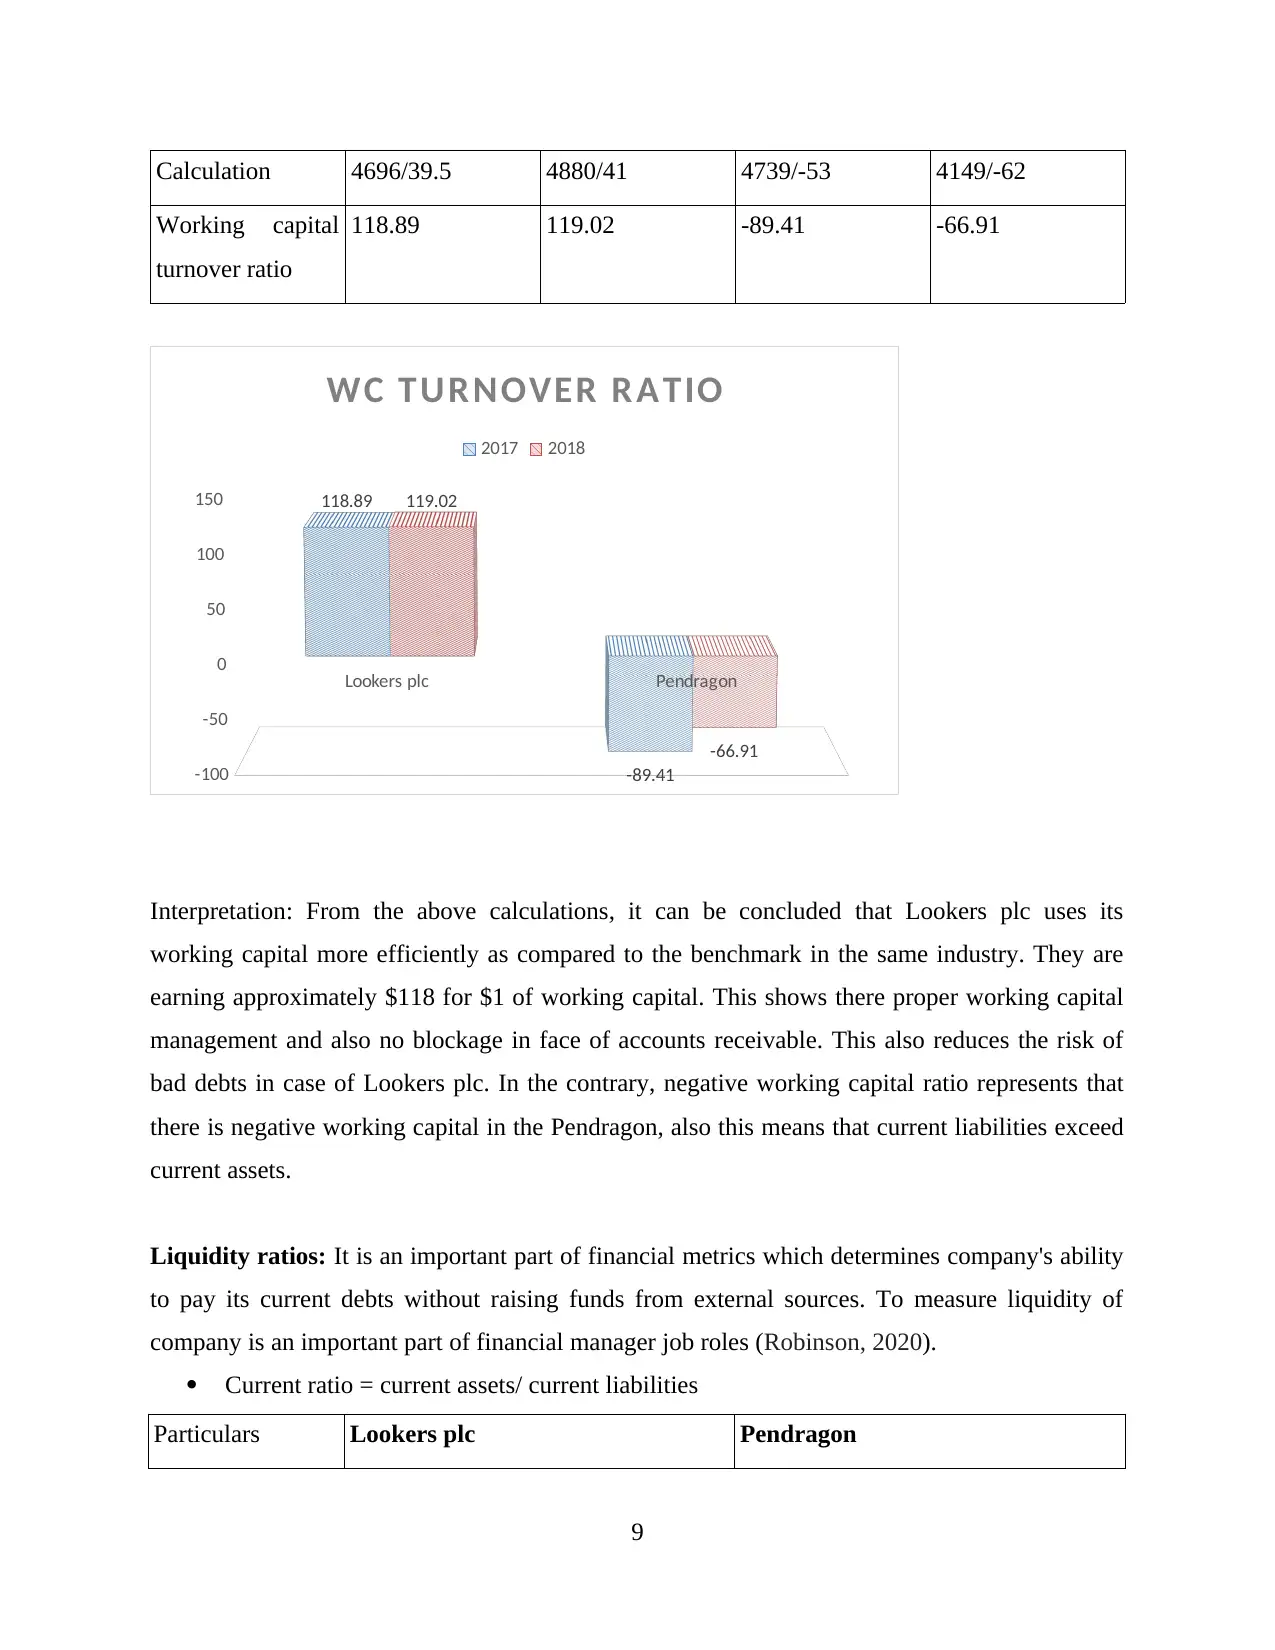
Calculation 4696/39.5 4880/41 4739/-53 4149/-62
Working capital
turnover ratio
118.89 119.02 -89.41 -66.91
Lookers plc Pendragon
-100
-50
0
50
100
150 118.89
-89.41
119.02
-66.91
WC TURNOVER R ATIO
2017 2018
Interpretation: From the above calculations, it can be concluded that Lookers plc uses its
working capital more efficiently as compared to the benchmark in the same industry. They are
earning approximately $118 for $1 of working capital. This shows there proper working capital
management and also no blockage in face of accounts receivable. This also reduces the risk of
bad debts in case of Lookers plc. In the contrary, negative working capital ratio represents that
there is negative working capital in the Pendragon, also this means that current liabilities exceed
current assets.
Liquidity ratios: It is an important part of financial metrics which determines company's ability
to pay its current debts without raising funds from external sources. To measure liquidity of
company is an important part of financial manager job roles (Robinson, 2020).
Current ratio = current assets/ current liabilities
Particulars Lookers plc Pendragon
9
⊘ This is a preview!⊘
Do you want full access?
Subscribe today to unlock all pages.
Trusted by 1+ million students worldwide
2017 2018 2017 2018
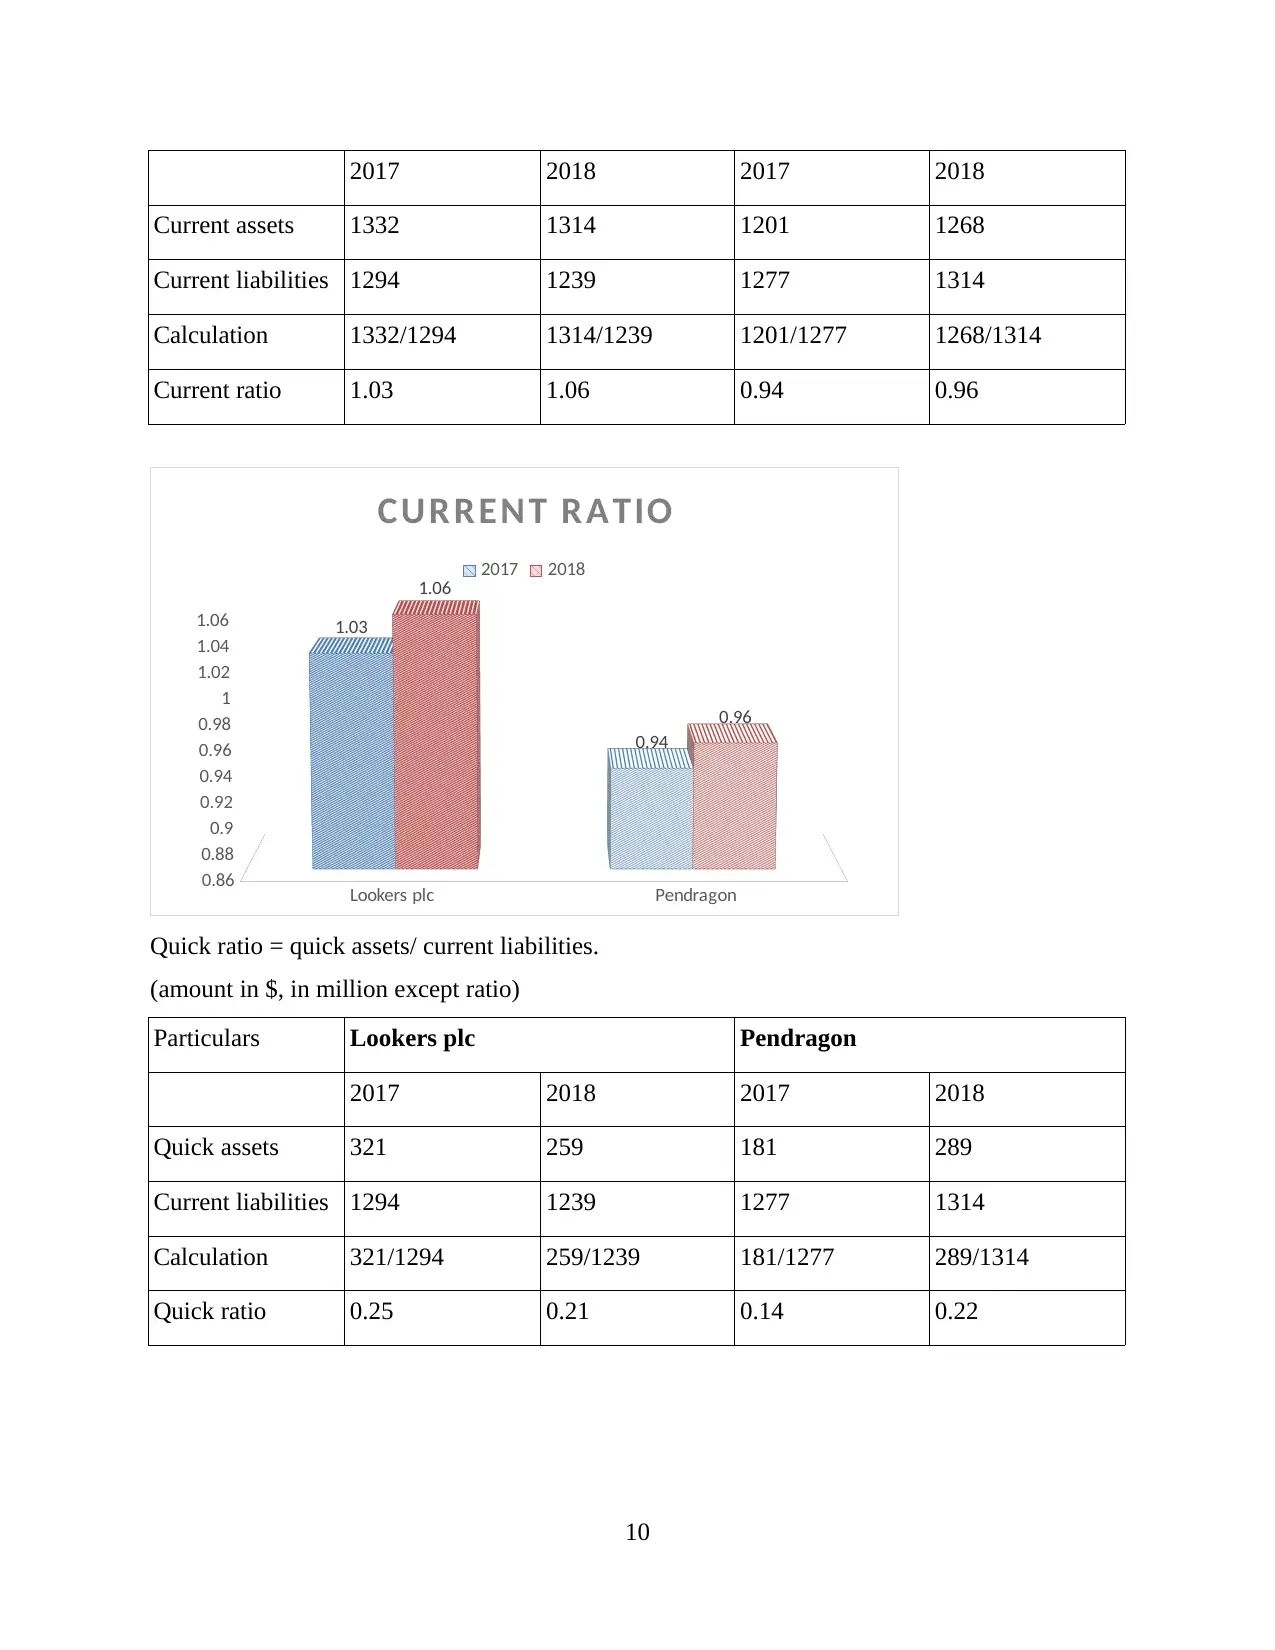
Current assets 1332 1314 1201 1268
Current liabilities 1294 1239 1277 1314
Calculation 1332/1294 1314/1239 1201/1277 1268/1314
Current ratio 1.03 1.06 0.94 0.96
Lookers plc Pendragon
0.86
0.88
0.9
0.92
0.94
0.96
0.98
1
1.02
1.04
1.06 1.03
0.94
1.06
0.96
CUR RENT R ATIO
2017 2018
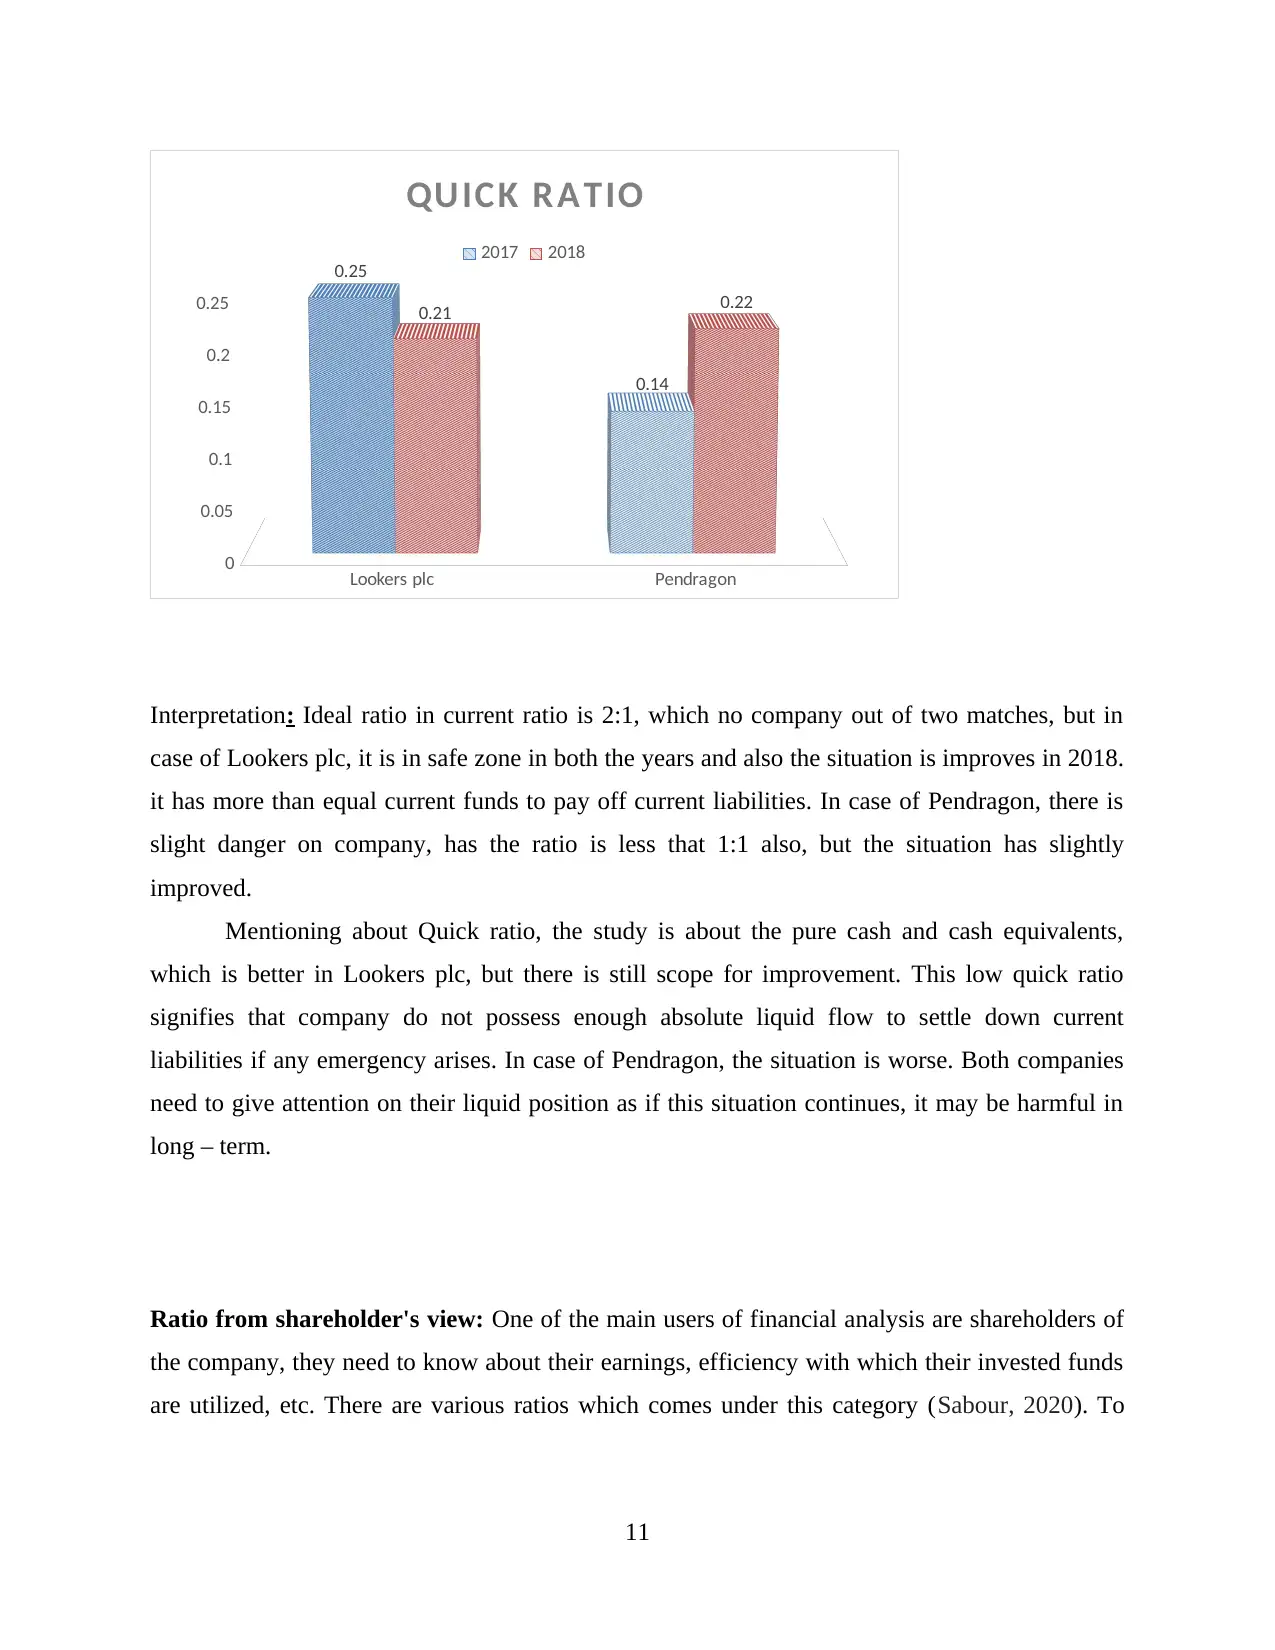
Quick ratio = quick assets/ current liabilities.
(amount in $, in million except ratio)
Particulars Lookers plc Pendragon
2017 2018 2017 2018
Quick assets 321 259 181 289
Current liabilities 1294 1239 1277 1314
Calculation 321/1294 259/1239 181/1277 289/1314
Quick ratio 0.25 0.21 0.14 0.22
10
Current assets 1332 1314 1201 1268
Current liabilities 1294 1239 1277 1314
Calculation 1332/1294 1314/1239 1201/1277 1268/1314
Current ratio 1.03 1.06 0.94 0.96
Lookers plc Pendragon
0.86
0.88
0.9
0.92
0.94
0.96
0.98
1
1.02
1.04
1.06 1.03
0.94
1.06
0.96
CUR RENT R ATIO
2017 2018
Quick ratio = quick assets/ current liabilities.
(amount in $, in million except ratio)
Particulars Lookers plc Pendragon
2017 2018 2017 2018
Quick assets 321 259 181 289
Current liabilities 1294 1239 1277 1314
Calculation 321/1294 259/1239 181/1277 289/1314
Quick ratio 0.25 0.21 0.14 0.22
10
Paraphrase This Document
Need a fresh take? Get an instant paraphrase of this document with our AI Paraphraser
Lookers plc Pendragon
0
0.05
0.1
0.15
0.2
0.25
0.25
0.14
0.21 0.22
QUICK R ATIO
2017 2018
Interpretation: Ideal ratio in current ratio is 2:1, which no company out of two matches, but in
case of Lookers plc, it is in safe zone in both the years and also the situation is improves in 2018.
it has more than equal current funds to pay off current liabilities. In case of Pendragon, there is
slight danger on company, has the ratio is less that 1:1 also, but the situation has slightly
improved.
Mentioning about Quick ratio, the study is about the pure cash and cash equivalents,
which is better in Lookers plc, but there is still scope for improvement. This low quick ratio
signifies that company do not possess enough absolute liquid flow to settle down current
liabilities if any emergency arises. In case of Pendragon, the situation is worse. Both companies
need to give attention on their liquid position as if this situation continues, it may be harmful in
long – term.
Ratio from shareholder's view: One of the main users of financial analysis are shareholders of
the company, they need to know about their earnings, efficiency with which their invested funds
are utilized, etc. There are various ratios which comes under this category (Sabour, 2020). To
11
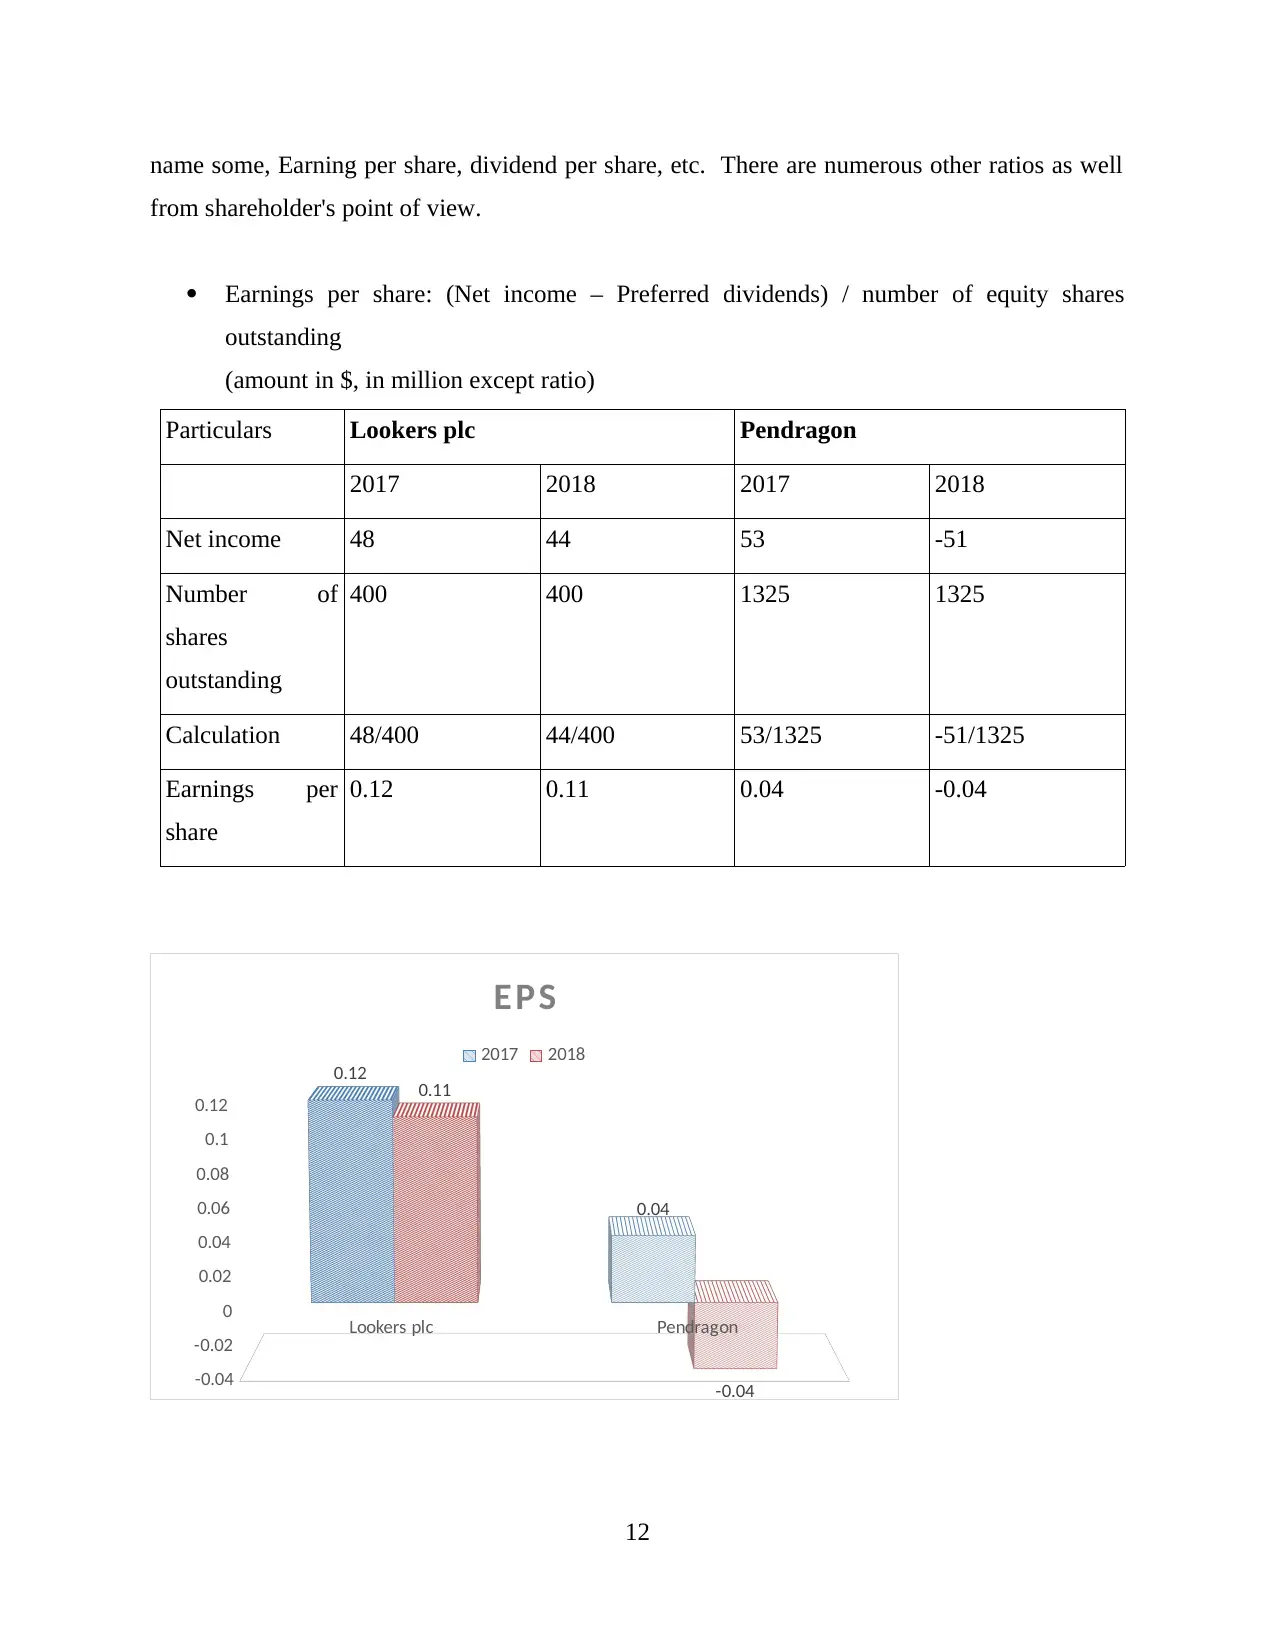
name some, Earning per share, dividend per share, etc. There are numerous other ratios as well
from shareholder's point of view.
Earnings per share: (Net income – Preferred dividends) / number of equity shares
outstanding
(amount in $, in million except ratio)
Particulars Lookers plc Pendragon
2017 2018 2017 2018
Net income 48 44 53 -51
Number of
shares
outstanding
400 400 1325 1325
Calculation 48/400 44/400 53/1325 -51/1325
Earnings per
share
0.12 0.11 0.04 -0.04
Lookers plc Pendragon
-0.04
-0.02
0
0.02
0.04
0.06
0.08
0.1
0.12
0.12
0.04
0.11
-0.04
EPS
2017 2018
12
⊘ This is a preview!⊘
Do you want full access?
Subscribe today to unlock all pages.
Trusted by 1+ million students worldwide
1 out of 14
Related Documents


Your All-in-One AI-Powered Toolkit for Academic Success.
+13062052269
info@desklib.com
Available 24*7 on WhatsApp / Email
![[object Object]](/_next/static/media/star-bottom.7253800d.svg)
Unlock your academic potential
Copyright © 2020–2026 A2Z Services. All Rights Reserved. Developed and managed by ZUCOL.