Implementing Low Carbon Electricity Policies for UK's 2050 Target

Verified

Added on  2020/07/23

|10
|2008
|61
Report
AI Summary
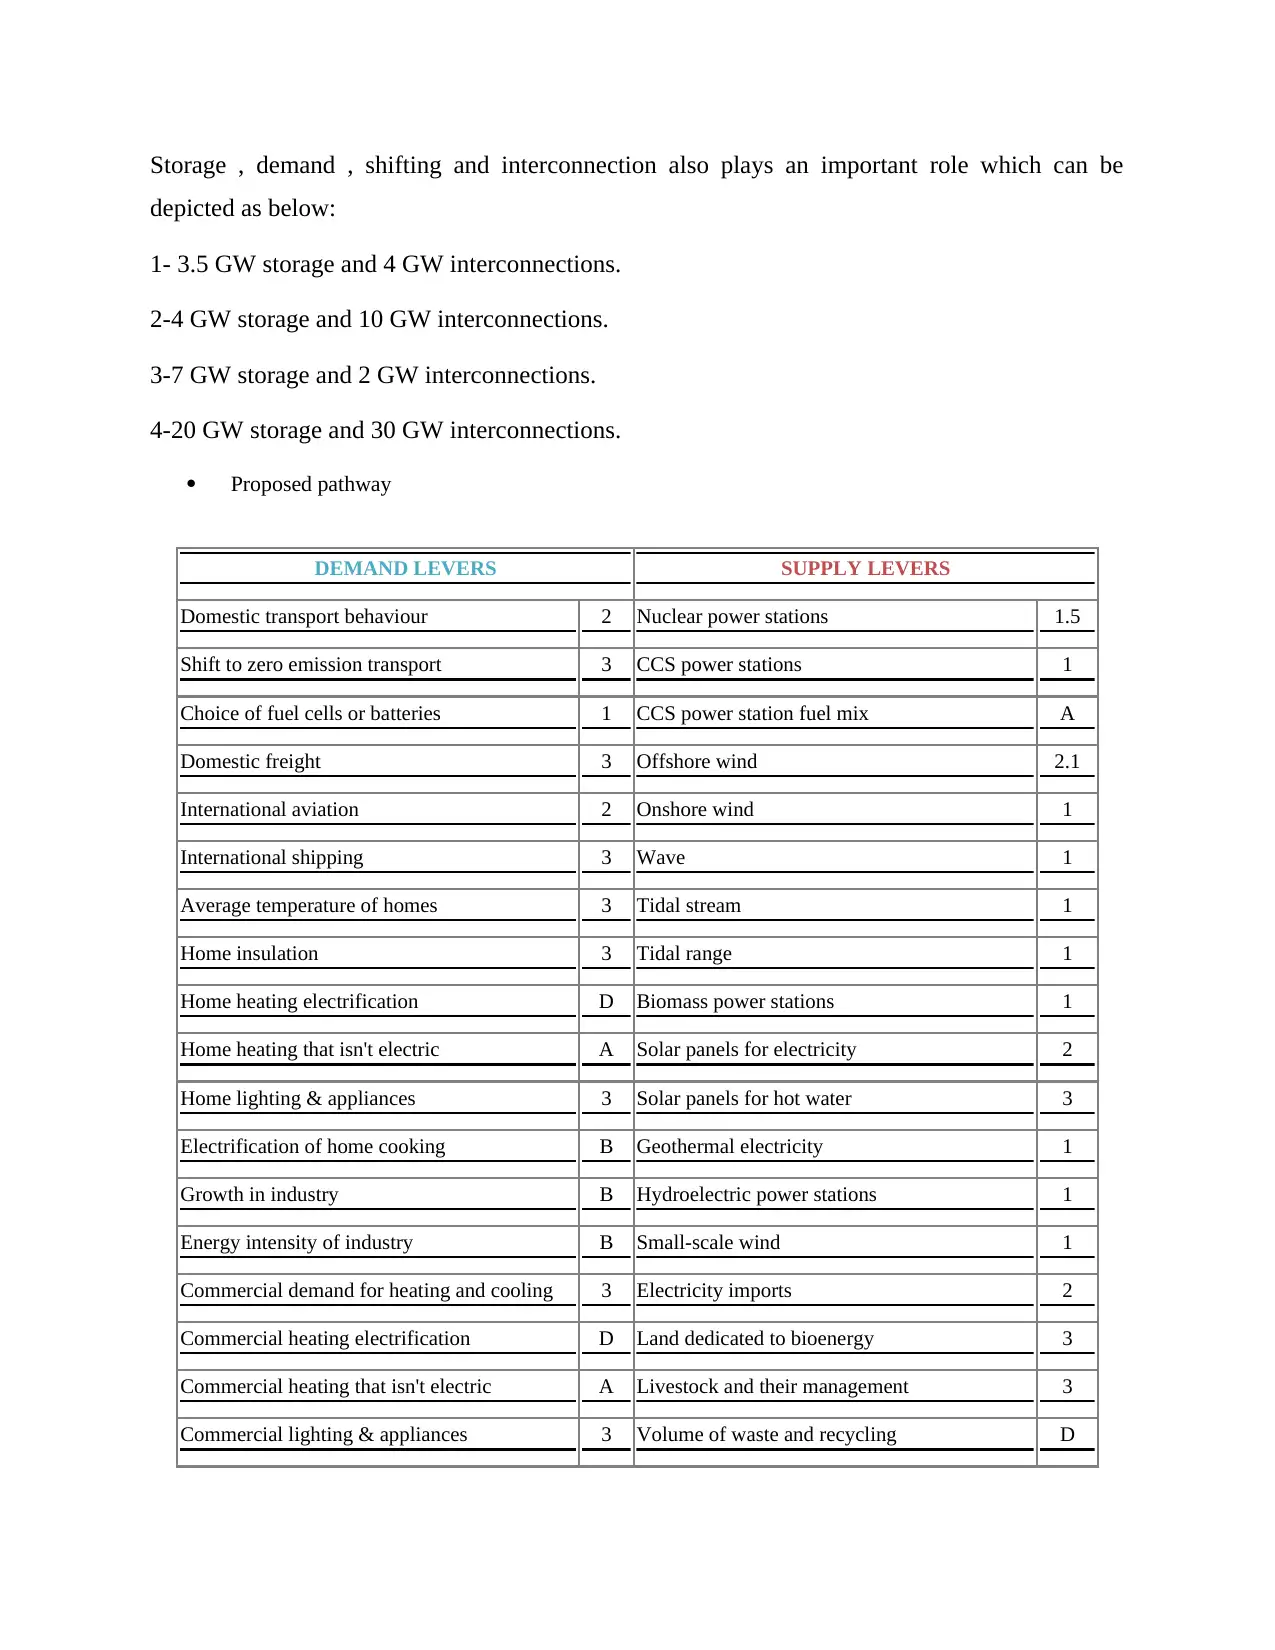
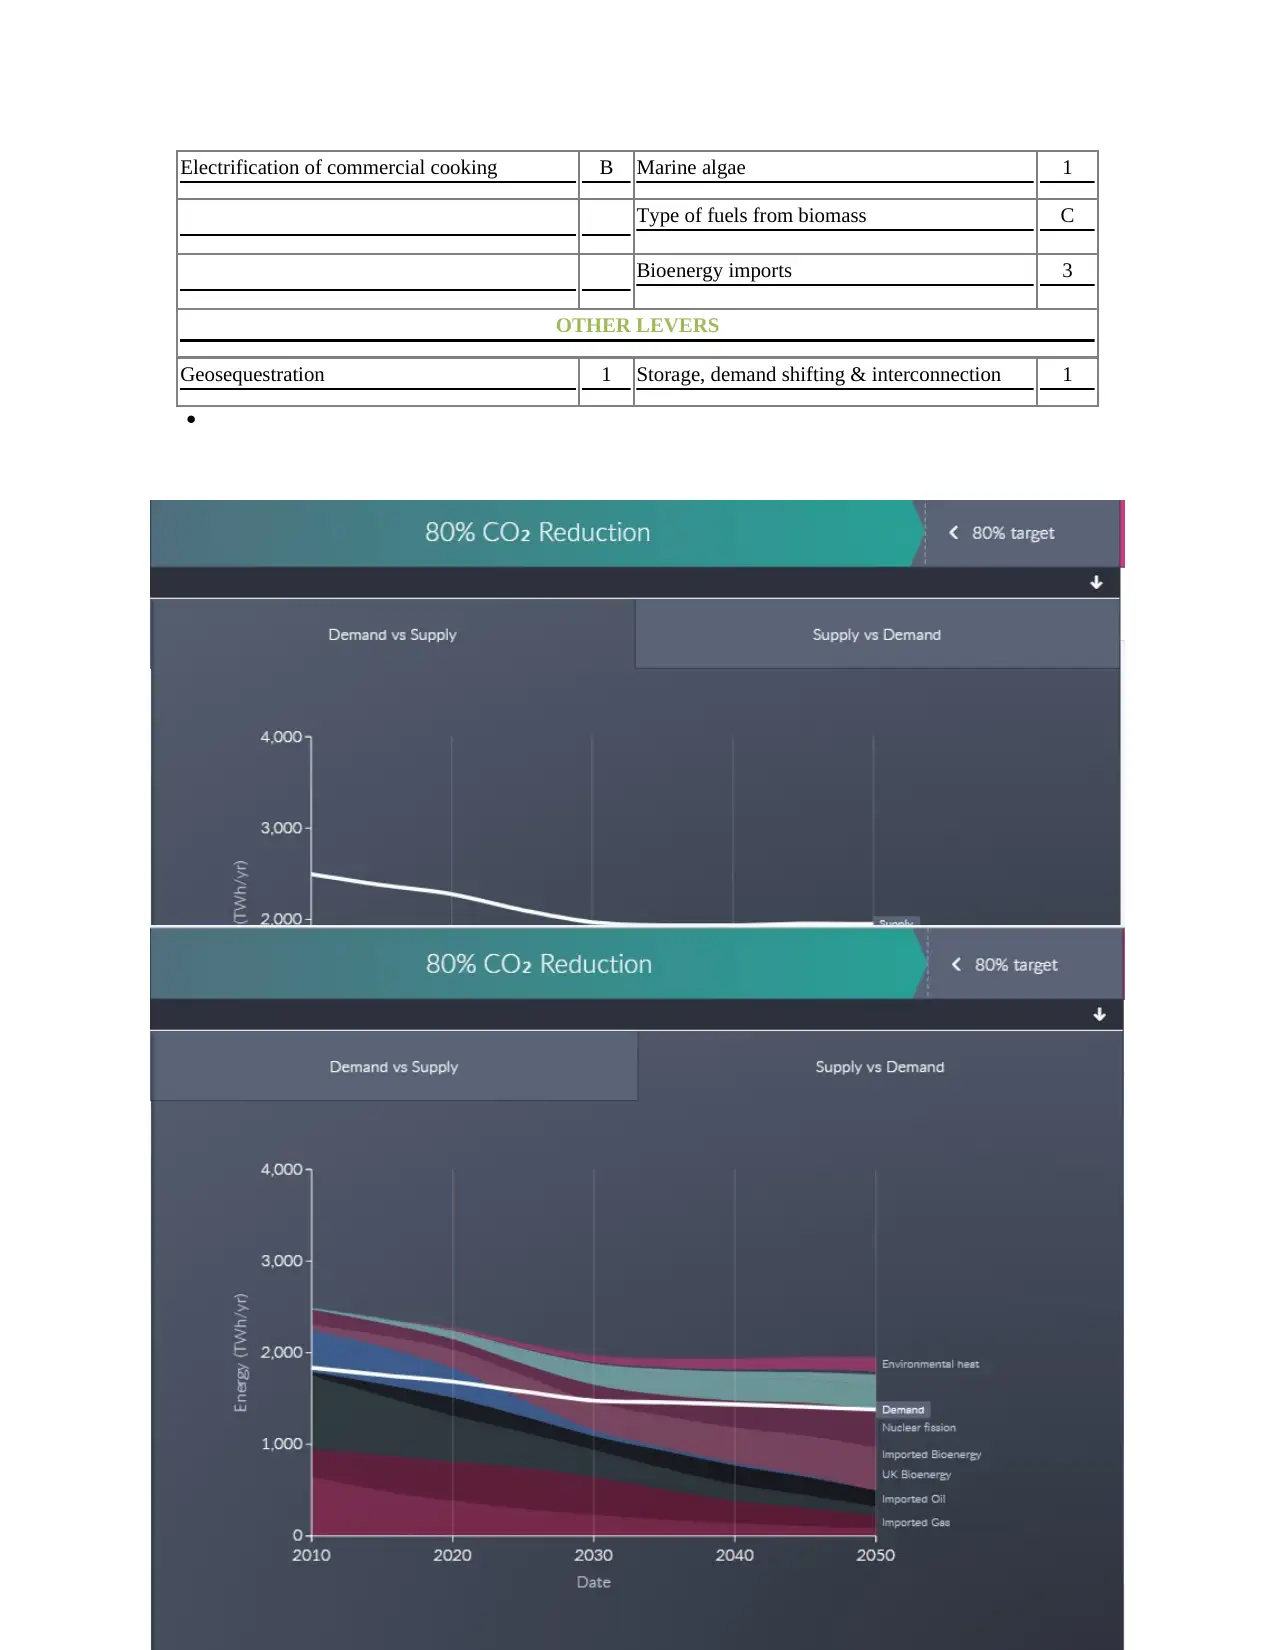
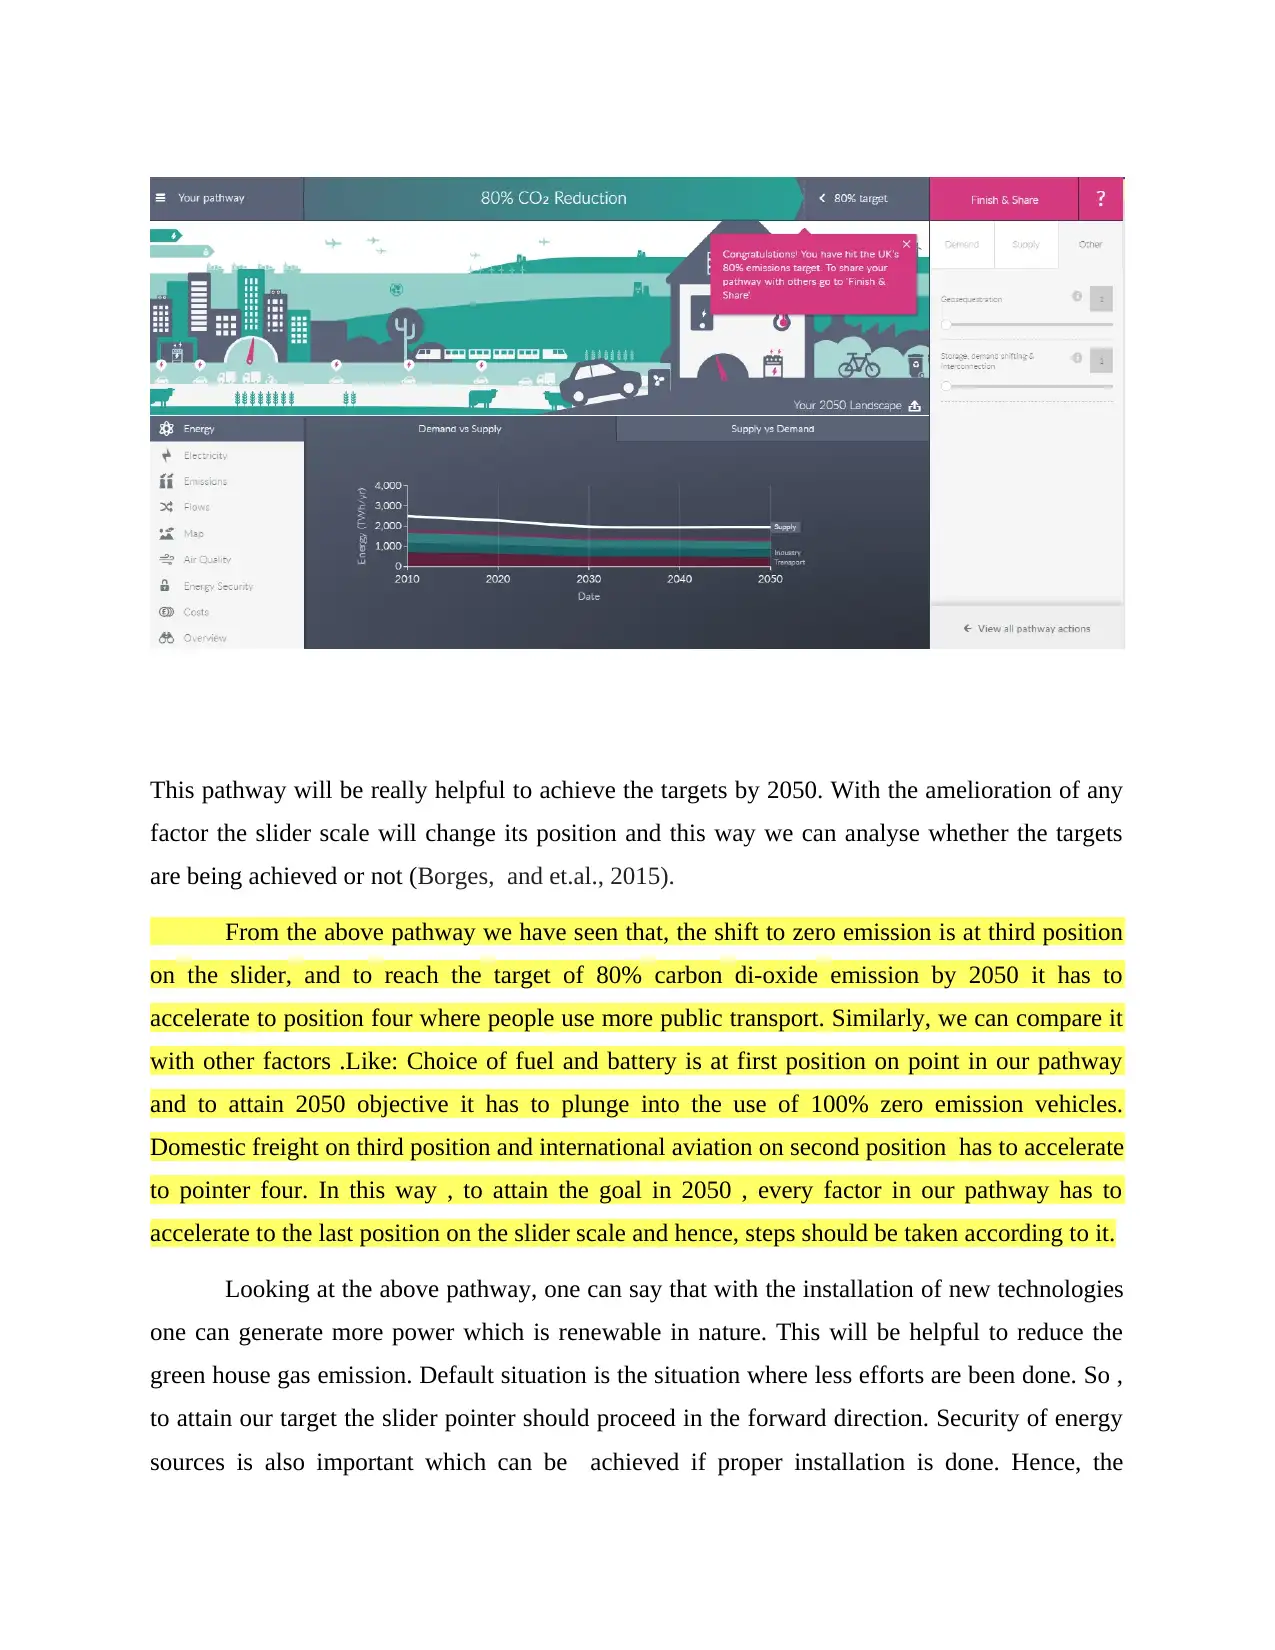
This report analyzes the feasibility of implementing low-carbon electricity policies in the UK to meet the 2050 target for reducing greenhouse gas emissions. It discusses the role of various factors, including demand and supply levers, as defined by the Department of Energy and Climate Change's 2050 energy calculator. The report outlines strategies such as the use of renewable energy sources (wind, solar, hydro, nuclear), carbon capture and storage (CCS), and improvements in energy efficiency across various sectors. The analysis emphasizes the importance of transitioning to zero-emission transport, the adoption of fuel cells and batteries, and the need for advancements in domestic freight and international aviation. The report also highlights the significance of energy security and the role of government policies in achieving the emission reduction goals. The report examines a proposed pathway, detailing specific actions and their potential impacts, offering insights into how the UK can effectively diminish greenhouse gas emissions by 2050.
Document Page
‘It is possible to implement a
series of low carbon electricity
policies to reduce GHGs in the
UK to achieve our 2050 target.
tabler-icon-diamond-filled.svg

Paraphrase This Document

Need a fresh take? Get an instant paraphrase of this document with our AI Paraphraser
Document Page
TABLE OF CONTENTS
Document Page
A gas that absorbs and emits radiant energy within the range of infrared rays is called as
green house gas. Water vapour, carbon dioxide,methane,nitrous oxide and ozone are primary
greenhouse gases. Without these the temperature of the earth atmosphere will be very low for the
human beings to survive. But with the advancement of technologies, industrial revolution has
taken place. Due to this ,the emissions of these gases has increased to a considerable extent.
Human activities such as, combustion of fossil fuel like coal,oil and natural gas covers majority
of these emissions (Ranson, and et.al., 2016). It is observed that the continuous emission at the
same rate will lead to severe damages to the ecosystem and bio-diversity and hence, immediate
steps has to be taken to curb the same.
For this the government is taking various initiatives. People can use various other sources
to reduce the emission of gases. Some of these are as below:
Use of hybrid cars which runs with electricity .
By implementing the policy of reduce,recycle and reuse.
By planting more trees.
Using more renewable sources of energy.
More use of compact fluorescent light bulbs.
Use of non-toxic households.
Along with all these, the implementation of low-carbon electricity is of utmost importance to
combat the present scenario. This can be done with the help of low carbon power generating
sources such as wind power ,solar power, hydro power ,nuclear power, etc. To proceed with the
same , the Department of Energy and Climate change has introduced 2050 energy calculator to
have an analysis of the pathway to achieve the target by 2050.The UK is committed to decrease
the same by 80 percent. This calculators helps to create own pathway for the country. One can
consider the choices according to the country economy (Lamb, and et.al., 2016). This is based on
ideas gathered with the help of both organisations and the government. The main aim behind the
calculator installation is to build a pathway for UK that will reduce the carbon emission in the
country by 80%.The movement of slider will show whether the targets are achieves or not.
Document Page
The 2050 pathway is taken into account to elaborate the same. Each sector of energy
system is represented by the slider. Level of demand ,supply and others can be adjusted by
moving the slider to cut the emissions (Green, and et.al., 2015). Number 1 on slider represents
the scenario of minimum efforts and number 4 shows the scenario which will be technically
feasible. The alphabets on the calculator , that is, A to D, describes scenario. The segregation of
demand factor on slider scale is represented as below:
FACTOR A: use of zero emission transport
1- Individual travel increases by 9% by 2050
2-Individual travel increases by 7% and cars and vans are 80% of passenger mileage in 2050
3-Individual travel increases by 7% and cars and vans are 74% of passenger mileage in 2050
4-Individuals travel the same distance by 2050 using public transport.
FACTOR B: use of fuel cells or batteries
1- 20% will use hybrid cars and 2.5% will use zero emission vehicles by 2050.
2-54% will use hybrid cars and 11% will use zero emission vehicles by 2050.
3-32% will use hybrid cars and 48% will use zero emission vehicles along with 22% electric
buses by 2050.
4-100% use of zero emission vehicles.
FACTOR C: Domestic freight
1- All zero emission cars will use battery.
2- 80% of the zero emission cars will use the battery and rest 20% will use fuel cells.
3-20% of the zero emission cars will use the battery and rest 80% will use fuel cells.
4-All zero emission cars will use fuel cells.
FACTOR D: International aviation
1- 73% of the distance will be covered by using road and use of diesel rails.
2- Rail and water transport will be used instead of road.
tabler-icon-diamond-filled.svg

Paraphrase This Document

Need a fresh take? Get an instant paraphrase of this document with our AI Paraphraser
Document Page
3-Other more efficient energy resources will be used.
4-Electric rails will be use along with the use of less road transport measures.
Similarly,the segregation of supply factor on slider scale is represented as below:
FACTOR A: Use of nuclear power
1-No new installation of nuclear power plant
2-13 3 GW stations producing 280 TWh/yr
3-30 3 GW stations producing 630 TWh/yr
4-50 3 GW stations producing 1030 TWh/yr
FACTOR B: Use of CCS(carbon capture and storage) power
1-only plants for demonstration
2-25-40 stations producing 240 Twh/yr
3-35-60 stations producing 340 Twh/yr
4-50-90 stations producing 510 Twh/yr
FACTOR C: fuel mix CCS power station
1-100% use of coal/ biomass and 0% biogas/CCS
2-66% use of coal/ biomass and 33% biogas/CCS
3-33% use of coal/ biomass and 66% biogas/CCS
4-0% use of coal/ biomass and 100% biogas/CCS
FACTOR D: Offshore wind is represented using alphabets A to D to represent the improvement.
Other factors include Geo-sequestration, which can be demonstrated as:
1-there is no implementation.
2-carbon dioxide sequestration rate of 1 million tonnes per annum by 2050
3-carbon dioxide sequestration rate of 30 million tonnes per annum by 2050
4-carbon dioxide sequestration rate of 110 million tonnes per annum by 2050
Document Page
Storage , demand , shifting and interconnection also plays an important role which can be
depicted as below:
1- 3.5 GW storage and 4 GW interconnections.
2-4 GW storage and 10 GW interconnections.
3-7 GW storage and 2 GW interconnections.
4-20 GW storage and 30 GW interconnections.
Proposed pathway
DEMAND LEVERS SUPPLY LEVERS
Domestic transport behaviour 2 Nuclear power stations 1.5
Shift to zero emission transport 3 CCS power stations 1
Choice of fuel cells or batteries 1 CCS power station fuel mix A
Domestic freight 3 Offshore wind 2.1
International aviation 2 Onshore wind 1
International shipping 3 Wave 1
Average temperature of homes 3 Tidal stream 1
Home insulation 3 Tidal range 1
Home heating electrification D Biomass power stations 1
Home heating that isn't electric A Solar panels for electricity 2
Home lighting & appliances 3 Solar panels for hot water 3
Electrification of home cooking B Geothermal electricity 1
Growth in industry B Hydroelectric power stations 1
Energy intensity of industry B Small-scale wind 1
Commercial demand for heating and cooling 3 Electricity imports 2
Commercial heating electrification D Land dedicated to bioenergy 3
Commercial heating that isn't electric A Livestock and their management 3
Commercial lighting & appliances 3 Volume of waste and recycling D
Document Page
Electrification of commercial cooking B Marine algae 1
Type of fuels from biomass C
Bioenergy imports 3
OTHER LEVERS
Geosequestration 1 Storage, demand shifting & interconnection 1
tabler-icon-diamond-filled.svg

Paraphrase This Document

Need a fresh take? Get an instant paraphrase of this document with our AI Paraphraser
Document Page
This pathway will be really helpful to achieve the targets by 2050. With the amelioration of any
factor the slider scale will change its position and this way we can analyse whether the targets
are being achieved or not (Borges, and et.al., 2015).
From the above pathway we have seen that, the shift to zero emission is at third position
on the slider, and to reach the target of 80% carbon di-oxide emission by 2050 it has to
accelerate to position four where people use more public transport. Similarly, we can compare it
with other factors .Like: Choice of fuel and battery is at first position on point in our pathway
and to attain 2050 objective it has to plunge into the use of 100% zero emission vehicles.
Domestic freight on third position and international aviation on second position has to accelerate
to pointer four. In this way , to attain the goal in 2050 , every factor in our pathway has to
accelerate to the last position on the slider scale and hence, steps should be taken according to it.
Looking at the above pathway, one can say that with the installation of new technologies
one can generate more power which is renewable in nature. This will be helpful to reduce the
green house gas emission. Default situation is the situation where less efforts are been done. So ,
to attain our target the slider pointer should proceed in the forward direction. Security of energy
sources is also important which can be achieved if proper installation is done. Hence, the
Document Page
consumption of the resources should be done according to its availability. It is essential for the
economy of any country. The scenario which has been proposed is feasible , that is, affordable to
establish as UK has very powerful sources to to meet natural gases and nuclear power.
Energy security is again an import factor. For this installation of plant should be done in
the best way so as to secure the energy resources by having passwords at doors of installation.
The scenario which is being represented in the table above can be recommended to the policy
makers to diminish the green house gaseous emission by 2050.
The sources of energy must be affordable to the general people so as to reduce the resistance
given by them if the prices are high. Use of electric hybrid cars with less cost can serve the
purpose. By introducing the things , which the general population can easily avail will help to
reach the goal.
Nothing is impossible in this world. Work must be done in such a way so as to lead the
slider to point 4 on the scale which is the most feasible scenario (Linquist, and et.al., 2015).
More investment will be required in the initial stages but once it will be done, the approach will
become more easy. In this way by installing all the demand ,supply and other factors the target to
reduce greenhouse gas emission by 2050 will be achieved.
REFERENCES
Lamb, A., and et.al., 2016. The potential for land sparing to offset greenhouse gas emissions
from agriculture. Nature Climate Change .6(5). p.488.
Green, R., and et.al., 2015. The potential to reduce greenhouse gas emissions in the UK through
healthy and realistic dietary change. Climatic Change.129(1-2). pp.253-265.
Borges, A.V., and et.al., 2015. Globally significant greenhouse-gas emissions from African
inland waters. Nature Geoscience. 8(8). p.637.
Linquist, B.A., and et.al., 2015. Reducing greenhouse gas emissions, water use, and grain arsenic
levels in rice systems. Global change biology. 21(1). pp.407-417.
Document Page
Ranson, M. and et.al., 2016. Linkage of greenhouse gas emissions trading systems: Learning
from experience. Climate Policy. 16(3). pp.284-300.
chevron_up_icon
1 out of 10
circle_padding
hide_on_mobile
zoom_out_icon
[object Object]