Improving Energy Efficiency in Biscuit Manufacturing Processes
VerifiedAdded on 2023/04/23
|15
|2994
|443
Report
AI Summary
This report investigates energy consumption in the manufacturing of biscuits, a process that consumes approximately 8MJ of energy per kilogram of product, with baking accounting for the highest energy expenditure. The study analyzes the energy-intensive processes involved, including mixing, fermentation, molding/shaping, baking, and cooling, and utilizes a Sankey diagram to visualize energy flows and losses. It identifies that 40% of the energy is lost, emphasizing the need for efficiency improvements. The report assesses the suitability of renewable energy technologies, particularly biomass, solar energy, wind energy, geothermal, and hydropower, to reduce energy costs and environmental impacts. It concludes that biomass is the most suitable renewable energy source and recommends further cost-benefit analyses and feasibility studies to determine the optimal renewable energy solution for biscuit production, alongside other energy-saving techniques such as heat recovery systems and automated energy management.

Low Impact Manufacturing 1
LOW IMPACT MANUFACTURING
Name
Course
Professor
University
City/state
Date
LOW IMPACT MANUFACTURING
Name
Course
Professor
University
City/state
Date
Paraphrase This Document
Need a fresh take? Get an instant paraphrase of this document with our AI Paraphraser
Low Impact Manufacturing 2
Abstract
The main purpose of this report is to investigate energy consumption in various
manufacturing processes of biscuits with an aim of identifying strategies to improve energy
efficiency, reduce energy costs and determine suitability of renewable energy technologies. The
main manufacturing processes of biscuits: mixing, fermentation, moulding/shaping, baking and
cooling consume about 8MJ to produce 1kg of biscuits. Baking accounts for the highest energy
expenditure (70%). Out of the 8MJ of energy, 40% (3.2MJ) is lost. Renewable energy
technologies are suitable options that can significantly reduce energy costs and environmental
impacts of biscuit production. The most suitable renewable energy technology is biomass, which
can adequately provide the thermal energy needed in all the manufacturing processes. Other
renewable energy technologies for consideration are solar energy systems, wind energy systems,
geothermal power systems and hydropower systems. It is upon the company to carry out cost-
benefit analysis and feasibility studies of these technologies so as to determine the most suitable
option.
Low Impact Manufacturing 3
Table of Contents
Abstract......................................................................................................................................................2
1. Introduction.......................................................................................................................................4
2. Energy-Intensive Processes...............................................................................................................4
2.1. Mixing.........................................................................................................................................5
2.2. Fermentation..............................................................................................................................5
2.3. Moulding/shaping......................................................................................................................5
2.4. Baking.........................................................................................................................................5
2.5. Cooling........................................................................................................................................6
2.6. Energy Measurement................................................................................................................6
2.6.1. Manual calculations............................................................................................................6
2.6.2. Metering devices..................................................................................................................6
2.6.3. Power sensors......................................................................................................................6
2.6.4. Power predictive models......................................................................................................6
3. Sankey Diagram.................................................................................................................................7
4. Suitability of Renewable Energy......................................................................................................9
4.1. Biomass.....................................................................................................................................10
4.2. Solar energy.............................................................................................................................10
4.3. Other renewable technologies.................................................................................................10
4.4. Other Ways of Reducing Organization’s Energy Cost.........................................................10
5. Conclusion........................................................................................................................................11
References................................................................................................................................................12
Appendices...............................................................................................................................................13
⊘ This is a preview!⊘
Do you want full access?
Subscribe today to unlock all pages.
Trusted by 1+ million students worldwide
Low Impact Manufacturing 4
1. Introduction
Biscuits are among the most popular and liked snacks consumed by people of all age
groups worldwide. Global biscuits market is estimated to attain a compounded annual growth
rate (CAGR) of 5% between 2019 and 2023 (Mordor Intlligence, 2018). The increase in global
demand for biscuits is expected to increase environmental impacts associated with
manufacturing of these products. This is a major concern for manufacturers because they are
supposed to participate in efforts being made to mitigate climate change.
Biscuits production is a comparatively high energy demand activity because the process
of baking requires high quality of electricity and heat (Noya, et al., 2018). Operation of ovens
account for about 50-80% of the total thermal energy used. The main focus of this report is on
the analysis of energy used in the actual manufacturing processes of biscuits. This will help in
identifying areas where energy efficiency can be improved and also determine the suitability of
utilization of renewable energy in the manufacturing processes of biscuits.
2. Energy-Intensive Processes
Biscuit production involves numerous processes starting from production and collection of
raw materials (ingredients) to distribution of packaged biscuits to end consumers (Davidson,
2018). Manufacturing processes account for the greatest primary energy demand and global
warming potential. This report focuses on five major processes that consume most of the energy
during the actual manufacturing stage of biscuits. These processes are presented in Appendix 1
and described below.
Paraphrase This Document
Need a fresh take? Get an instant paraphrase of this document with our AI Paraphraser
Low Impact Manufacturing 5
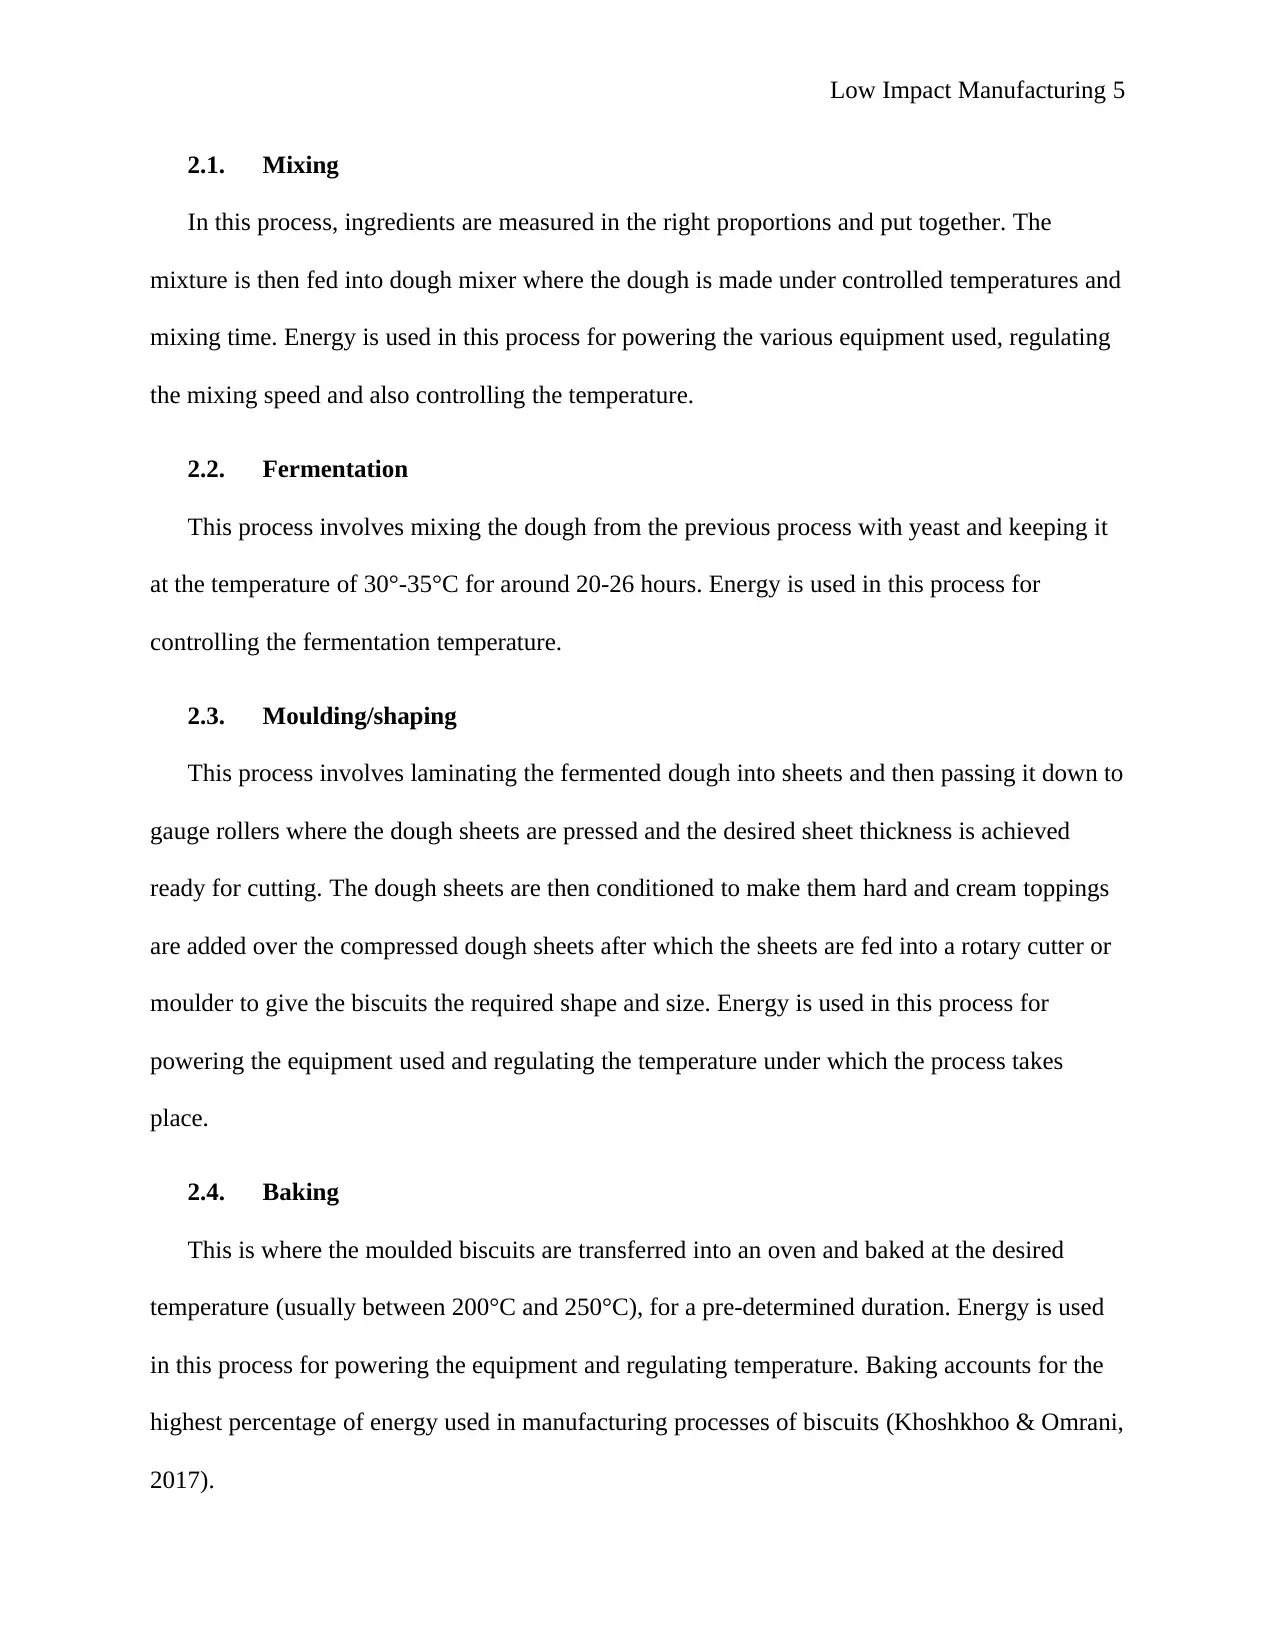
2.1. Mixing
In this process, ingredients are measured in the right proportions and put together. The
mixture is then fed into dough mixer where the dough is made under controlled temperatures and
mixing time. Energy is used in this process for powering the various equipment used, regulating
the mixing speed and also controlling the temperature.
2.2. Fermentation
This process involves mixing the dough from the previous process with yeast and keeping it
at the temperature of 30°-35°C for around 20-26 hours. Energy is used in this process for
controlling the fermentation temperature.
2.3. Moulding/shaping
This process involves laminating the fermented dough into sheets and then passing it down to
gauge rollers where the dough sheets are pressed and the desired sheet thickness is achieved
ready for cutting. The dough sheets are then conditioned to make them hard and cream toppings
are added over the compressed dough sheets after which the sheets are fed into a rotary cutter or
moulder to give the biscuits the required shape and size. Energy is used in this process for
powering the equipment used and regulating the temperature under which the process takes
place.
2.4. Baking
This is where the moulded biscuits are transferred into an oven and baked at the desired
temperature (usually between 200°C and 250°C), for a pre-determined duration. Energy is used
in this process for powering the equipment and regulating temperature. Baking accounts for the
highest percentage of energy used in manufacturing processes of biscuits (Khoshkhoo & Omrani,
2017).
Low Impact Manufacturing 6
2.5. Cooling
This process involves passing the baked biscuits to the cooling conveyors where they either
cool naturally or artificially. Energy is used in this process for powering equipment used and
regulating the temperature.
2.6. Energy Measurement
One of the steps towards improving sustainability of production plants is to measure energy
used in each of the manufacturing processes (Mani, et al., 2014). Some of the methods that can
be used to quantity the amount of energy used by each of the manufacturing processes of biscuits
include the following:
2.6.1. Manual calculations
This method involves finding the sum of the product of power rating (wattage), operating
time and power operating efficiency of each electrical equipment used in each process.
2.6.2. Metering devices
This involves using a metering device to measure the amount of energy consumed by an
electrical device over a certain period of time. The metering devices include: wireless local
energy meter (Wi-LEM), force measurement systems, and one or three-phase power meters.
2.6.3. Power sensors
This involves installing power sensors on each electrical equipment used in the process to
measure energy used.
2.6.4. Power predictive models
This involves developing appropriate predictive models and using them to estimate energy
consumption of every electrical equipment used in each process.
⊘ This is a preview!⊘
Do you want full access?
Subscribe today to unlock all pages.
Trusted by 1+ million students worldwide
Low Impact Manufacturing 7
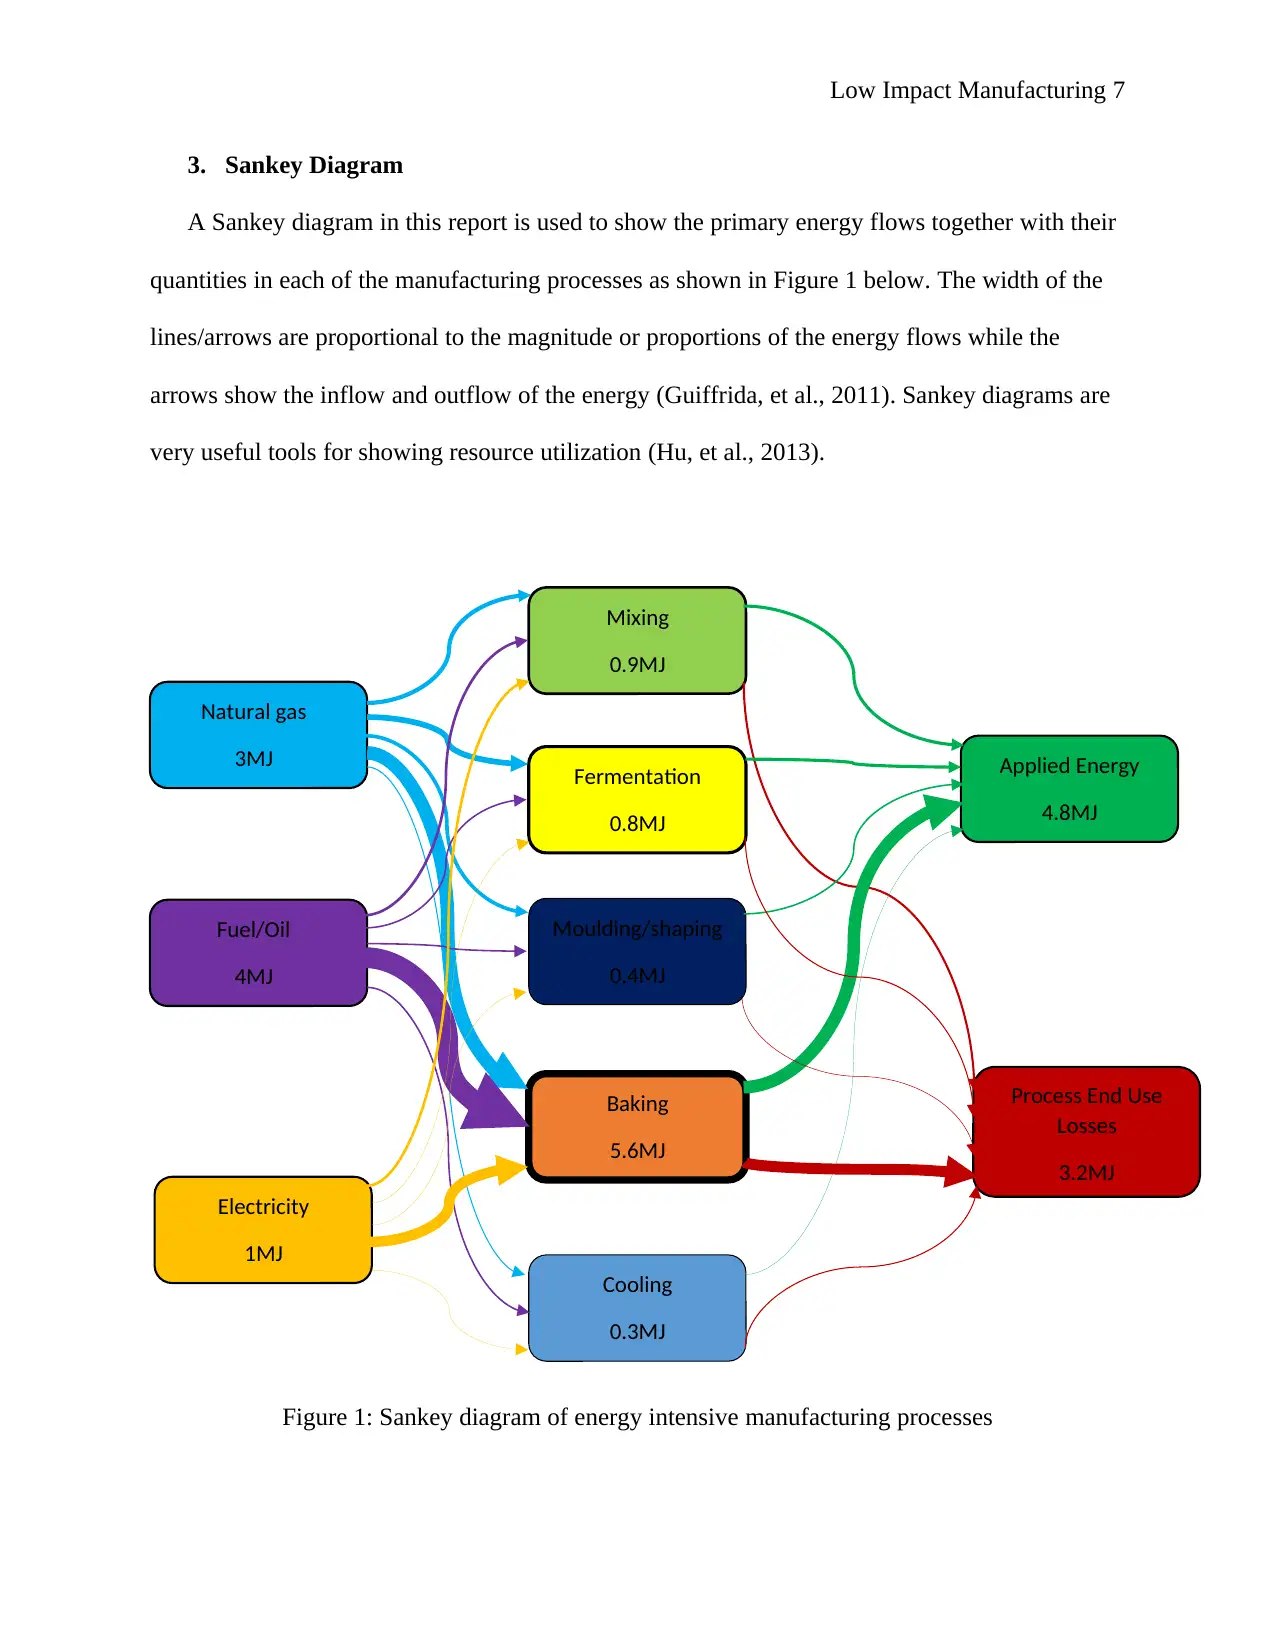
3. Sankey Diagram
A Sankey diagram in this report is used to show the primary energy flows together with their
quantities in each of the manufacturing processes as shown in Figure 1 below. The width of the
lines/arrows are proportional to the magnitude or proportions of the energy flows while the
arrows show the inflow and outflow of the energy (Guiffrida, et al., 2011). Sankey diagrams are
very useful tools for showing resource utilization (Hu, et al., 2013).
Figure 1: Sankey diagram of energy intensive manufacturing processes
Mixing
0.9MJ
Fermentation
0.8MJ
Moulding/shaping
0.4MJ
Baking
5.6MJ
Cooling
0.3MJ
Applied Energy
4.8MJ
Process End Use
Losses
3.2MJ
Natural gas
3MJ
Fuel/Oil
4MJ
Electricity
1MJ
Paraphrase This Document
Need a fresh take? Get an instant paraphrase of this document with our AI Paraphraser
Low Impact Manufacturing 8
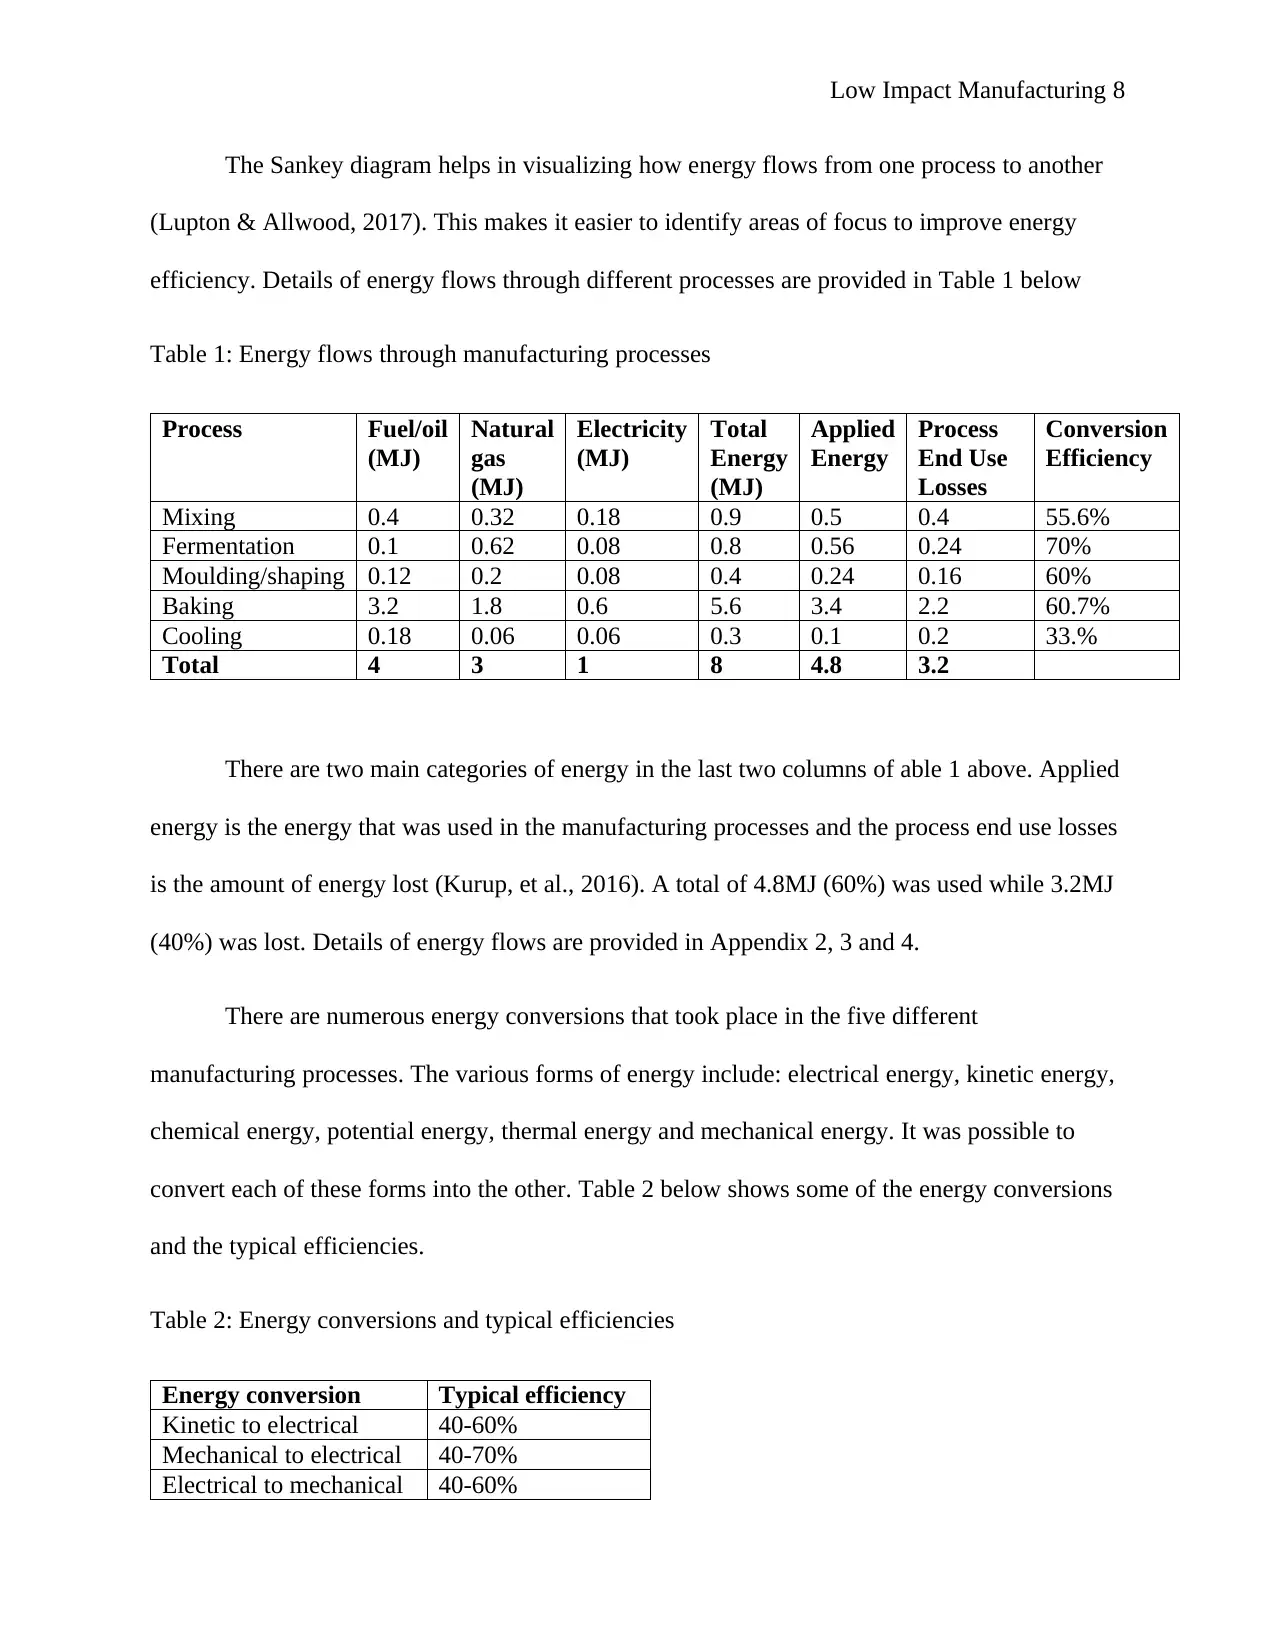
The Sankey diagram helps in visualizing how energy flows from one process to another
(Lupton & Allwood, 2017). This makes it easier to identify areas of focus to improve energy
efficiency. Details of energy flows through different processes are provided in Table 1 below
Table 1: Energy flows through manufacturing processes
Process Fuel/oil
(MJ)
Natural
gas
(MJ)
Electricity
(MJ)
Total
Energy
(MJ)
Applied
Energy
Process
End Use
Losses
Conversion
Efficiency
Mixing 0.4 0.32 0.18 0.9 0.5 0.4 55.6%
Fermentation 0.1 0.62 0.08 0.8 0.56 0.24 70%
Moulding/shaping 0.12 0.2 0.08 0.4 0.24 0.16 60%
Baking 3.2 1.8 0.6 5.6 3.4 2.2 60.7%
Cooling 0.18 0.06 0.06 0.3 0.1 0.2 33.%
Total 4 3 1 8 4.8 3.2
There are two main categories of energy in the last two columns of able 1 above. Applied
energy is the energy that was used in the manufacturing processes and the process end use losses
is the amount of energy lost (Kurup, et al., 2016). A total of 4.8MJ (60%) was used while 3.2MJ
(40%) was lost. Details of energy flows are provided in Appendix 2, 3 and 4.
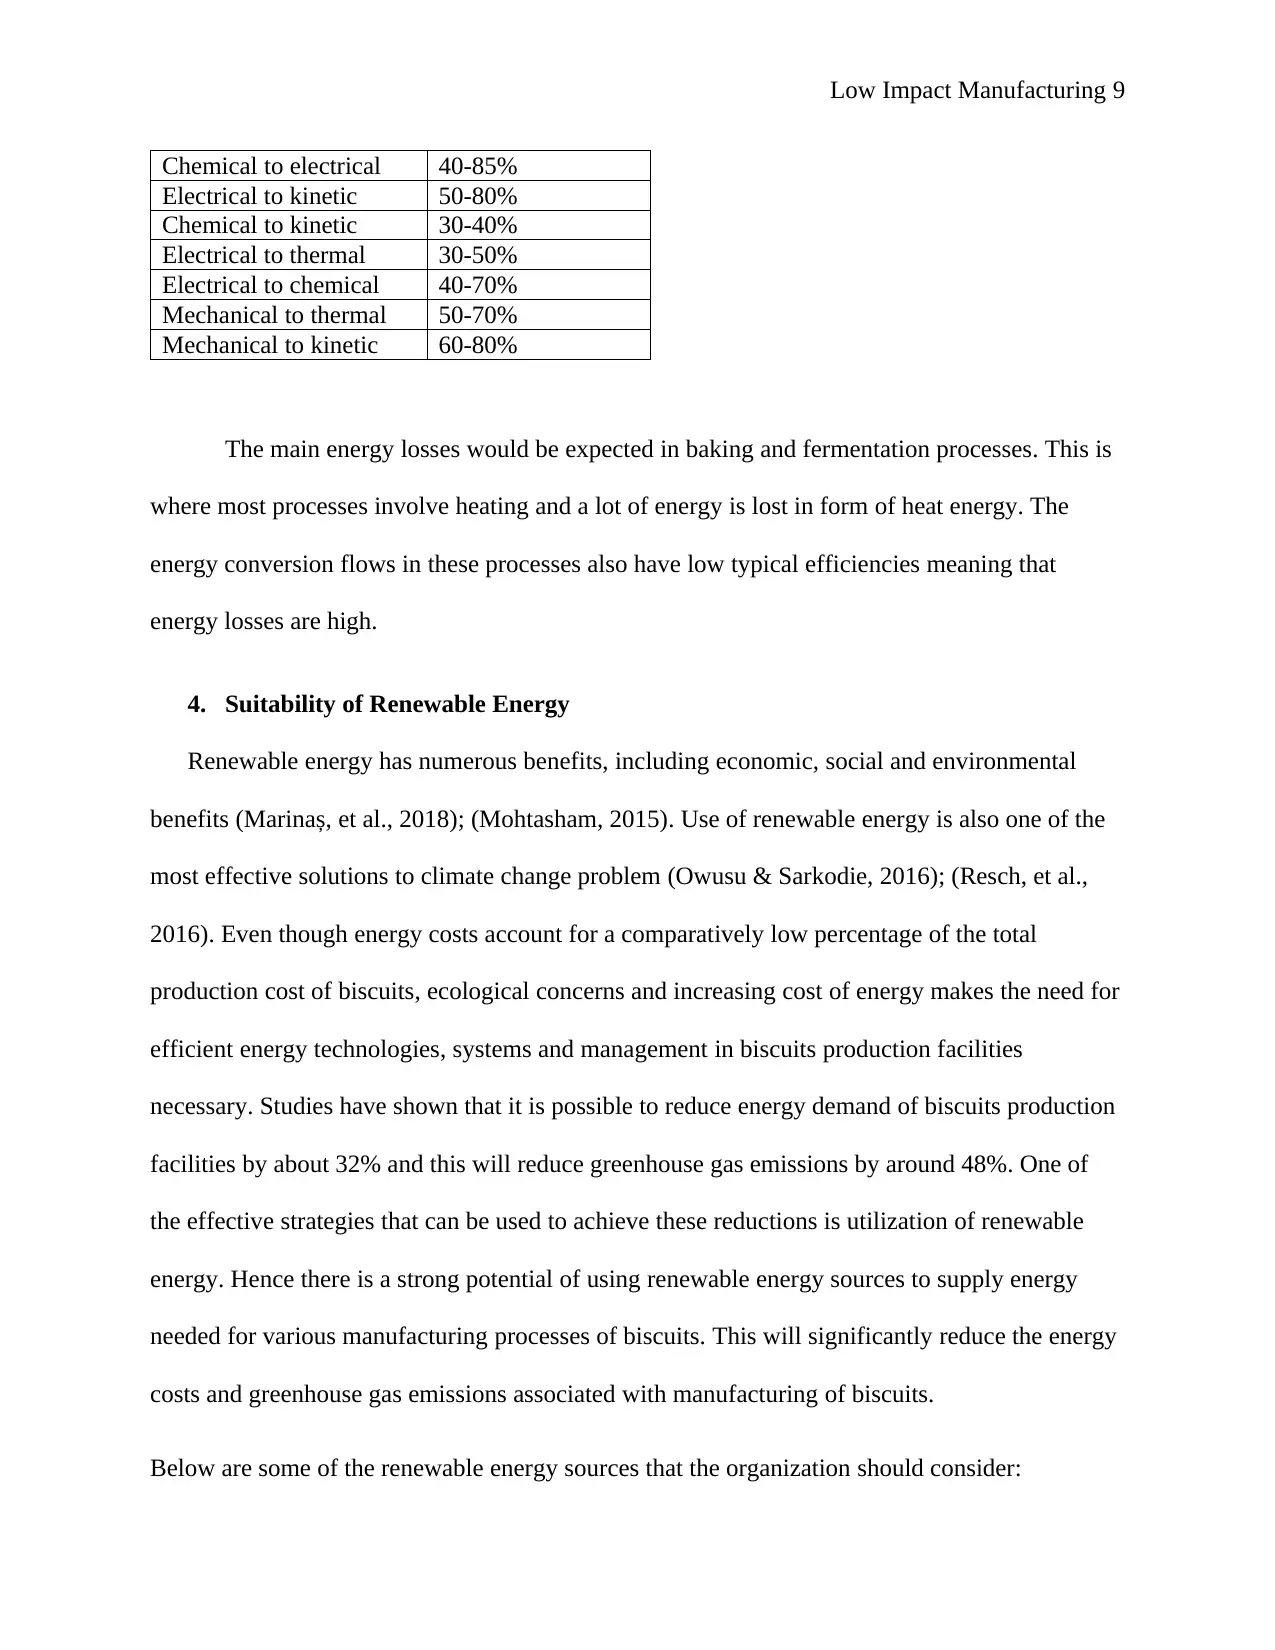
There are numerous energy conversions that took place in the five different
manufacturing processes. The various forms of energy include: electrical energy, kinetic energy,
chemical energy, potential energy, thermal energy and mechanical energy. It was possible to
convert each of these forms into the other. Table 2 below shows some of the energy conversions
and the typical efficiencies.
Table 2: Energy conversions and typical efficiencies
Energy conversion Typical efficiency
Kinetic to electrical 40-60%
Mechanical to electrical 40-70%
Electrical to mechanical 40-60%
The Sankey diagram helps in visualizing how energy flows from one process to another
(Lupton & Allwood, 2017). This makes it easier to identify areas of focus to improve energy
efficiency. Details of energy flows through different processes are provided in Table 1 below
Table 1: Energy flows through manufacturing processes
Process Fuel/oil
(MJ)
Natural
gas
(MJ)
Electricity
(MJ)
Total
Energy
(MJ)
Applied
Energy
Process
End Use
Losses
Conversion
Efficiency
Mixing 0.4 0.32 0.18 0.9 0.5 0.4 55.6%
Fermentation 0.1 0.62 0.08 0.8 0.56 0.24 70%
Moulding/shaping 0.12 0.2 0.08 0.4 0.24 0.16 60%
Baking 3.2 1.8 0.6 5.6 3.4 2.2 60.7%
Cooling 0.18 0.06 0.06 0.3 0.1 0.2 33.%
Total 4 3 1 8 4.8 3.2
There are two main categories of energy in the last two columns of able 1 above. Applied
energy is the energy that was used in the manufacturing processes and the process end use losses
is the amount of energy lost (Kurup, et al., 2016). A total of 4.8MJ (60%) was used while 3.2MJ
(40%) was lost. Details of energy flows are provided in Appendix 2, 3 and 4.
There are numerous energy conversions that took place in the five different
manufacturing processes. The various forms of energy include: electrical energy, kinetic energy,
chemical energy, potential energy, thermal energy and mechanical energy. It was possible to
convert each of these forms into the other. Table 2 below shows some of the energy conversions
and the typical efficiencies.
Table 2: Energy conversions and typical efficiencies
Energy conversion Typical efficiency
Kinetic to electrical 40-60%
Mechanical to electrical 40-70%
Electrical to mechanical 40-60%
Low Impact Manufacturing 9
Chemical to electrical 40-85%
Electrical to kinetic 50-80%
Chemical to kinetic 30-40%
Electrical to thermal 30-50%
Electrical to chemical 40-70%
Mechanical to thermal 50-70%
Mechanical to kinetic 60-80%
The main energy losses would be expected in baking and fermentation processes. This is
where most processes involve heating and a lot of energy is lost in form of heat energy. The
energy conversion flows in these processes also have low typical efficiencies meaning that
energy losses are high.
4. Suitability of Renewable Energy
Renewable energy has numerous benefits, including economic, social and environmental
benefits (Marinaș, et al., 2018); (Mohtasham, 2015). Use of renewable energy is also one of the
most effective solutions to climate change problem (Owusu & Sarkodie, 2016); (Resch, et al.,
2016). Even though energy costs account for a comparatively low percentage of the total
production cost of biscuits, ecological concerns and increasing cost of energy makes the need for
efficient energy technologies, systems and management in biscuits production facilities
necessary. Studies have shown that it is possible to reduce energy demand of biscuits production
facilities by about 32% and this will reduce greenhouse gas emissions by around 48%. One of
the effective strategies that can be used to achieve these reductions is utilization of renewable
energy. Hence there is a strong potential of using renewable energy sources to supply energy
needed for various manufacturing processes of biscuits. This will significantly reduce the energy
costs and greenhouse gas emissions associated with manufacturing of biscuits.
Below are some of the renewable energy sources that the organization should consider:
⊘ This is a preview!⊘
Do you want full access?
Subscribe today to unlock all pages.
Trusted by 1+ million students worldwide
Low Impact Manufacturing 10
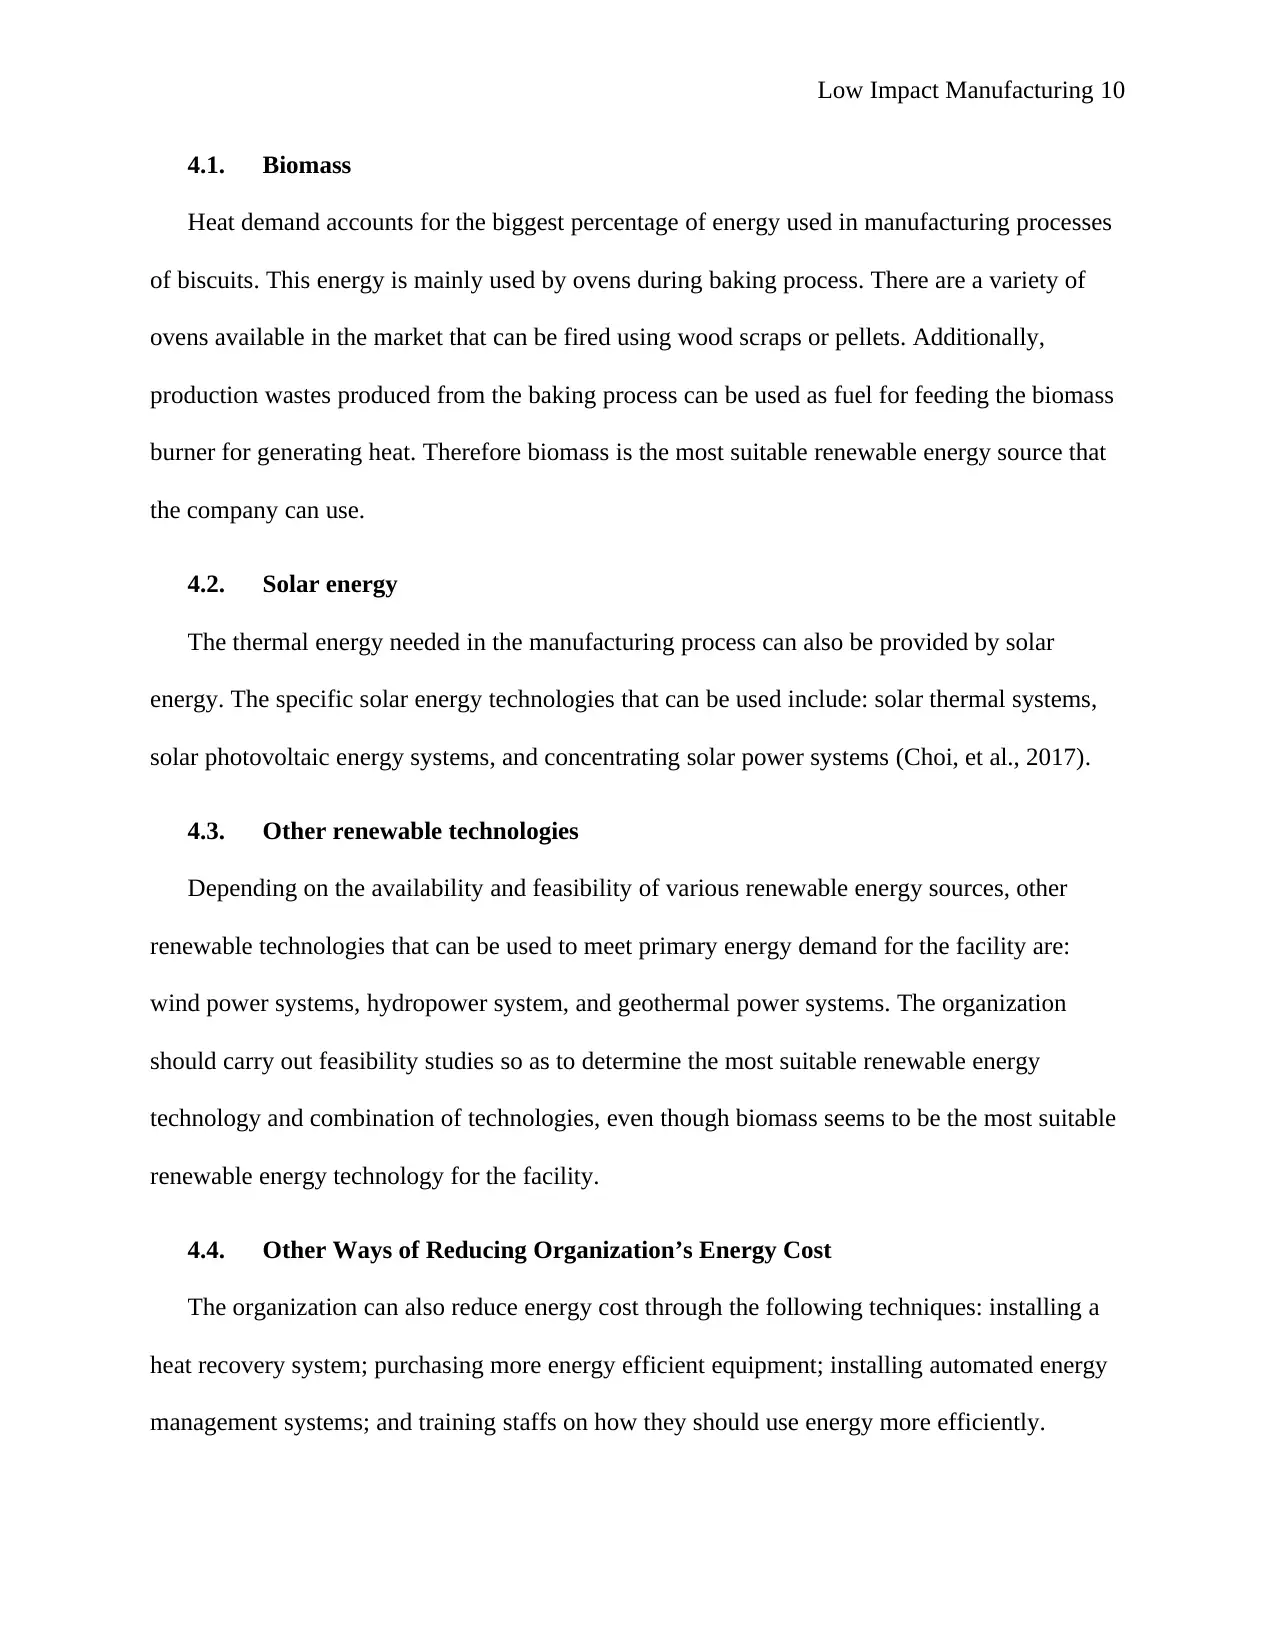
4.1. Biomass
Heat demand accounts for the biggest percentage of energy used in manufacturing processes
of biscuits. This energy is mainly used by ovens during baking process. There are a variety of
ovens available in the market that can be fired using wood scraps or pellets. Additionally,
production wastes produced from the baking process can be used as fuel for feeding the biomass
burner for generating heat. Therefore biomass is the most suitable renewable energy source that
the company can use.
4.2. Solar energy
The thermal energy needed in the manufacturing process can also be provided by solar
energy. The specific solar energy technologies that can be used include: solar thermal systems,
solar photovoltaic energy systems, and concentrating solar power systems (Choi, et al., 2017).
4.3. Other renewable technologies
Depending on the availability and feasibility of various renewable energy sources, other
renewable technologies that can be used to meet primary energy demand for the facility are:
wind power systems, hydropower system, and geothermal power systems. The organization
should carry out feasibility studies so as to determine the most suitable renewable energy
technology and combination of technologies, even though biomass seems to be the most suitable
renewable energy technology for the facility.
4.4. Other Ways of Reducing Organization’s Energy Cost
The organization can also reduce energy cost through the following techniques: installing a
heat recovery system; purchasing more energy efficient equipment; installing automated energy
management systems; and training staffs on how they should use energy more efficiently.
Paraphrase This Document
Need a fresh take? Get an instant paraphrase of this document with our AI Paraphraser
Low Impact Manufacturing 11
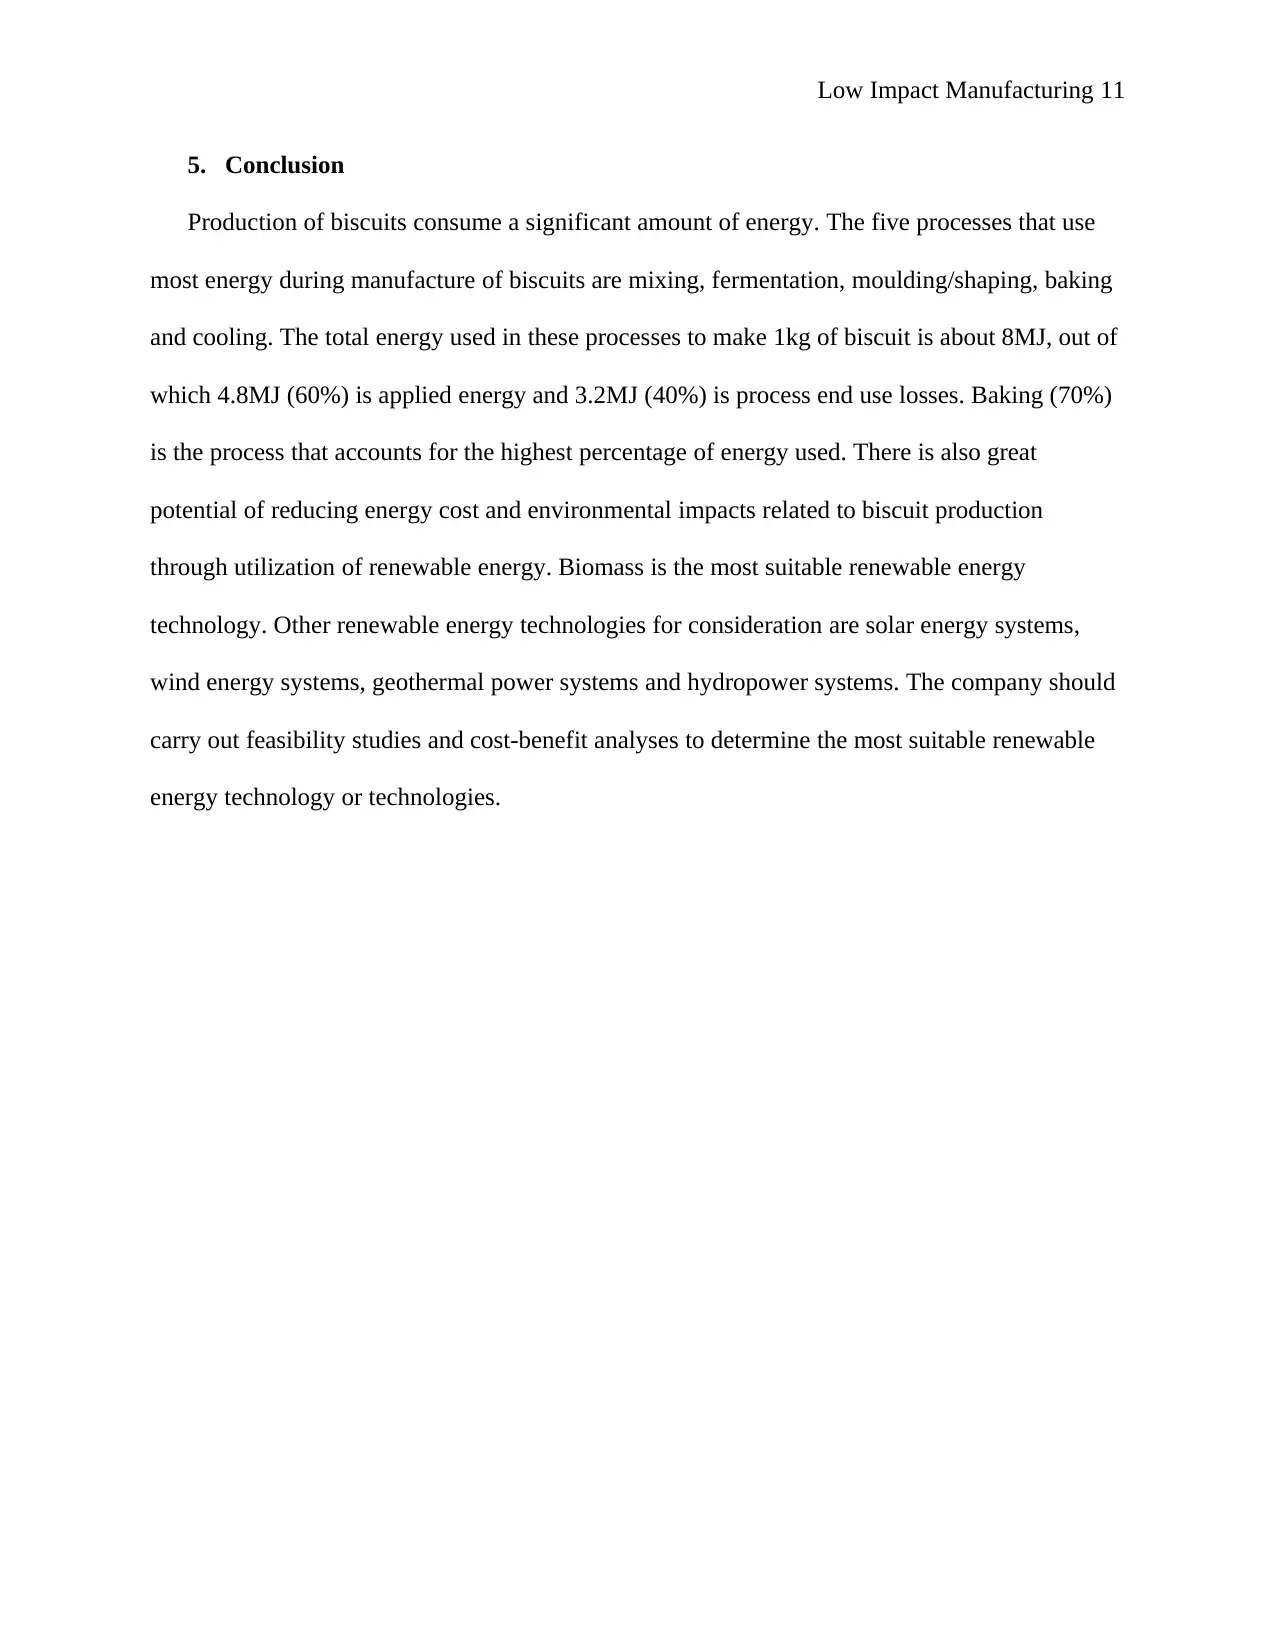
5. Conclusion
Production of biscuits consume a significant amount of energy. The five processes that use
most energy during manufacture of biscuits are mixing, fermentation, moulding/shaping, baking
and cooling. The total energy used in these processes to make 1kg of biscuit is about 8MJ, out of
which 4.8MJ (60%) is applied energy and 3.2MJ (40%) is process end use losses. Baking (70%)
is the process that accounts for the highest percentage of energy used. There is also great
potential of reducing energy cost and environmental impacts related to biscuit production
through utilization of renewable energy. Biomass is the most suitable renewable energy
technology. Other renewable energy technologies for consideration are solar energy systems,
wind energy systems, geothermal power systems and hydropower systems. The company should
carry out feasibility studies and cost-benefit analyses to determine the most suitable renewable
energy technology or technologies.
Low Impact Manufacturing 12
References
Choi, Y., Lee, C. & Song, J., 2017. Review of renewable energy technologies utilized in the oil and gas
industry. International Journal of Renewable Energy Research, 7(2), pp. 592-598.
Davidson, I., 2018. Biscuit, Cookie, and Cracker Production: Process, Production, and Packaging
Equipment. Cambridge, Massachusetts: Academic Press.
Guiffrida, A., Romano, M. & Lozza, 2011. Thermodynamic analysis of air-blown gasification for IGCC
applications. App. Energy, 88(1), pp. 3949-3958.
Hu, G., Ou, X., Zhang, Q. & Karplus, V., 2013. Analysis on energy-water nexus by Sankey diagram: The
case of Beijing. Desalination and Water Treatment, 51(19-21), pp. 4183-4193.
Khoshkhoo, R. & Omrani, M., 2017. Energy Audits and Recovery in the Production of Industrial Bread and
Pastry. Instanbul, Turkey, Yildiz Technical University.
Kurup, P., Zhu, G. & Turchi, C., 2016. Solar Process Heat Potential in California, USA. Golden, Colorado,
National Renewable Energy Laboratory.
Lupton, R. & Allwood, J., 2017. Hybrid Sankey diagrams: Visual analysis of multidimensional data for
understanding resource use. Resources, Conservation and Recycling, 124(1), pp. 141-151.
Mani, M; Madan, J; Lee, J.H; Lyons, K.W. & Gupta, S.K., 2014. Sustainability characterisation for
manufacturing processes. International Journal of Production Research, 52(20), pp. 5895-5912.
Marinaș, M., Dinu, M., Socol, A. & Socol, C., 2018. Renewable energy consumption and economic
growth. Causality relationship in Central and Eastern European countries. PLoS ONE, 13(10), pp. 1-12.
Mohtasham, J., 2015. Review Article-Renewable Energies. Energy Procedia, 74(1), pp. 1289-1297.
Mordor Intlligence, 2018. Biscuits Market - Growth, Trends, and Forecast (2019 - 2024) , Gachibowli,
Hyderabad, India: Mordor Intelligence.
Noya, L.I; Vasilaki, V; Stojceska, V; Gonzalez-Garcia, S; Kleynhans, C; Tassou, S; Moreira, M.T. & Katsou,
E., 2018. An environmental evaluation of food supply chain using life cycle assessment: A case study on
gluten free biscuit products. Journal of Cleaner Production, 170(1), pp. 451-461.
Owusu, P. & Sarkodie, S., 2016. A review of renewable energy sources, sustainability issues and climate
change mitigation. Cogent Engineering, 3(1), pp. 1-12.
Resch, G; Welisch, M; Liebmann, L; Breitschopf, B. & Held, A., 2016. A prospective assessment of costs
and benefits of renewable energy use in the European union. Energy & Environment, 27(1), pp. 10-27.
⊘ This is a preview!⊘
Do you want full access?
Subscribe today to unlock all pages.
Trusted by 1+ million students worldwide
1 out of 15
Related Documents


Your All-in-One AI-Powered Toolkit for Academic Success.
+13062052269
info@desklib.com
Available 24*7 on WhatsApp / Email
![[object Object]](/_next/static/media/star-bottom.7253800d.svg)
Unlock your academic potential
Copyright © 2020–2026 A2Z Services. All Rights Reserved. Developed and managed by ZUCOL.