University Research Report: Loyalty Card and Customer Satisfaction
VerifiedAdded on 2020/04/01
|24
|4116
|385
Report
AI Summary
This report analyzes the association between loyalty cards and customer satisfaction in the retail industry, focusing on the Middle East market. It investigates the relationships between frequency level, customer trust, service quality, and customer loyalty. The research employs secondary data and utilizes statistical tools like Minitab and MS Excel to analyze the data, including descriptive statistics, bivariate regression, and logistic regression. The report tests several hypotheses regarding the impact of loyalty cards on customer satisfaction and identifies key factors influencing customer behavior. Findings are presented in tables and figures, offering insights into the effectiveness of loyalty programs and their impact on customer loyalty, service quality, and overall satisfaction. The study concludes with interpretations of the results and implications for retail businesses.
Running head: EFFECT OF LOYALTY CARD ON CUSTOMER SATISFACTION
Effect of Loyalty Card on Customer Satisfaction
Name of the Student:
Name of the University:
Author’s Note:
Effect of Loyalty Card on Customer Satisfaction
Name of the Student:
Name of the University:
Author’s Note:
Paraphrase This Document
Need a fresh take? Get an instant paraphrase of this document with our AI Paraphraser
EFFECT OF LOYALTY CARD ON CUSTOMER SATISFACTION 1
Executive Summary
The report aims to analyze the association between loyalty card and satisfaction of customers
perceived in the retail industry. The objective is consists of few hypotheses and their
interpretation. The first question is about the relationship between frequency level and all other
factors such as Customer loyalty, service quality, customer trust, commitment and shopping. The
second question addresses the association between frequency and customer trust. The third one is
concerned about the association between quality of service and customer trust. The fourth one is
for finding the association between service qualities and shopping. The fifth objective is to find
the link between service quality and customer trust. The last one is between service quality and
commitment level.
Analyzed data about loyalty card and customer satisfaction is secondary in nature. In order to get
the necessary data analysis for Middle East retailing Industry, we used proper statistical tools
like Minitab and MS excel. The results of the conducted analysis helped us to draw the necessary
interpretations for conclusion. The tables of descriptive statistics, bivariate regression model and
logistic regression model are provided in the report.
EFFECT OF LOYALTY CARD ON CUSTOMER SATISFACTION 2
Table of contents
1.0. Introduction...........................................................................................................................3
1.1 Background and problem statement..................................................................................3
1.2Aim and research questions....................................................................................................4
1.0 Literature review...................................................................................................................4
2.1 Loyalty Card..........................................................................................................................4
2.2 Retail Services.......................................................................................................................5
2.3 The Scenario of Retail Industry in Middle East:...................................................................5
3.0 Methodology.........................................................................................................................6
3.1 Data collection.......................................................................................................................6
3.2 Data analysis..........................................................................................................................6
3.2.1Analysis Procedure and software approach:................................................................................7
3.2.2 Qualitative data summary:-........................................................................................................7
4.0 Quantitative Analysis and results:-.......................................................................................8
4.1 Descriptive statistic................................................................................................................8
4.2 Bivariate regression analysis...............................................................................................10
4.3 Logistic regression analysis.................................................................................................14
5.0 Discussion and conclusion..................................................................................................17
References......................................................................................................................................18
Appendix........................................................................................................................................19
⊘ This is a preview!⊘
Do you want full access?
Subscribe today to unlock all pages.
Trusted by 1+ million students worldwide
EFFECT OF LOYALTY CARD ON CUSTOMER SATISFACTION 3
1.0. Introduction
The customer satisfaction aims to target on researchers and marketing managers as a crucial
issue of loyalty of customers. The current studies proposed that delight of customer perhaps
generates more customer loyalty than customer satisfaction (Kim, Vogt, & Knutson, 2015).s
The background and problem statement, aims and objectives as well as justification are in the
first segment of the report. In the second part, a literature review would provide in-depth
information about the topic. The preceding segment would inform about the applied
methodology including data collection and data analysis (Sachs, 2015). The research project is
accomplished with a conclusion in the last part.
1.1 Background and problem statement
Now days, loyalty has become the major concern to researchers and marketing managers
as a multiphase idea and a useful part of customers with accompanying targeted strategies. It is
an empirical study on satisfaction of the customers, delight and loyalty. The major aim of this
study is to make out how loyalty gets influence from customer satisfaction and customer delight
to make out the multiphase framework of loyalty and cognitive loyalties (Bowen and Chen
McCain, 2015).
A key driver for loyalty card in retail industry contributes the body of knowledge.
Because of rapidly growing globalization, the environment of competition is growing in retail
industry that is making more innovations. It ensures a retailing organization to prosper and build
a competitive advantage (Maier et al., 2014).
Paraphrase This Document
Need a fresh take? Get an instant paraphrase of this document with our AI Paraphraser
EFFECT OF LOYALTY CARD ON CUSTOMER SATISFACTION 4
In Middle East countries like Qatar, Saudi Arabia, Jordan and Israel, the analytical study
based on primary collected data shows that rapidly growing graph. Tangibles areas have the
highest customers’ perception and competence areas have lowest customers’ perception (Hossain
and Leo, 2014).
1.2Aim and Questions of Research
The key objective of this research project is to analyze the association exists between
Customer loyalty and customer satisfaction. The aim could be achieved with the help of below
mentioned questions of research:
1. Are all the other factors associating with frequency level?
2. What relationship exists between frequency level and customer trust?
3. Is there a linkage between frequency level and commitment?
4. Is there an association between service quality and customer trust?
5. What relationship exists between Customer loyalty and service quality?
6. Is there any association between commitment and customer trust?
7. What linkage exists between shopping and customer trust?
1.0 Literature review
2.1 Loyalty Card
In general, the aim of the report is to evaluate the quality of service in retail hospitality
sector in the Middle East. This relies on various levels of perceptions of the consumers regarding
quality of service. The typical focus is to increase the technological and organizational aspects of
e-business (Sayigh, 2014). This is consistent with the resource-based theory to integrate the
value creating marketing.
The study focuses to test the impact of dimension of quality of services on customer
loyalty. We observe two types of retail analysis such as person-to-person (salesperson level) and
person-to-firm (store level). The analysis indicates that service quality is positively linked with
EFFECT OF LOYALTY CARD ON CUSTOMER SATISFACTION 5
loyalty of customers. The strength of loyalty of customers is a significant predictor to grow the
company level and reputation. Further discussion about discussion of loyalty card with frequency
level and managerial implications on retail trade are given below.
Owing to the growing competition in retail hospitality, the customer service is an
important part and hospitality managers should consider how to enhance satisfaction of
customers with respect to quality of service (Kim,Vogt and Knutson, 2015).
2.2 Retail Services
To achieve higher degrees of services of quality in retail services such as restaurants and
accomodation should deliver higher degrees of quality of service. In the present context,
perceptions of customers are high in the level of infrastructure and accommodation facilities of
the restaurants preceded by return on deposits. This report also includes the international
dimension to the retail services literature.
In terms of product innovation, the research on the resource-based approach that argues if
loyalty cards are strategically aimed at satisfaction of customers with respect to quality of
service. The report relates satisfaction of customer and customer perception in retail industry.
The study indicates that shopping, service quality and frequency level are crucial factors that
influence customer satisfaction. For achieving radical innovations, flexible working hours are
important of the employees of the company.
2.3 The Scenario of Retail Industry in Middle East:
The Middle East is an emerging and lucrative marketplace that has currently captured the
attention of the world-economy for economical reasons. The exploratory study examines the
⊘ This is a preview!⊘
Do you want full access?
Subscribe today to unlock all pages.
Trusted by 1+ million students worldwide
EFFECT OF LOYALTY CARD ON CUSTOMER SATISFACTION 6
association between small and medium retail enterprises (Wong and shoal 2003). According to
the organizational commitment, management and employees’ perception of services on a number
of the managers and employees propose the profit-enhancing business (Lee et al., 2014). The
behavior is same as western world. However, there are deviations related to the Middle East and
Western region in case of cultural and business characteristics. The Middle East is a richly
diverse region or more specifically a myriad of unique cultures (Mallakh and Mallakh, 2015). As
the market becomes more sophisticated, the value of quality of service enhances. If quality of
service increases, then the values of customer satisfaction, customer treat would increase. The
loyalty card would be more successful with the improvement of frequency level and commitment
level.
3.0 Methodology
3.1 Data collection
The target of this research project is to search if loyalty card could influence performance
level of customer satisfaction a company. As the project focuses on the association between
loyality of customer and customer satisfaction, we can mark it as a descriptive study. The data
analysis is based on collected secondary data.
Data for customer satisfaction in a retail industries such as hospitality, banking and
financial farms are collected through publicly available data. It examines the eight retailing areas
of eight different cities. The areas of retailing survey are Cairo, Dubai, Mecca, Doha, Jerusalem,
Amman, Damascus and Riyadh. The survey organization is eight reputed restaurants. The
restaurants are respectively Zitouni, Grossvenor House, Taboula, Choices, Machneyuda, Sufra,
Red Roster and Spazio. The types of restaurants are respectively Cafes, hotels, food courts, food
stores, accommodation, food markets, retail food strore and wholesale store. The results provide
Paraphrase This Document
Need a fresh take? Get an instant paraphrase of this document with our AI Paraphraser
EFFECT OF LOYALTY CARD ON CUSTOMER SATISFACTION 7
a moderate index for overall customer satisfaction of organisations that is used as data for the
analysis.
Loyalty level and customers submit the data that can be found on this website
anonymously. The data includes the rating of companies regarding their reputation and
popularity. People may rate these restaurants on a scale from one to five assuming five as the
best. The cumulative average of all reviews measures the rating of customer quality, service
quality and customer trust.
3.2 Data analysis
This research project focuses on describing the association among the independent
variable of customer satisfaction with the dependent variables such as shopping and frequency
count through the mediating variable of customer trust. The bivariate and multivariate regression
analyses are applied to study the relationship of factors behind loyalty and factors behind
customer satisfaction. The logistic regression was applied to analyze the relationship of quality
of service, level of frequency and customer trust (Sekaran and Bougie, 2013).
Following hypothesis would be tested (Lee et al., 2014):
H1: All the other factors are linearly associated with frequency level.
H2: The relationship exists between frequency level and customer trust.
H3: There is a linkage between frequency level and commitment.
H4: There is an association between service quality and customer trust.
H5: There is a relationship exists between Customer loyalty and service quality.
H6: There is an association between commitment and customer trust.
H7: A linkage exists between shopping and customer trust.
3.2.1Analysis Procedure and software approach:
The first part analysis is to find out the descriptive statistics among the different factors
of eight restaurants that are listed to measure customer satisfaction. The variables that are
EFFECT OF LOYALTY CARD ON CUSTOMER SATISFACTION 8
numeric and continuous in nature are respectively customer loyalty, service quality, customer
trust, commitment, shopping and frequencies. Therefore, the association could be explained by
the bivariate regression analysis. If any functional association would get detected, that would be
measured to get information about the strengths of the relationships among different factors.
Analysis was conducted with the help of MS excel and Minitab.
We can observe three non-numeric data such as Types, Name of restaurant and Area
located. We should ignore these variables in the data, as they are not applicable for descriptive
statistics, bivariate regression model and logistic regression model analysis.
3.2.2 Qualitative data summary:-
The “Sufra” food market in Amman has highest “Customer loyalty” (0.74901) whereas
lowest in “Choices” food stores in Doha (0.33631). The “Choices” food store in Doha (3.7854)
has highest service quality whereas “Machneyuda” accommodation place in Jerusalem has
lowest service quality (1.5739). The “Zitouni” Cafes in Cairo and “Spazio” wholesale store in
Riyadh has respectively the highest (98) and lowest (53) customer trust. The same result is
observed in case of commitment level where “Zitouni” and “Spazio” have highest (87) and
lowest (47) level of commitment. The shopping criterion is also highest in “Zitouni” (0.17845)
and lowest in “Spazio” (0.06016). Lastly, the frequency count is highest in “Zitouni” (388) and
lowest in “Sufra” (60).
The observed analysis indicates that “Zitouni” Café in Cairo provides best performance
and “Spazio” wholesale store provides worst performance in general among all the eight retail
stores.
⊘ This is a preview!⊘
Do you want full access?
Subscribe today to unlock all pages.
Trusted by 1+ million students worldwide
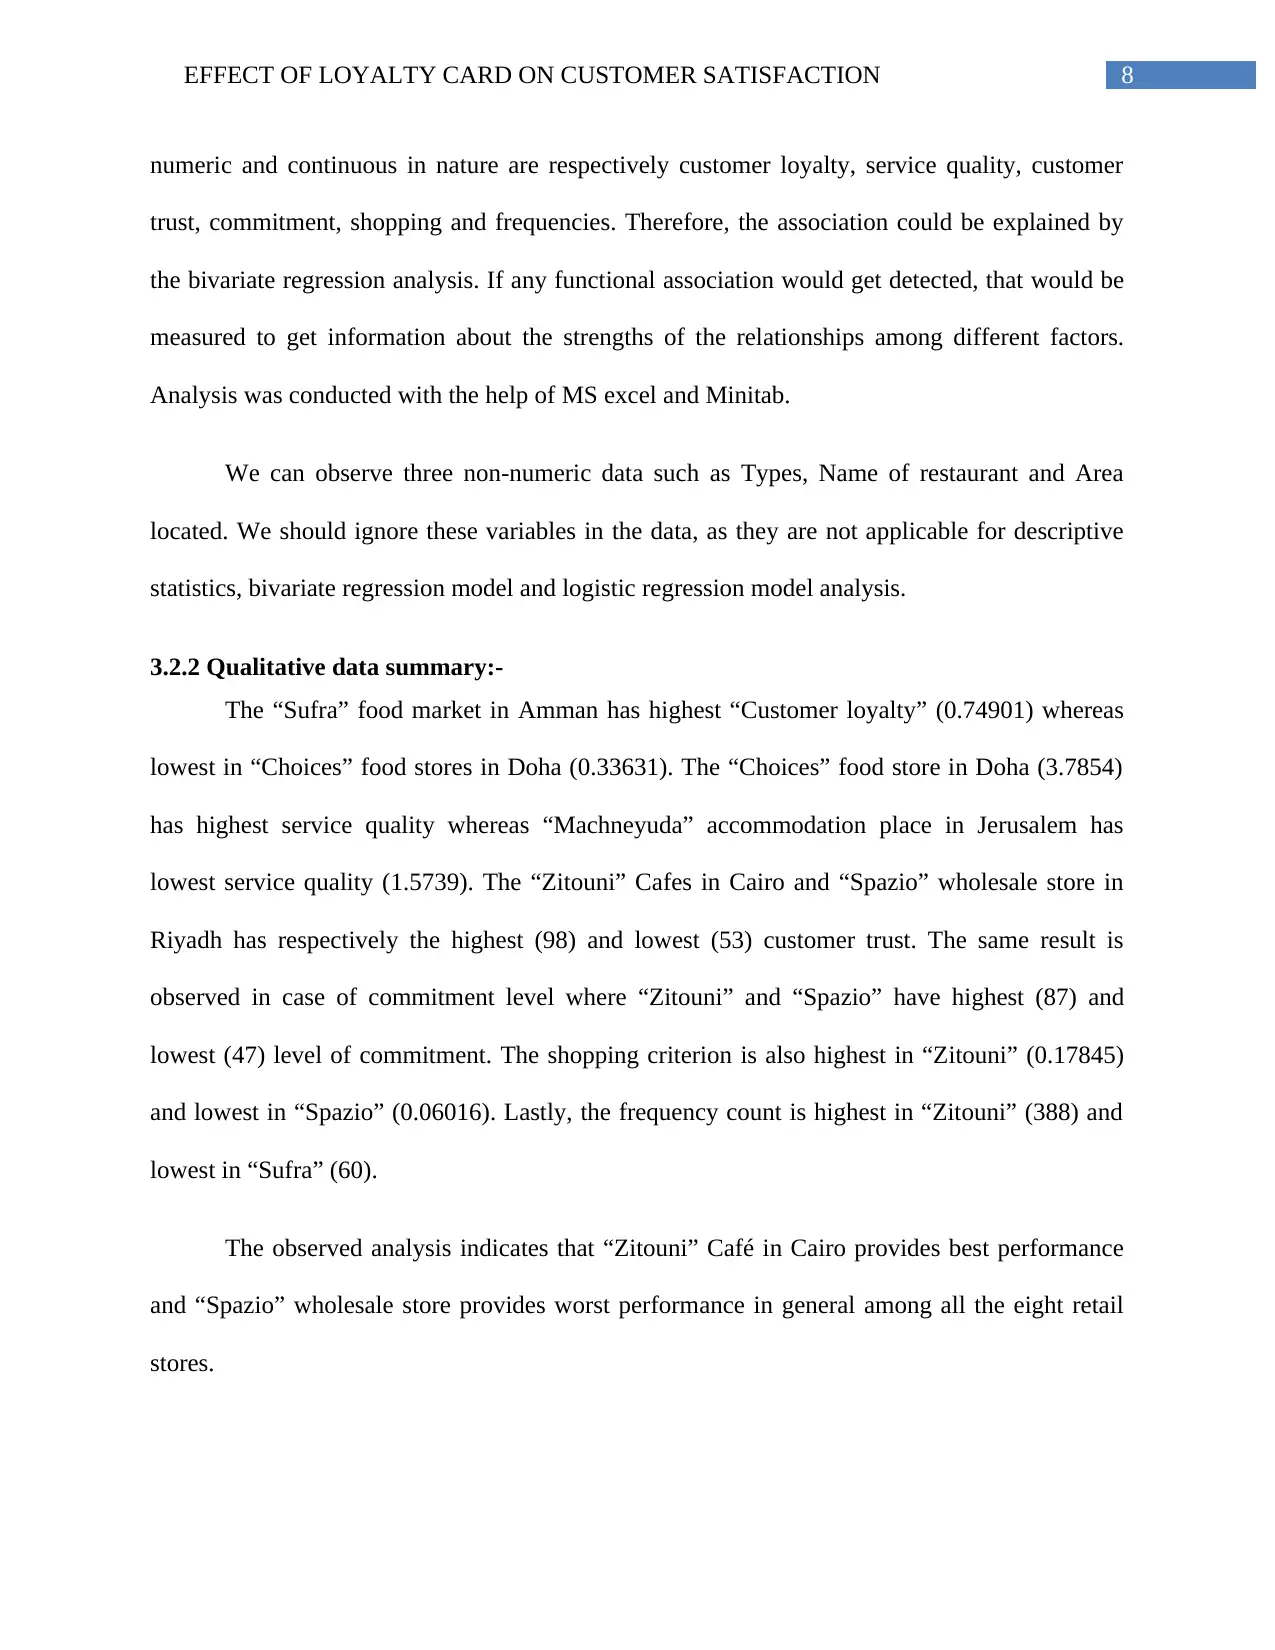
EFFECT OF LOYALTY CARD ON CUSTOMER SATISFACTION 9
4.0 Quantitative Analysis and results:-
4.1 Descriptive statistic
Table of continuous Variables for descriptive statistics:-
Table 1: Descriptive statistics of different factors of the data.
The descriptive statistics shows the mean, standard deviation, sample variance, median,
range, minimum, maximum, skewness and kurtosis of different factors of the data. The factors
are customer loyalty, service quality, customer trust, commitment, shopping, and frequencies
(Beekman, 2017).
Graphs of Categorical Variables with respect to continuous variables:
Zitouni
Grossvenor House
Taboula
choices
Machneyuda
Sufra
Red Roster
Spazio
0
0.1
0.2
0.3
0.4
0.5
0.6
0.7
0.8
Series1
Paraphrase This Document
Need a fresh take? Get an instant paraphrase of this document with our AI Paraphraser
EFFECT OF LOYALTY CARD ON CUSTOMER SATISFACTION 10
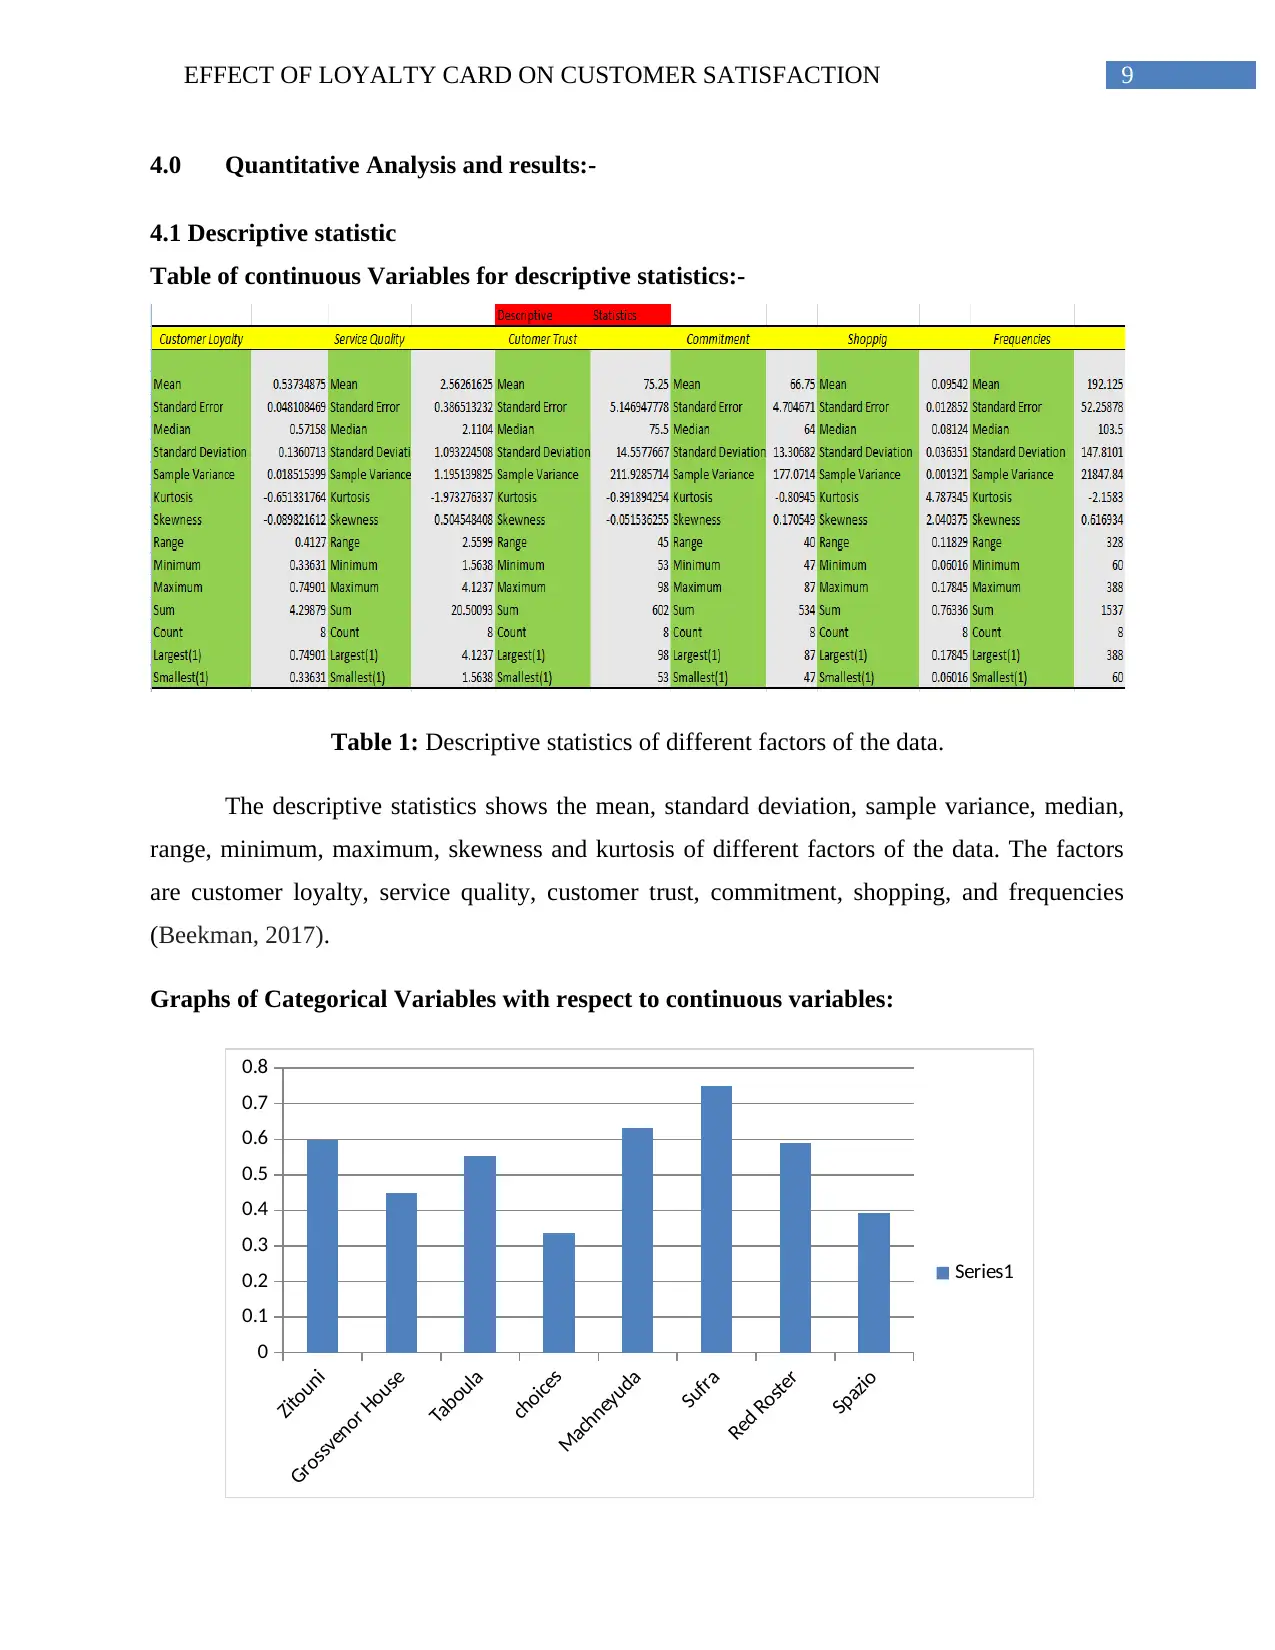
Figure 1: Customer Loyalty vs. Name of the restaurant (Weissgerber, 2014).
Customers are most loyal for “Sufra” food market.
Zitouni
Grossvenor House
Taboula
choices
Machneyuda
Sufra
Red Roster
Spazio
0
20
40
60
80
100
120
Series1
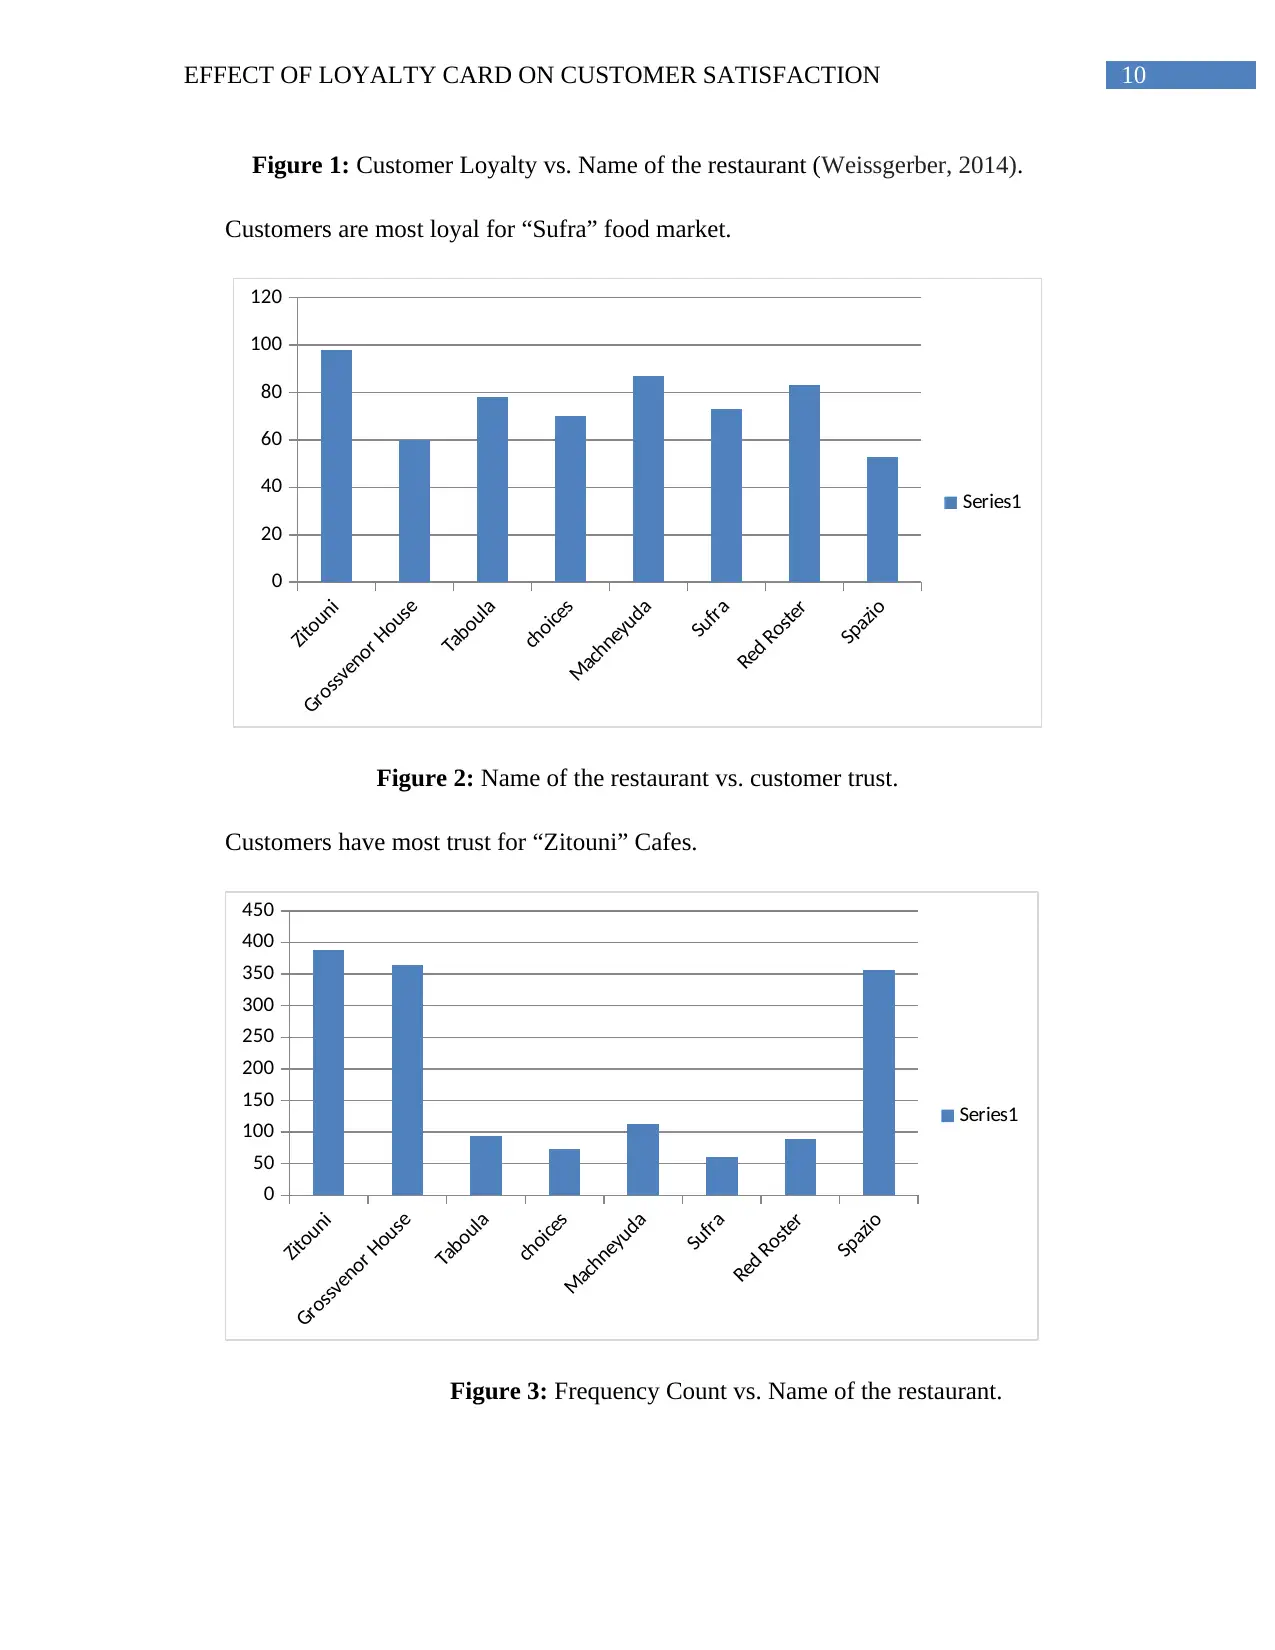
Figure 2: Name of the restaurant vs. customer trust.
Customers have most trust for “Zitouni” Cafes.
Zitouni
Grossvenor House
Taboula
choices
Machneyuda
Sufra
Red Roster
Spazio
0
50
100
150
200
250
300
350
400
450
Series1
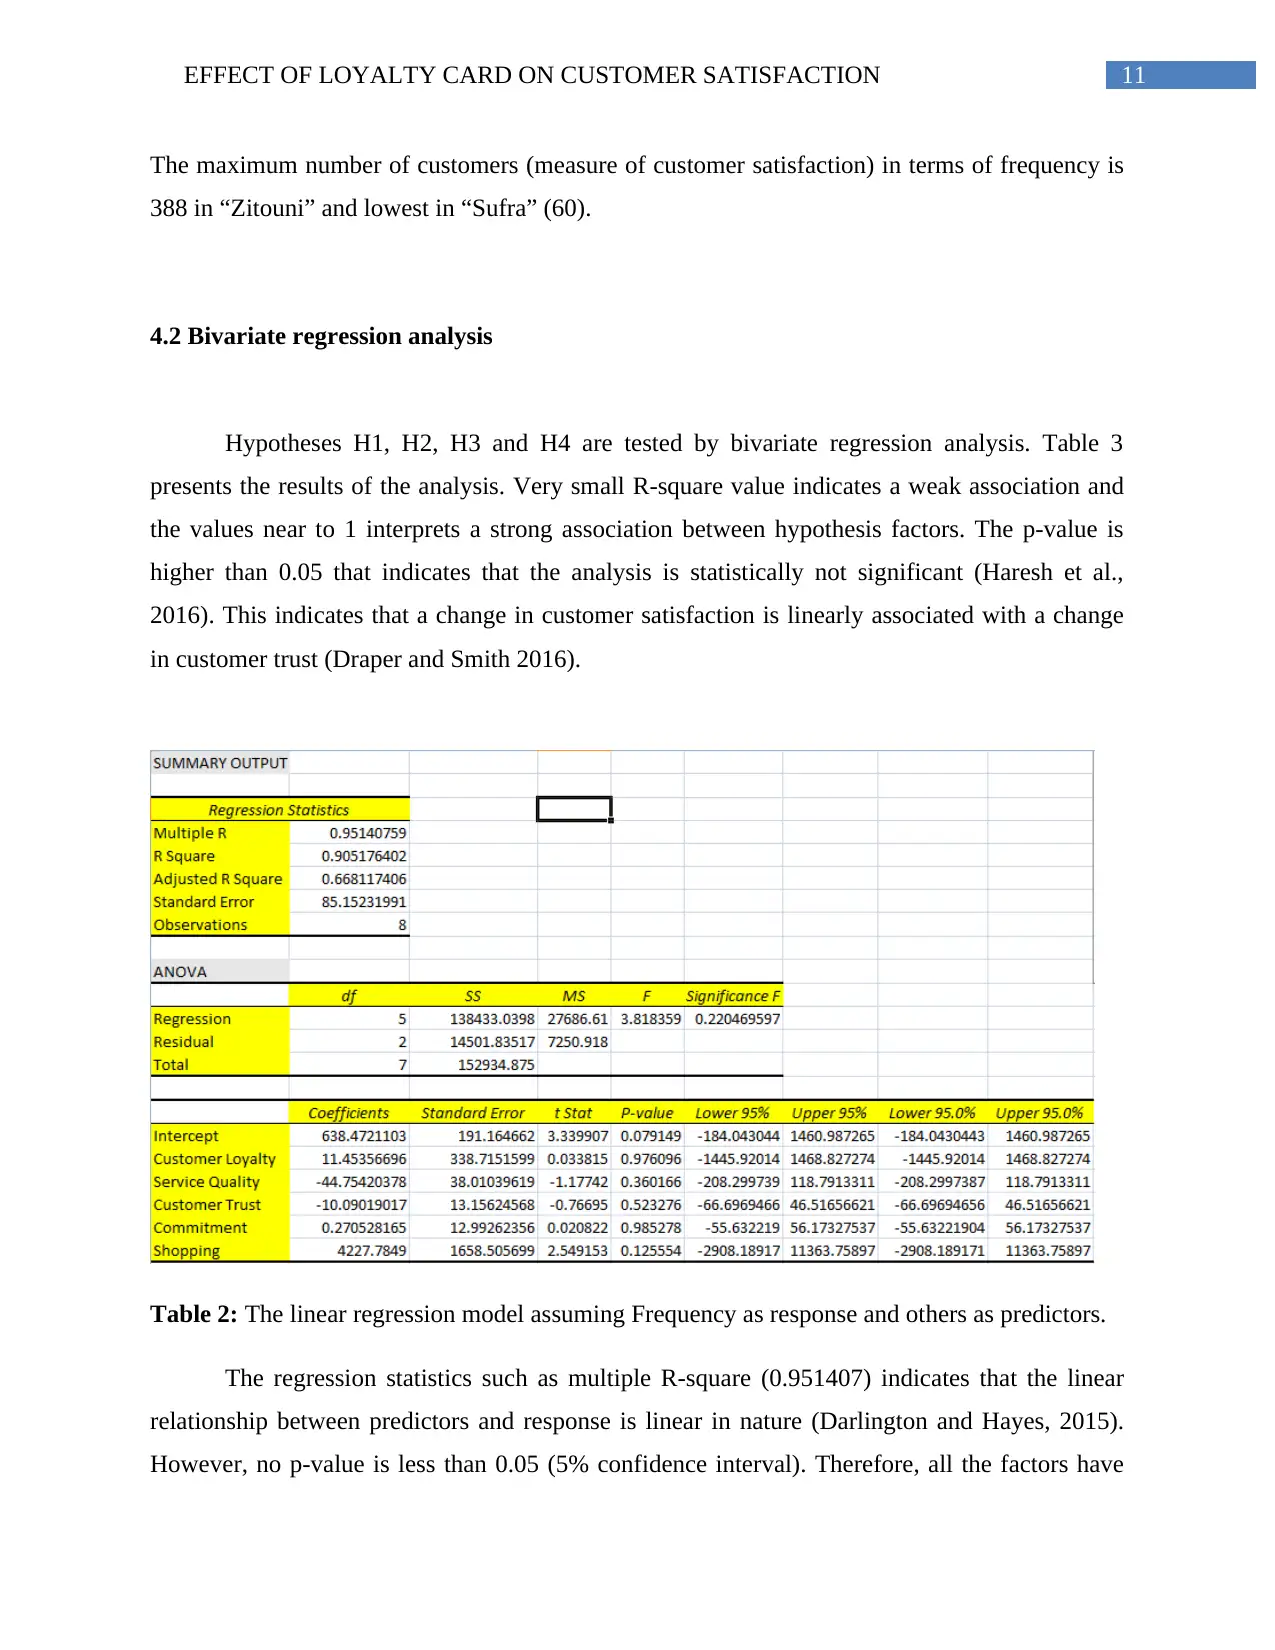
Figure 3: Frequency Count vs. Name of the restaurant.
Figure 1: Customer Loyalty vs. Name of the restaurant (Weissgerber, 2014).
Customers are most loyal for “Sufra” food market.
Zitouni
Grossvenor House
Taboula
choices
Machneyuda
Sufra
Red Roster
Spazio
0
20
40
60
80
100
120
Series1
Figure 2: Name of the restaurant vs. customer trust.
Customers have most trust for “Zitouni” Cafes.
Zitouni
Grossvenor House
Taboula
choices
Machneyuda
Sufra
Red Roster
Spazio
0
50
100
150
200
250
300
350
400
450
Series1
Figure 3: Frequency Count vs. Name of the restaurant.
EFFECT OF LOYALTY CARD ON CUSTOMER SATISFACTION 11
The maximum number of customers (measure of customer satisfaction) in terms of frequency is
388 in “Zitouni” and lowest in “Sufra” (60).
4.2 Bivariate regression analysis
Hypotheses H1, H2, H3 and H4 are tested by bivariate regression analysis. Table 3
presents the results of the analysis. Very small R-square value indicates a weak association and
the values near to 1 interprets a strong association between hypothesis factors. The p-value is
higher than 0.05 that indicates that the analysis is statistically not significant (Haresh et al.,
2016). This indicates that a change in customer satisfaction is linearly associated with a change
in customer trust (Draper and Smith 2016).
Table 2: The linear regression model assuming Frequency as response and others as predictors.
The regression statistics such as multiple R-square (0.951407) indicates that the linear
relationship between predictors and response is linear in nature (Darlington and Hayes, 2015).
However, no p-value is less than 0.05 (5% confidence interval). Therefore, all the factors have
⊘ This is a preview!⊘
Do you want full access?
Subscribe today to unlock all pages.
Trusted by 1+ million students worldwide
1 out of 24
Related Documents


Your All-in-One AI-Powered Toolkit for Academic Success.
+13062052269
info@desklib.com
Available 24*7 on WhatsApp / Email
![[object Object]](/_next/static/media/star-bottom.7253800d.svg)
Unlock your academic potential
Copyright © 2020–2026 A2Z Services. All Rights Reserved. Developed and managed by ZUCOL.